Amazon Elastic Container Service
Amazon Elastic Container Service (ECS) is a highly scalable container orchestration service, eliminating the need for you to install, configure, and manage your container orchestration infrastructure.
Observe helps you monitor the health and activity of Amazon ECS with the following features:
Datasets containing the details of your ECS clusters and services, allowing you to see services running in a selected cluster, and inspect corresponding attributes over time.
A board with at-a-glance insights, such as the health of services and clusters, CPU and memory utilization, and details of tasks for each service.
Sample Monitor configurations to alert you about common problems, such as task execution failures and threshold violations.
Providing additional datasets to inspect various resources related to your instances, such as container instances involved in tasks, and more.
Viewing ECS activity in Observe
To see details of your ECS services, go to the ECS Service dataset in Observe. The dashboard provides an overview of the state of your services.
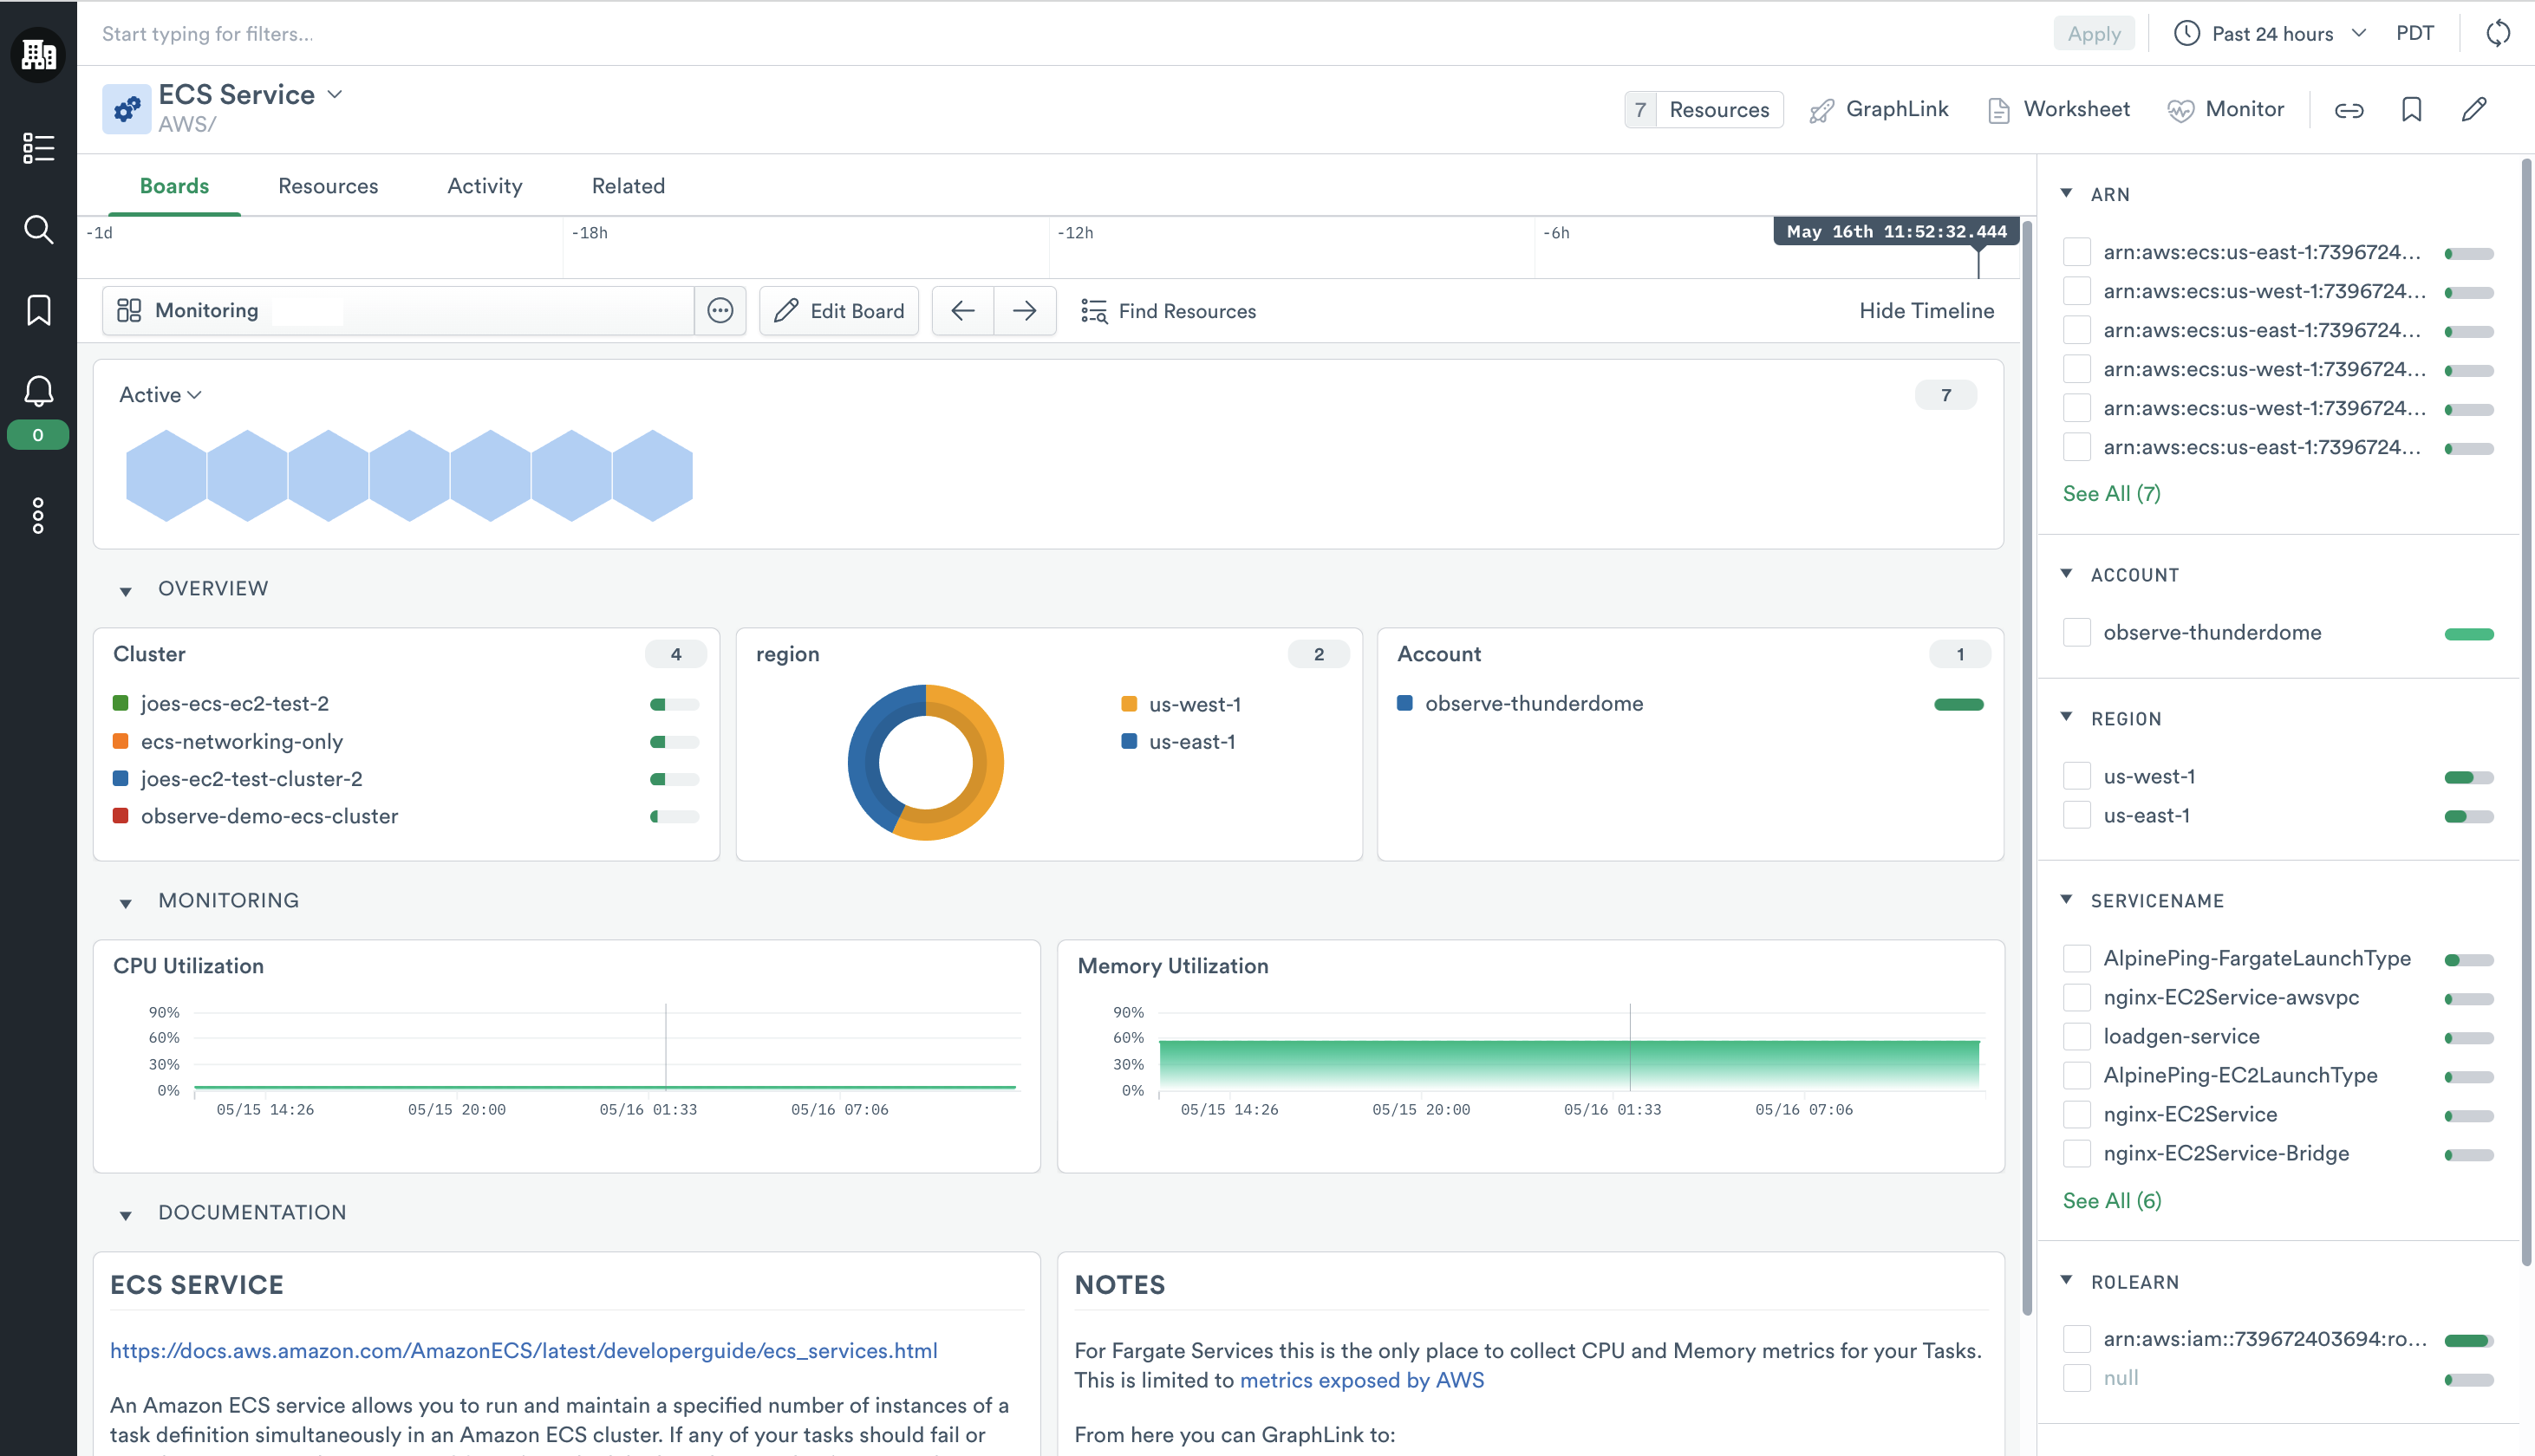
Figure 1 - ECS Dashboard
This board includes visualizations with information about your services. Use it to answer questions such as:
How many active services do I currently have on ECS?
Where are the ECS instances located?
Which clusters use those services?
How many resources are services consuming?
The Dashboard includes useful service metrics, such as:
CPU utilization
Memory utilization
For a complete list of ECS metrics collected, see Amazon Elastic Container Service metrics.
Filter to the items of interest, then use GraphLink to explore resources related to a cluster, service, or task:
Which clusters currently have active workloads? From either tasks or services, use GraphLink to view the related ECS Cluster.
Which tasks are associated with which services? From ECS Service, use GraphLink to view the related ECS Cluster.
What are the error messages from a failed task execution? From ECS Tasks, use GraphLink to view the related ECS Task Failure Event.
Monitors
The Observe ECS integration includes the following Monitor templates:
ECS Task Log Check
ECS Metrics Threshold Check
Setup
Install the Observe AWS Integration app and select ECS from the Configuration list. The installation creates corresponding datasets, and Monitors. To view CPU and Memory metrics, ensure you have enabled Container Insights for your cluster in the AWS Console.
To enable ECS Log collection see Amazon Elastic Container Log Collection