GCP BigQuery
Google Cloud BigQuery provides a completely serverless and cost-effective enterprise data warehouse. The application has built-in machine learning, BI, that works across clouds and scales with your data.
BigQuery provides the following features:
Built-in machine learning
Ability to analyze and share data across clouds
Provide real-time analytics with built-in query acceleration
Allow you to unify, manage, and govern all types of data
Includes geospatial analysis to augment your analytics workflows with location intelligence.
You can ingest BigQuery data into Observe by installing the GCP app and selecting BigQuery from the list of included features.
When you install GCP BigQuery using the app, Observe also includes the following content:
Datasets
GCP/BigQuery Audit Logs
GCP/BigQuery Dataset
GCP/BigQuery Job Logs
GCP/BigQuery Metrics
Resource sets
GCP/BigQuery Dataset
GCP/BigQuery Table
Dashboards
GCP/BigQuery Dataset Monitoring
GCP/BigQuery Project Monitoring
GCP/BigQuery Dataset Overview Monitoring
GCP/BigQuery Project Table Monitoring
Viewing Cloud BigQuery activity in Observe
The GCP Project BigQuery dashboard
To see the performance and activity of the BigQuery service in your GCP project, go to the Projects Collection Enabled dataset in Observe. The GCP/BigQuery Monitoring dashboard provides an overview of the performance of your BigQuery service across your GCP projects.
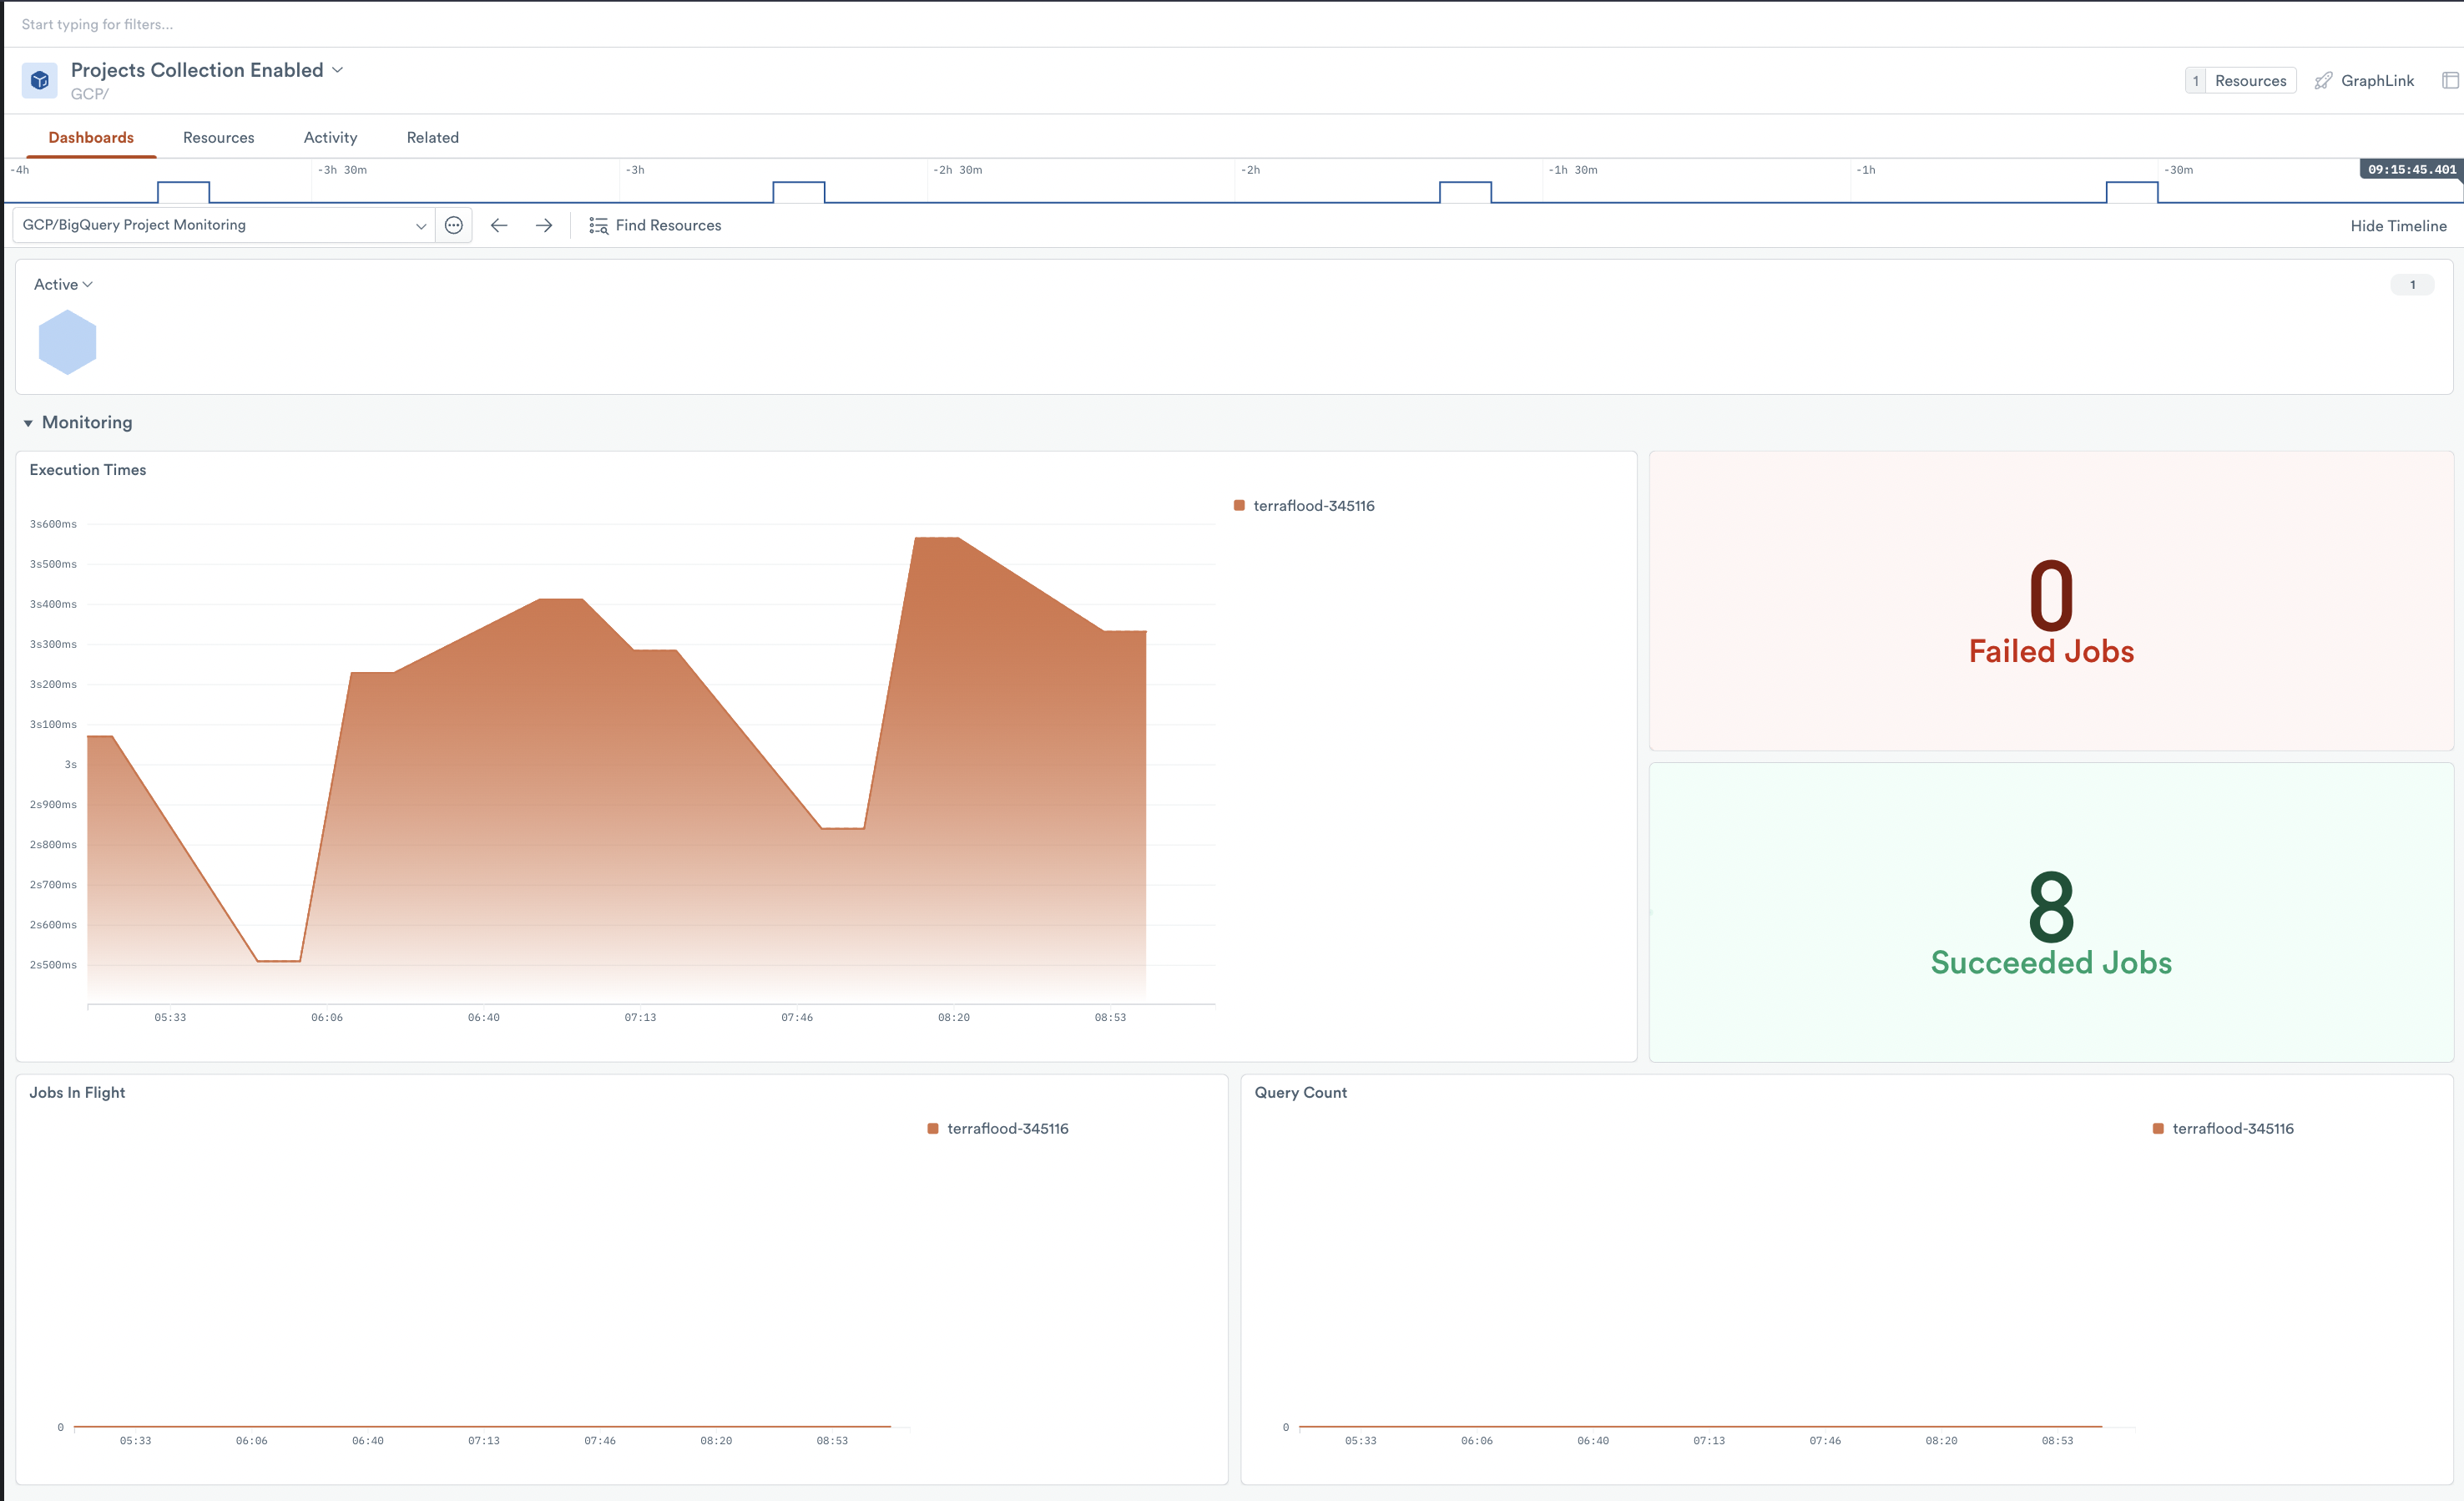
Figure 1 - The Monitoring dashboard for BigQuery service in GCP projects
The dashboard gives a high-level overview of the BigQuery service and details:
How long do queries take to execute?
Are the jobs executing successfully?
How many jobs are running?
How many queries are running?
For a complete list of the GCP metrics collected, see GCP BigQuery metrics.
The GCP BigQuery Dataset dashboard
To get a quick overview of your BigQuery datasets, go to the BigQuery Dataset dataset in Observe. The GCP/BigQuery Dataset Monitoring dashboard provides an overview of your BigQuery datasets.
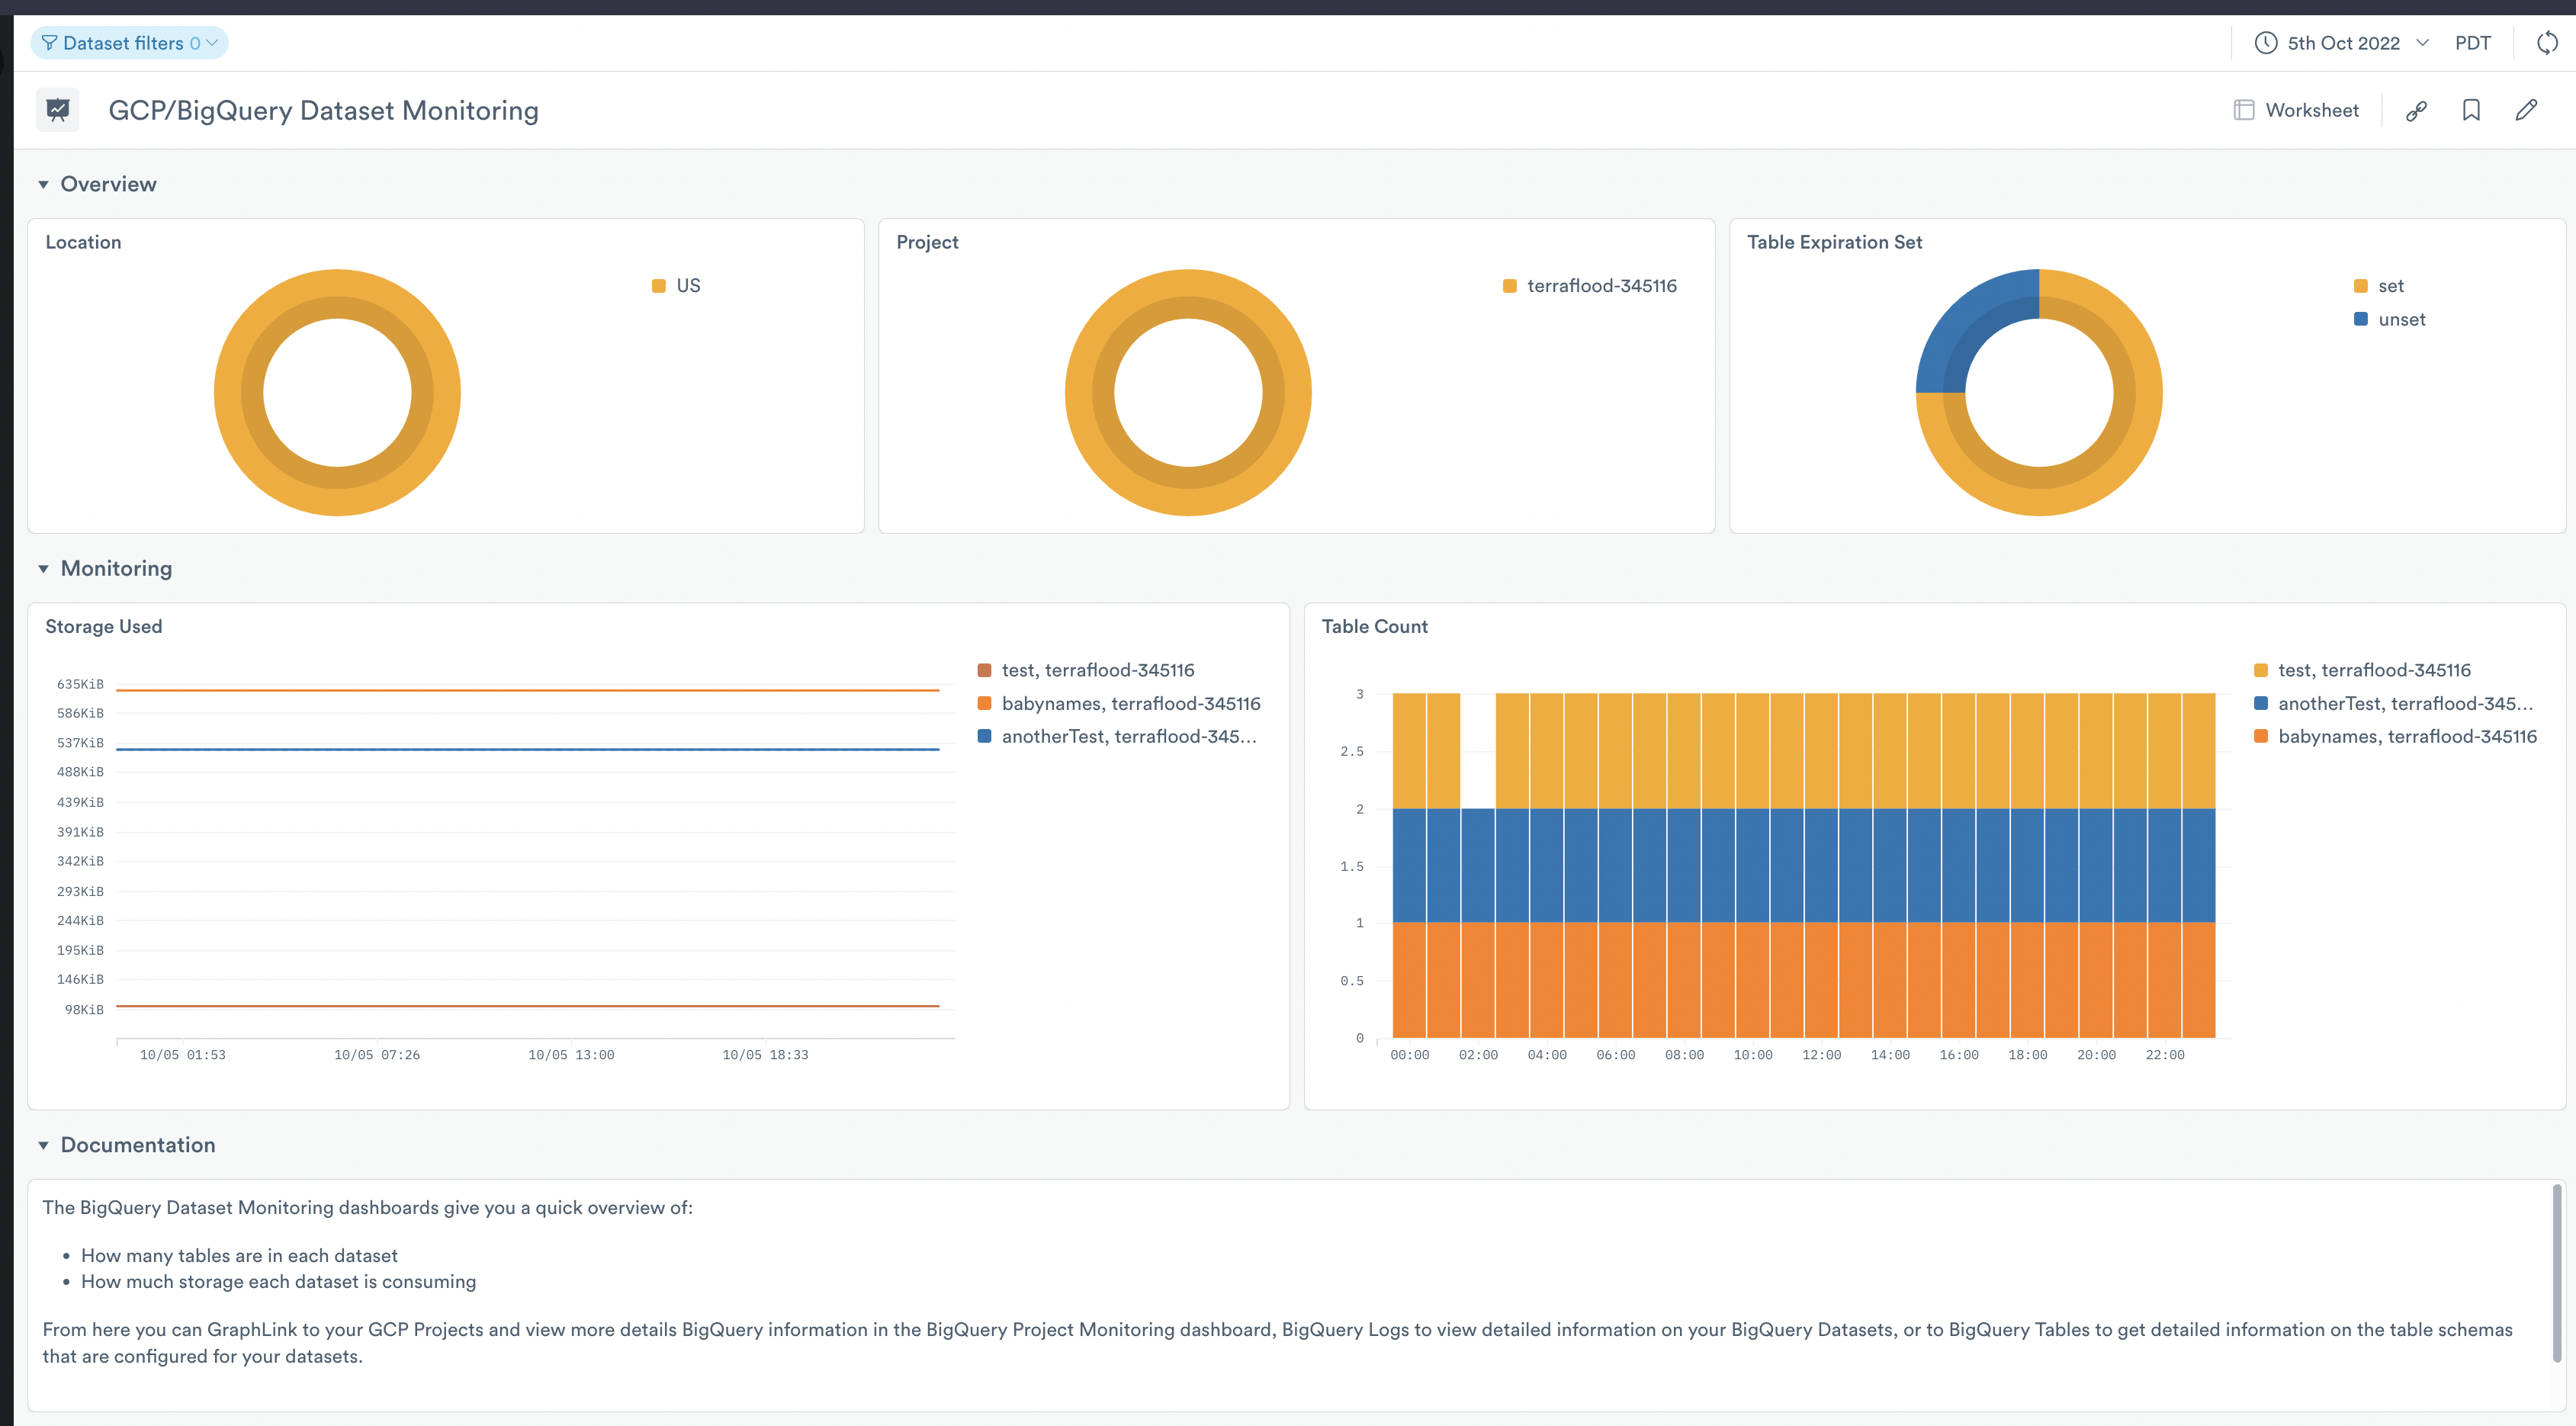
Figure 1 - The Monitoring dashboard for BigQuery service in GCP projects
The dashboard gives a high-level overview of your BigQuery datasets and allows you to view them at a glance:
How much storage do my datasets use?
How many tables are in my datasets?
Do my datasets have an expiration set on them?
BigQuery Components using GraphLink
Filter to the GCP project of interest and use GraphLink to examine related resources and datasets:
What jobs are failing in my project? Use GraphLink to link to the BigQuery Job Logs dataset.
Why did my query execution times change drastically? Use GraphLink to connect to the BigQuery Dataset resource to look for a change in table storage or table count.
You can use GraphLink to link to the underlying BigQuery components (tables and datasets), as well as related logs and metrics. The app includes the following datasets:
Setup
Install the Observe GCP app from the Apps page. See Observe apps for information on apps and how to install them.
Metrics
The default GCP app configuration adds bigquery.googleapis.com to the include_metric_type_prefixes option to enable data collection for metrics. If you have installed the app with custom settings, you may need to update the configuration to add this option.
Audit Logs
To enable logs, edit your backend service in GCP and select enable logging.