GCP Compute
Google Cloud Compute Engine (GCP Compute) allows you to create and run virtual machines on Google infrastructure.
Observe helps you monitor the health and activity of your GCP Compute instances with these features:
A dataset containing the details of individual GCP Compute instances, allowing you to investigate their status and attributes over time.
A dashboard with at-a-glance insights, such as CPU utilization, status check failures, and network throughput.
Additional datasets for resources related to your Compute instances, such as disk or logs.
Sample Monitor configurations to enable proactive alerting on changes in instance health.
Observe provides these tools as part of the Observe GCP Integration. To use them in your workspace, install the GCP app.
Note
To monitor the operating system or processes running on a GCP Compute instance (rather than the GCP information about that instance), see the Host Monitoring Integration. The Host Integration includes OS-level metrics such as memory usage and free disk space.
Viewing GCP Compute activity in Observe
The Monitoring dashboard
To see details of your GCP Compute instances, go to the GCP/Compute Instance dataset in Observe. The GCP/Compute Monitoring dashboard shows an overview of the activity and health of your GCP Compute instances.
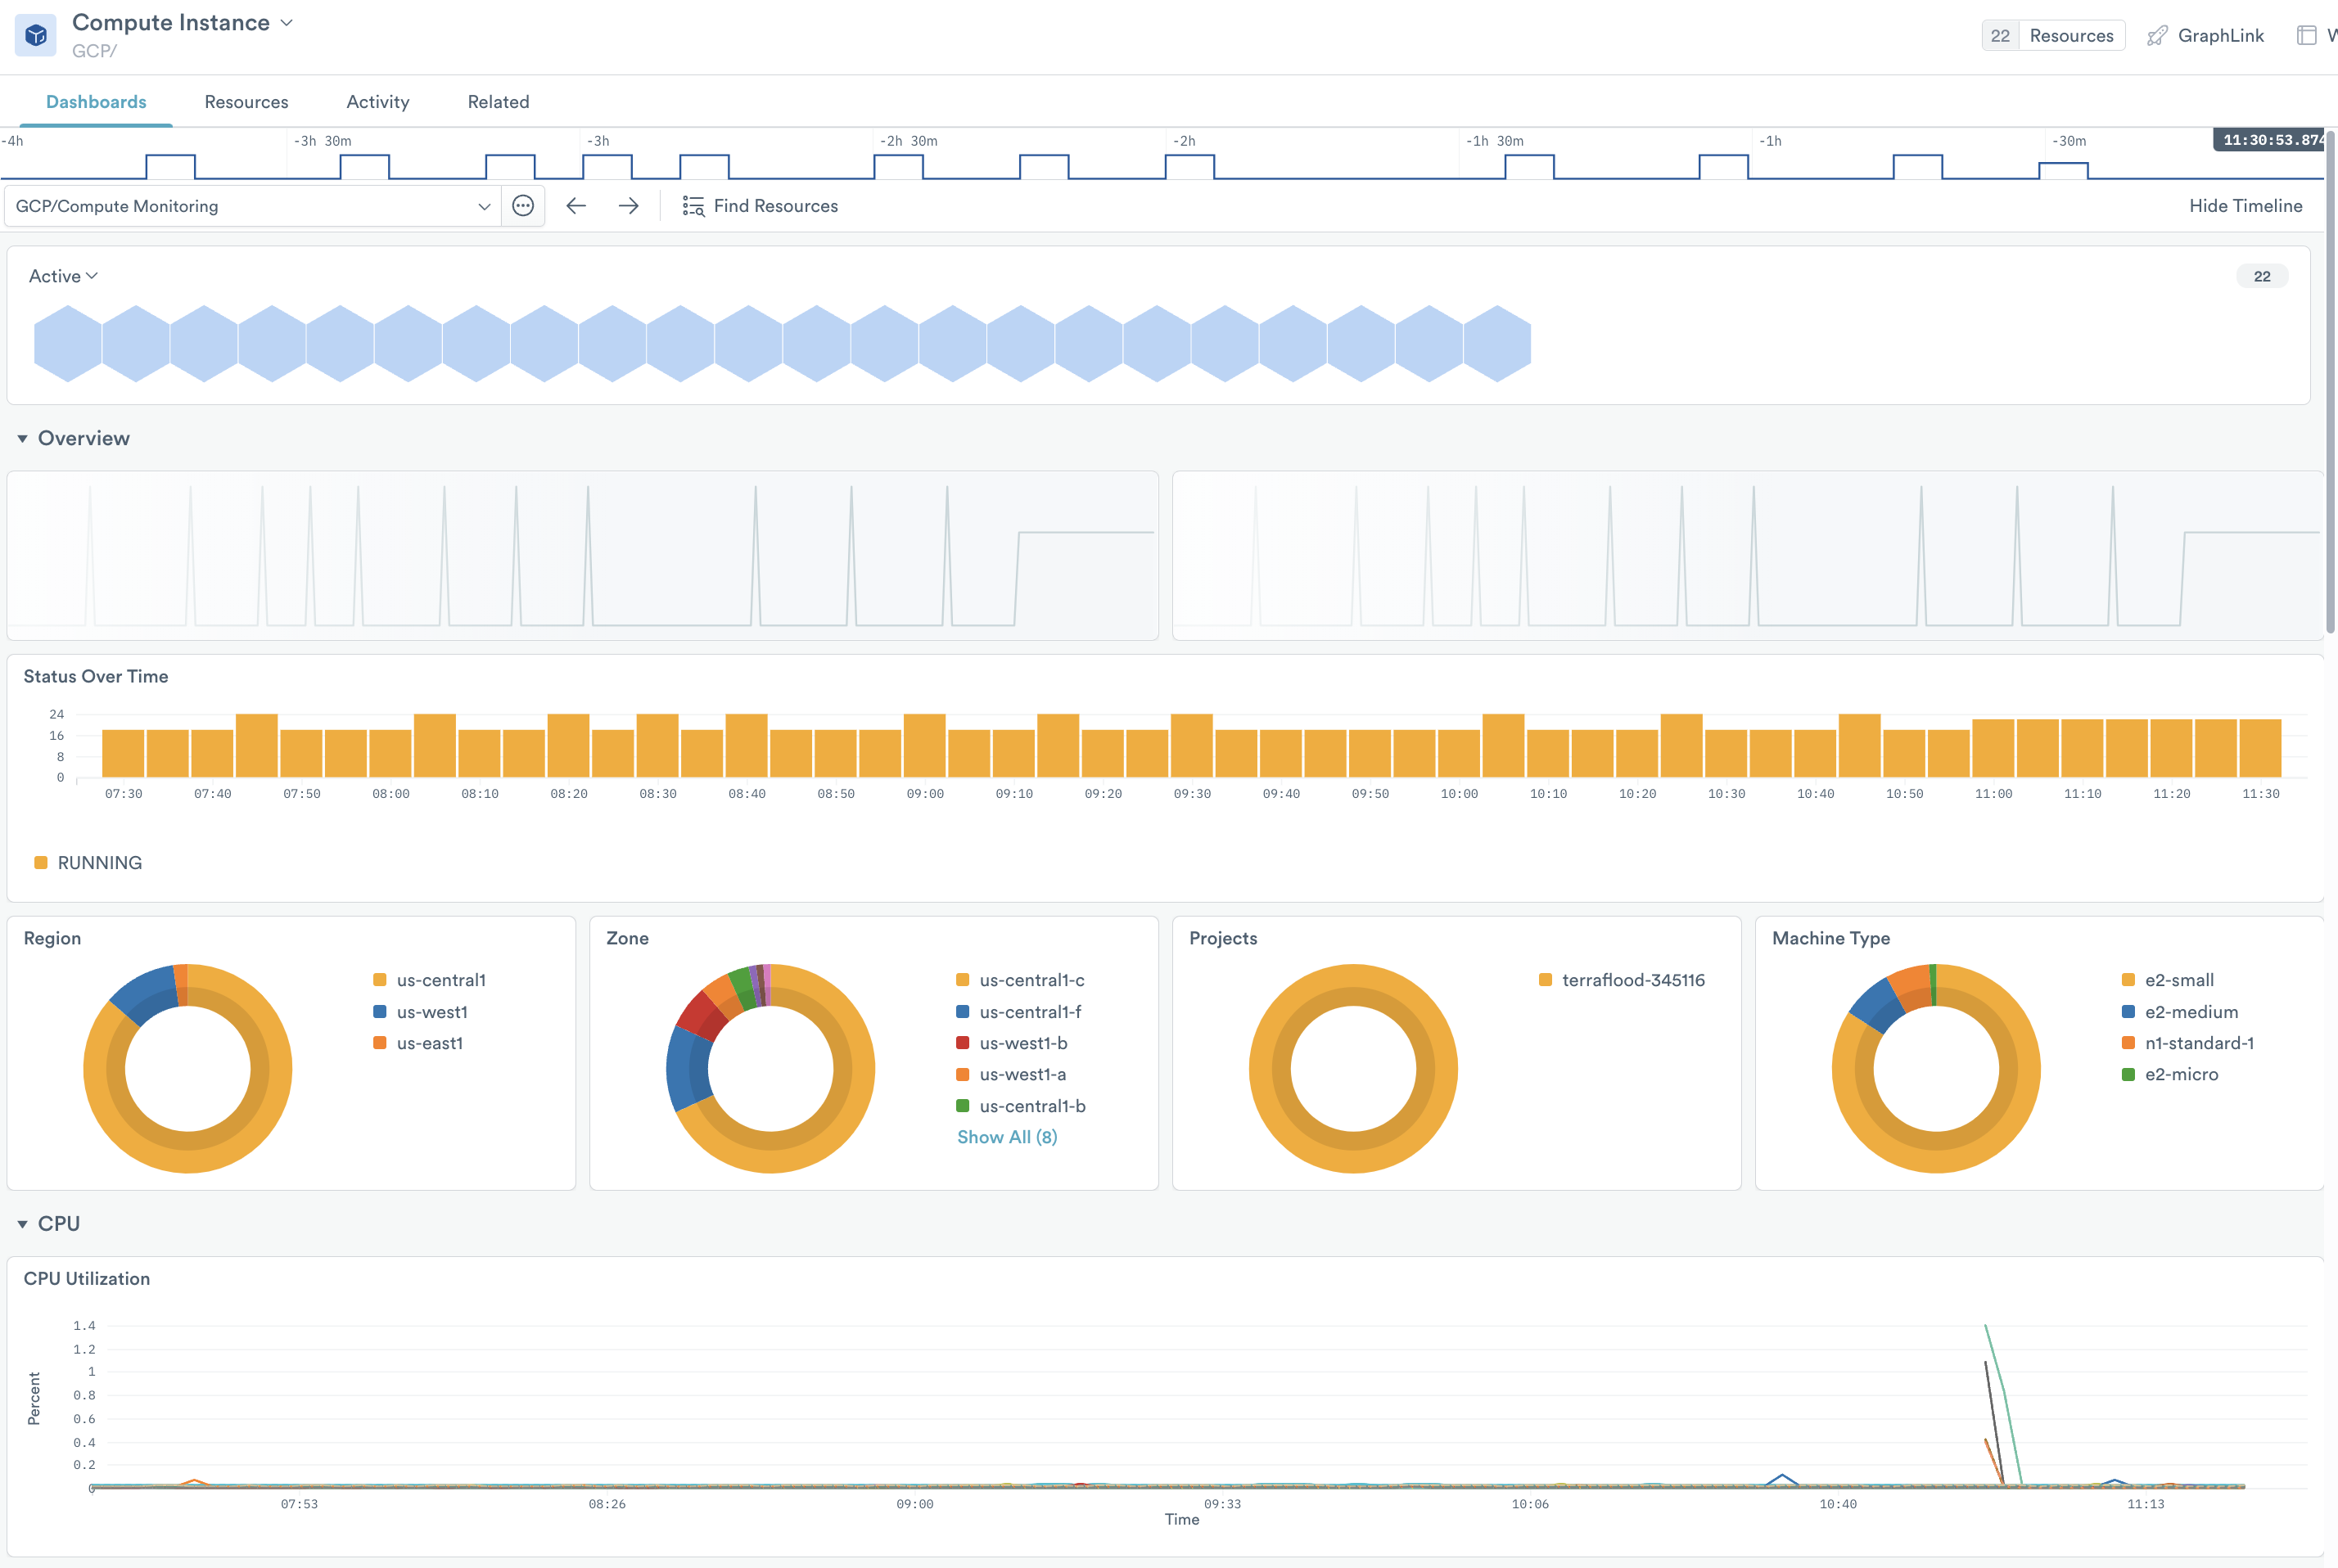
Figure 1 - The Monitoring dashboard for GCP Compute
To investigate specific instances, select one or more instance_key values in the right rail.
The Overview section contains performance and health monitoring information, including:
State - How many instances are running vs stopped?
Instance type - How many instances of each type?
Status check failed - How many instances have failed their status checks?
The sections below contains useful metrics, such as:
CPU utilization
Disk read and write throughput
Network throughput
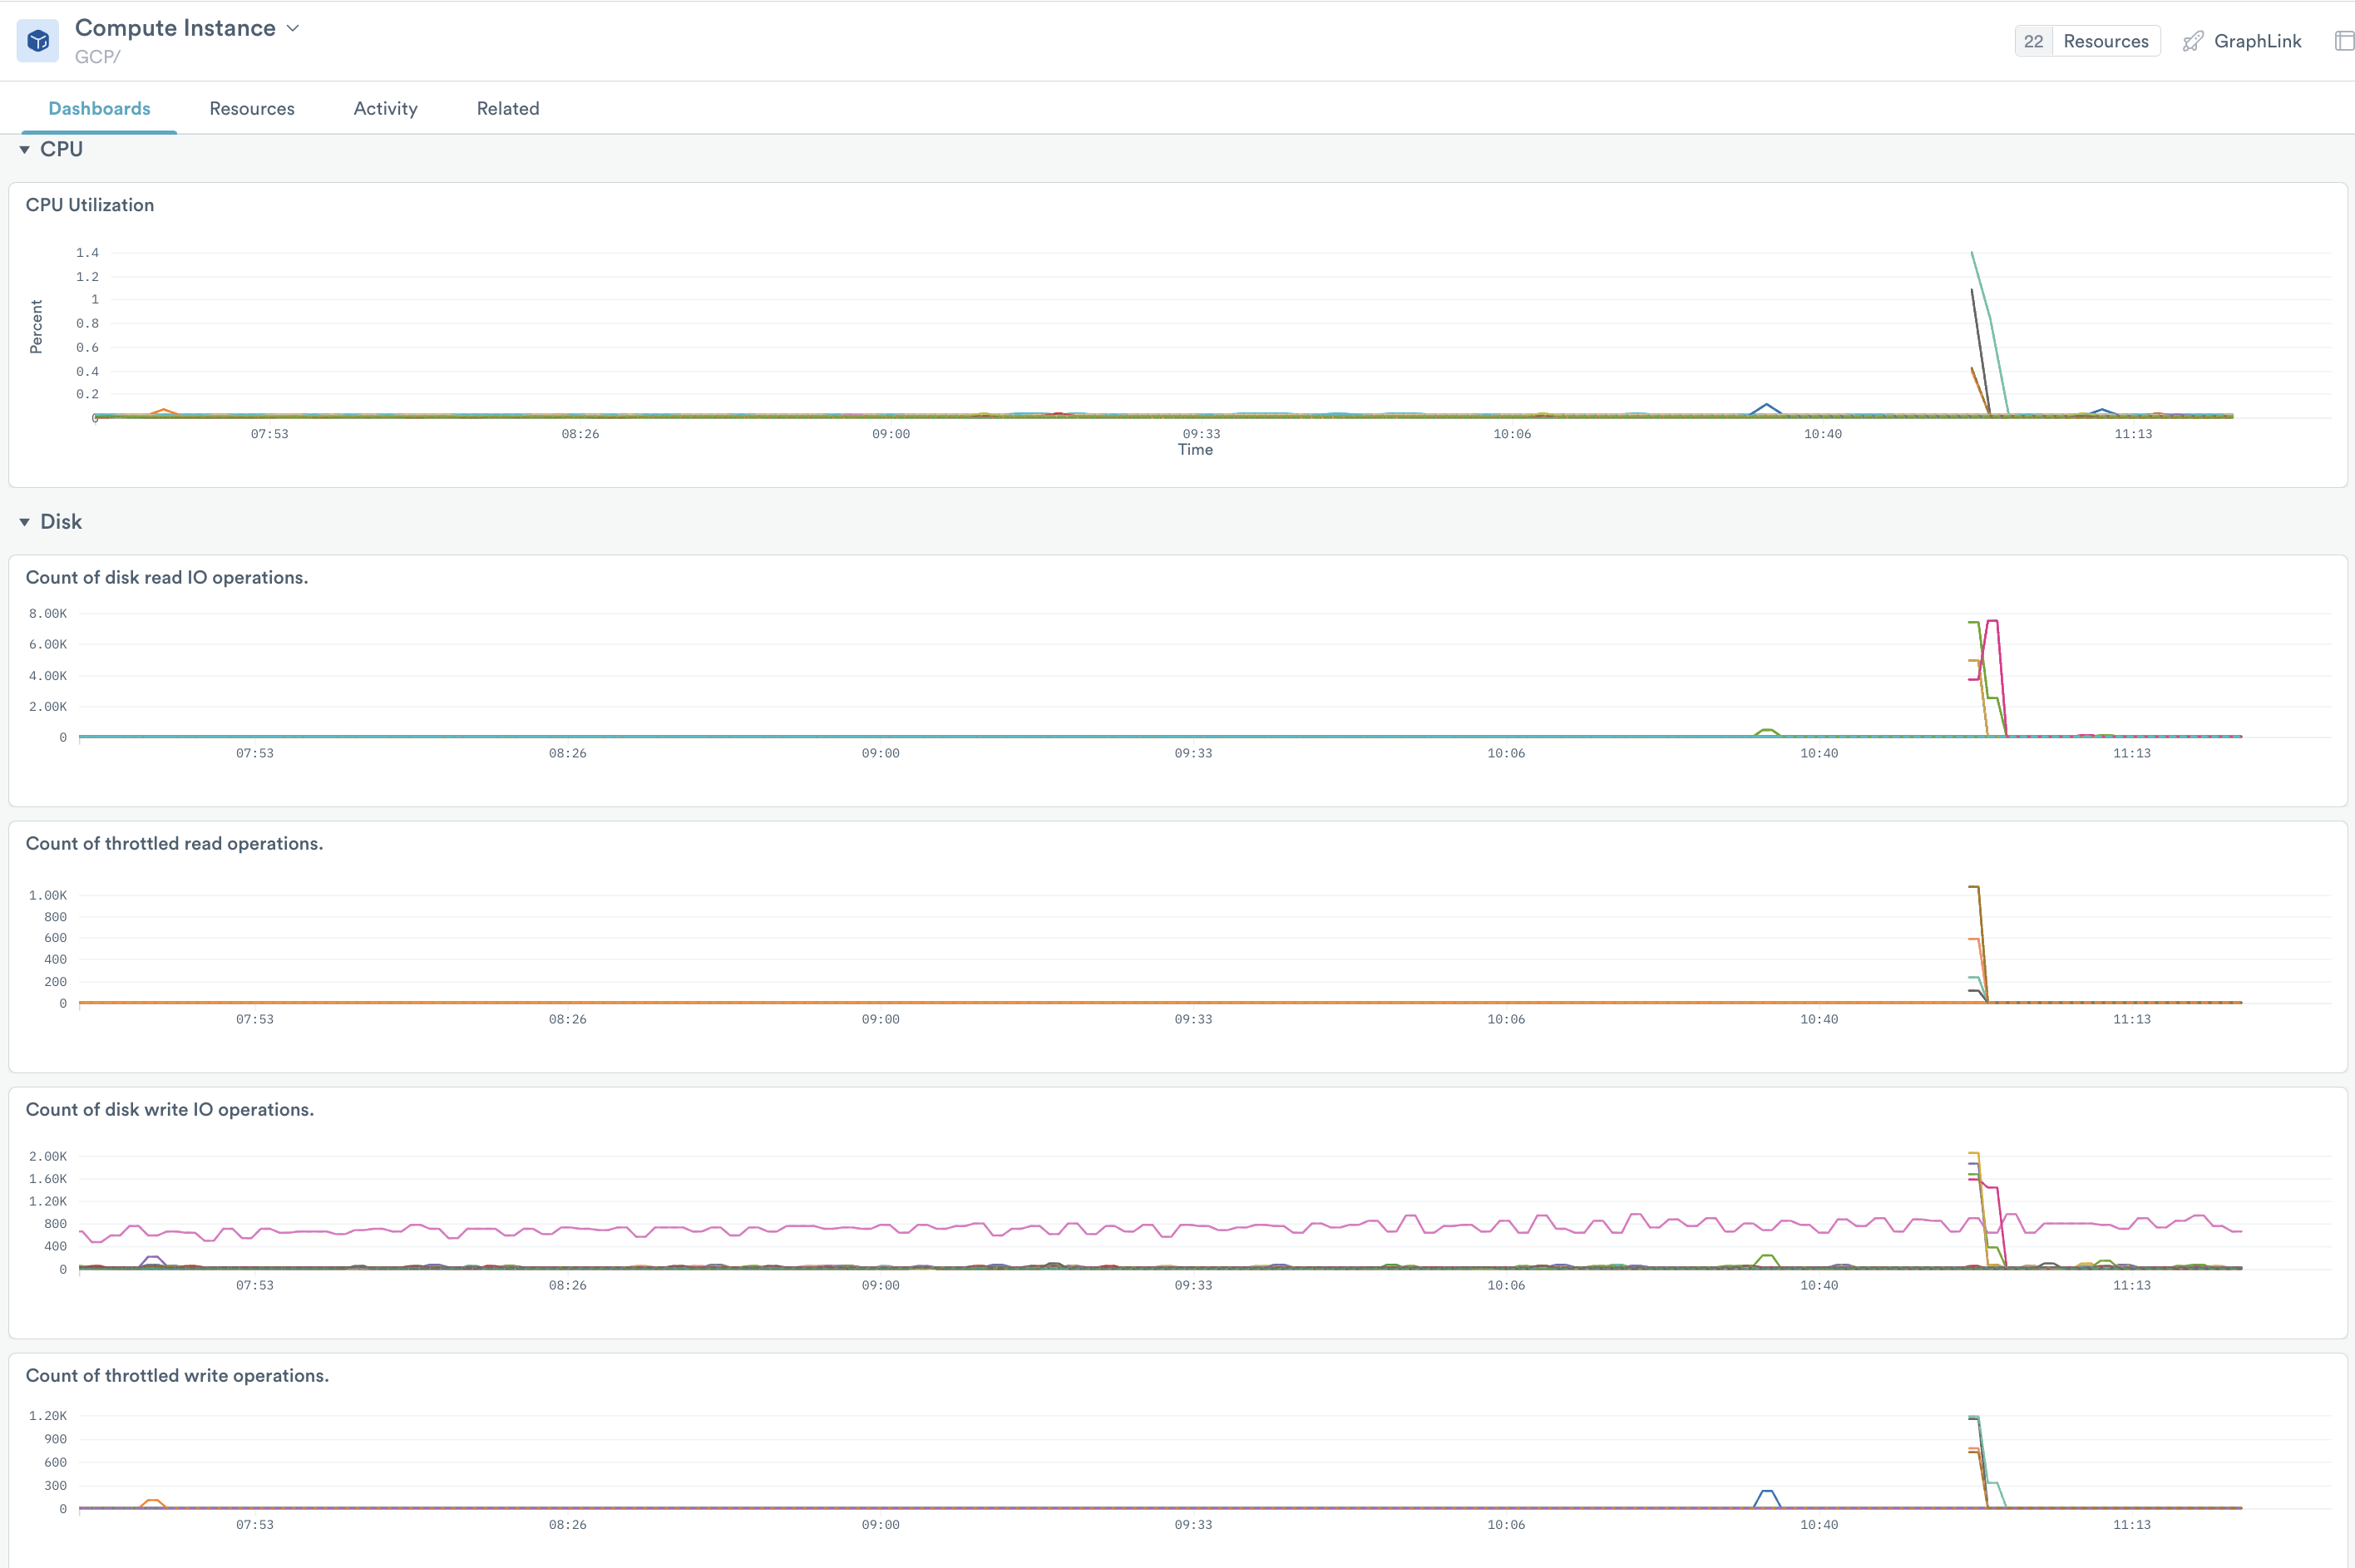
Figure 2 - Additional Monitoring board cards
Related resources using GraphLink
Use GraphLink to explore resources related to a GCP Compute instance.
What Disks are attached to these instances? Use GraphLink to connect to the GCP Disk dataset.
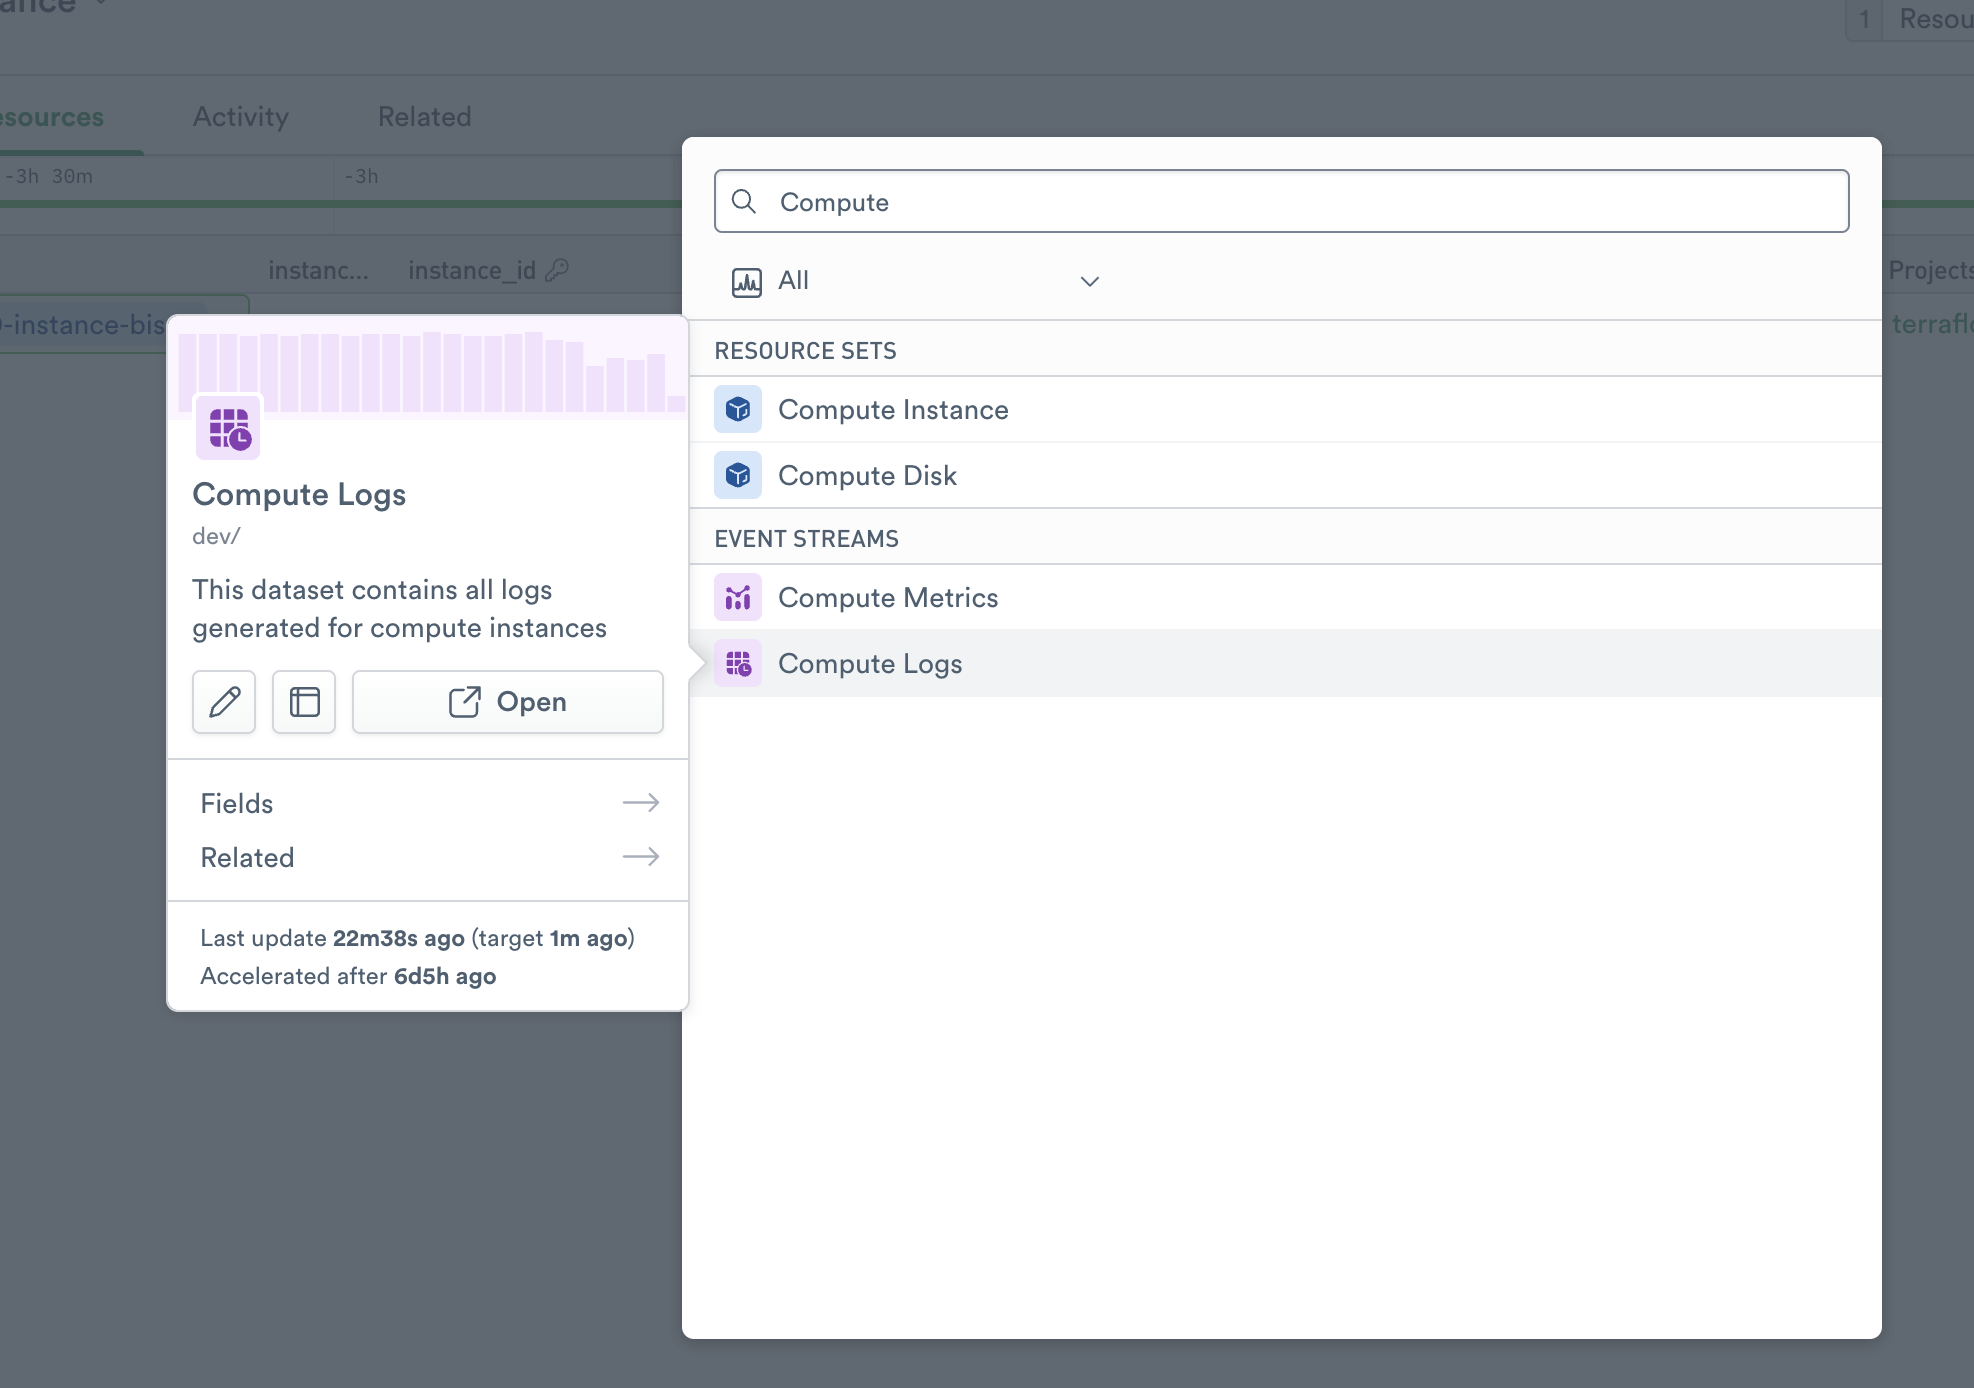
Figure 3 - GraphLink data set selection
GCP Compute Monitors
The GCP app includes a Monitor template for Compute instances:
Compute-CPU-Threshold
To use a template, go to the list of templates on the Monitors page and select Duplicate for the one you wish to use. Make any desired configuration changes on the Create a Monitor page and save to enable it.
Setup
Compute instance details are included with the Observe GCP app. If you installed the app with a custom configuration, you may need to add compute.googleapis.com/ to your poller configuration.