AWS Lambda
AWS Lambda is a serverless, event-driven compute service. AWS Lambda runs code in response to events and automatically manages the required computing resources.
Observe helps you monitor the health and activity of your Lambda functions with the following features:
Datasets containing details of Lambda functions, allowing you to see which functions in a specific AWS account, the state, and other attributes.
A board with at-a-glance insights, such as function invocation rate, execution duration, and errors.
Links to the CloudWatch Logs associated with each function.
Sample Monitor configurations to alert on common problems, such as high memory usage.
Note
To view CloudWatch Logs for your Lambda functions, configure CloudWatch Log Group ingest.
View Lambda activity in Observe
To see details of your Lambda functions, go to the Lambda Function dataset in Observe. Dashboards provides an overview of the health of your functions:
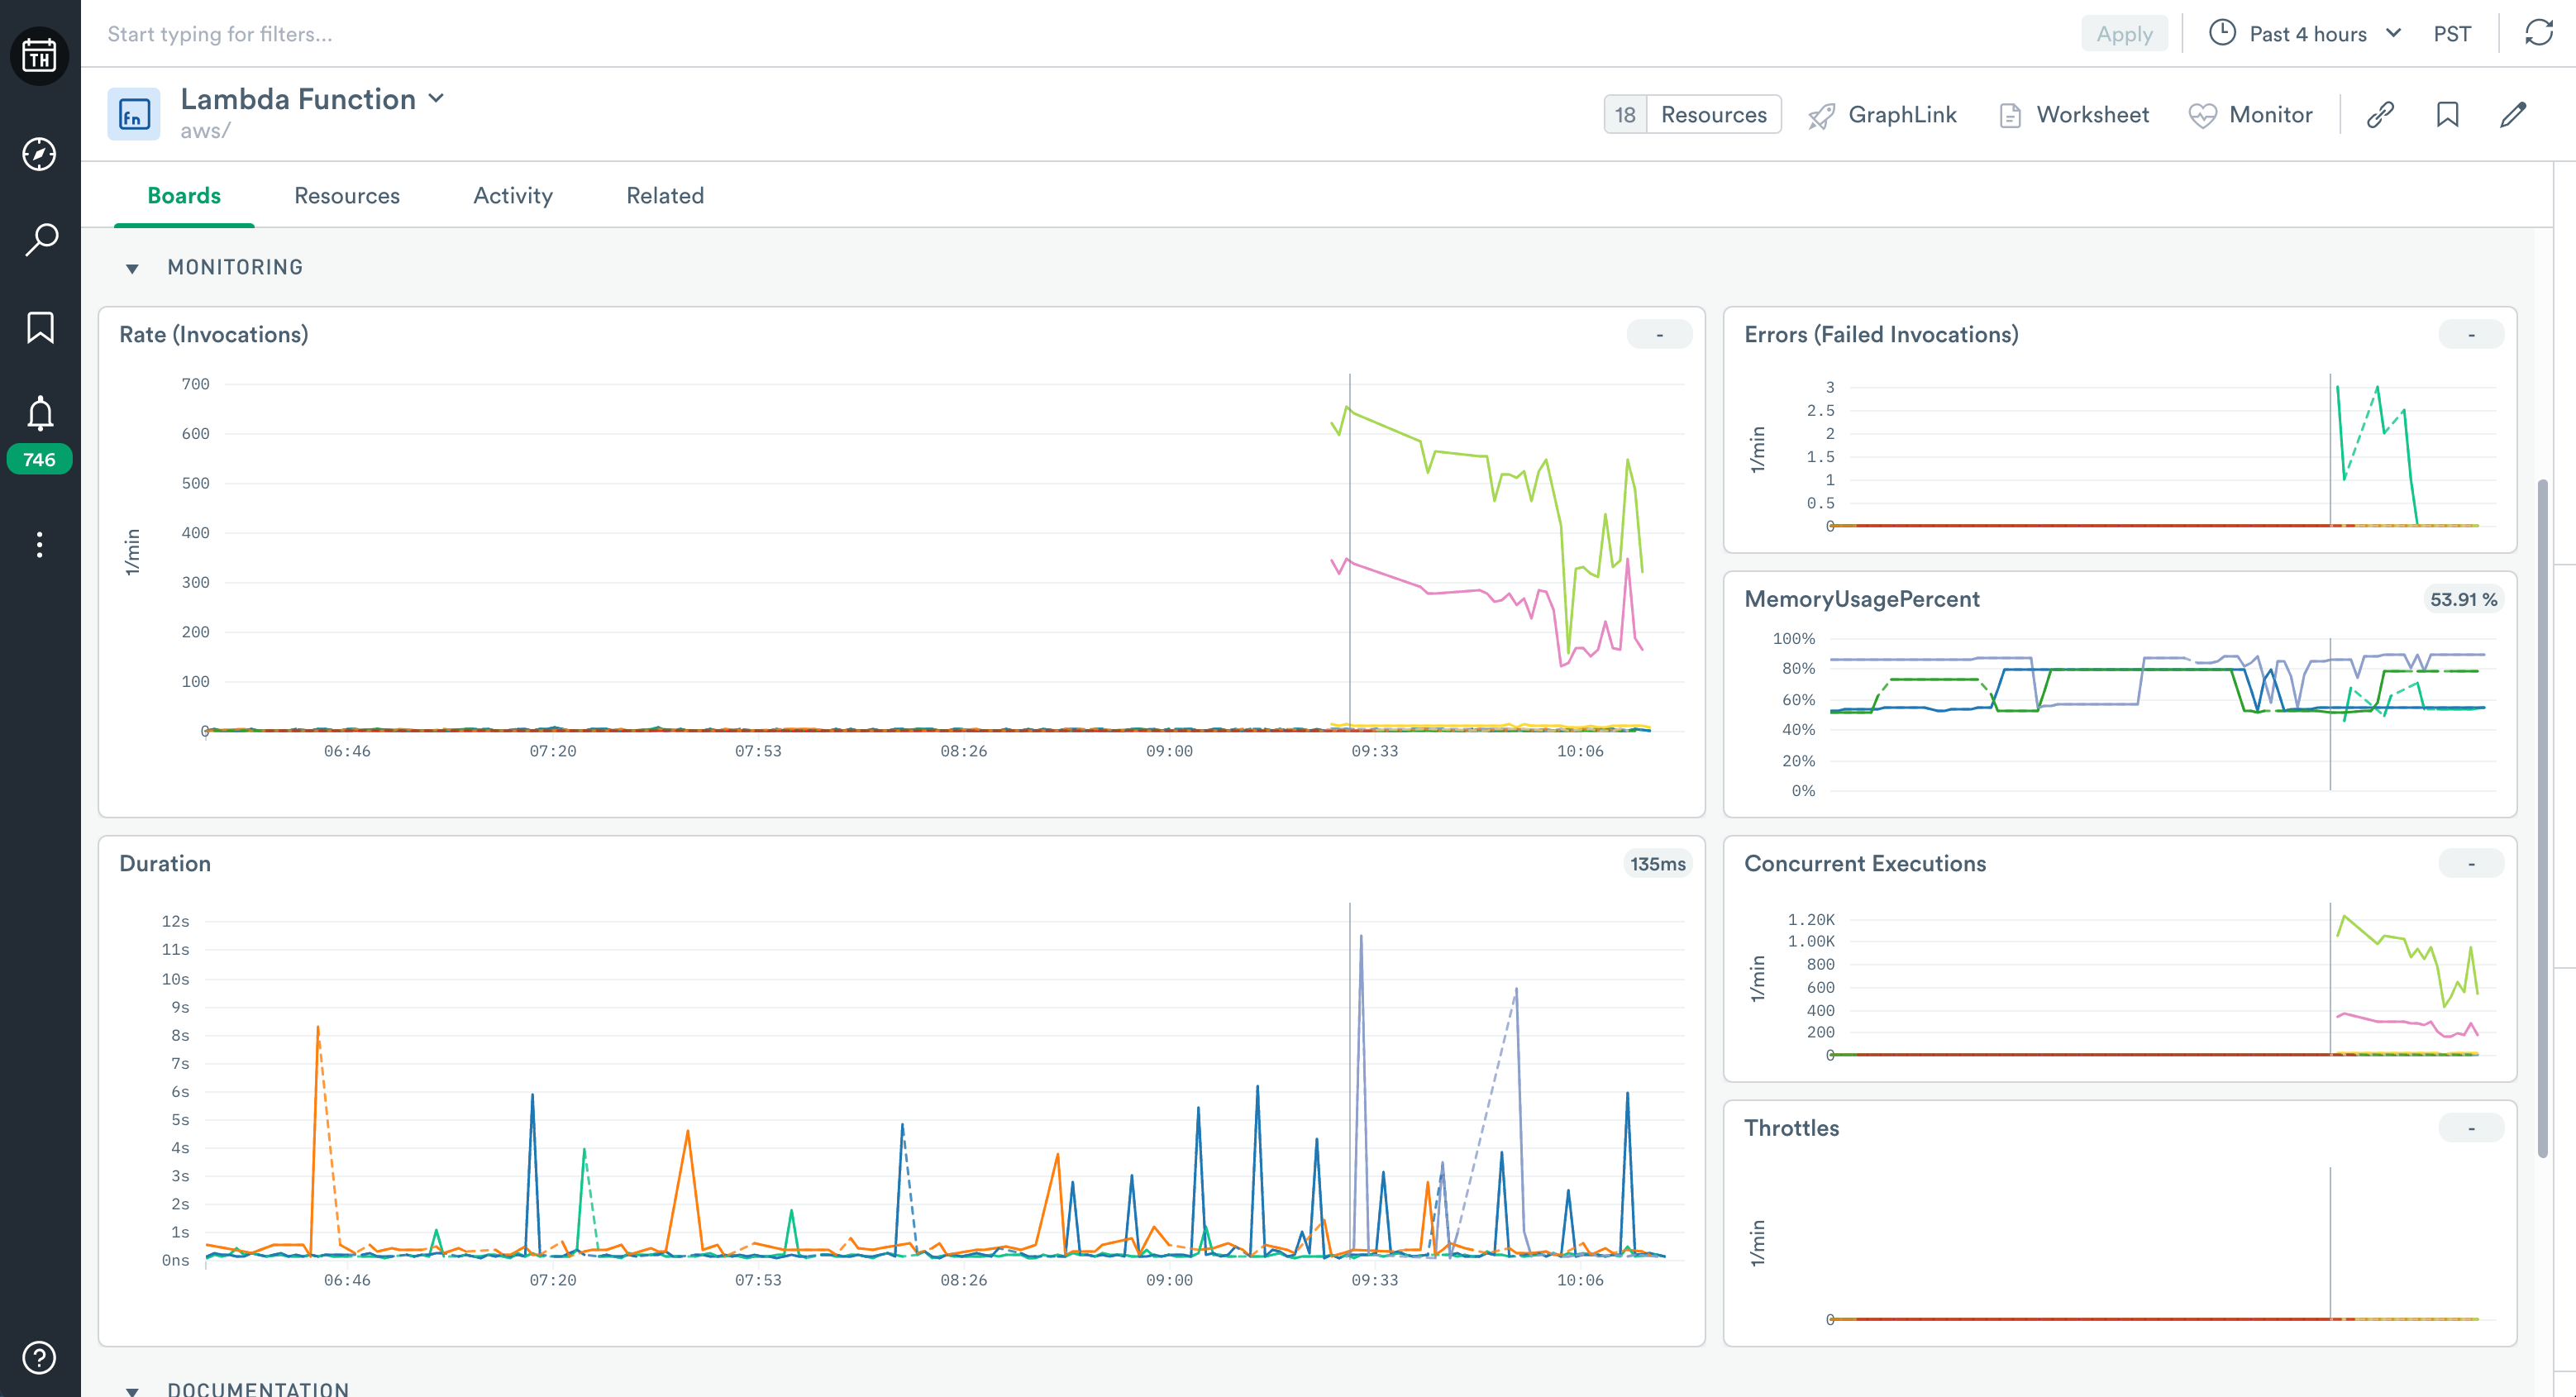
Figure 1 - Dashboard for Lambda Function
This Dashboard includes visualizations with information about your functions. Use it to answer questions such as:
How frequently does Lambda invoke a function and how long does it run?
How many failed invocations?
Which runtime does a function use?
The Dashboard has useful Lambda metrics, such as:
The number of concurrent function executions
Number of invocations throttled because you exceeded your concurrent executions quota
For a complete list of Lambda metrics collected, see AWS Lambda metrics.
Monitors
The AWS Integration app for Lambda includes the following Monitor templates:
Monitor Template |
Description |
|---|---|
Lambda Account-Wide Concurrency |
Alert if there are more than 800 concurrent invocations, across all your Lambda functions. |
Lambda Function Error Monitor |
Alert if the error rate for a function is more than 5 percent of its invocations. |
Lambda Function Memory Monitor |
Alert if a function uses more than 80 percent of its available memory. |
Lambda Function Timeout Monitor |
Alert if a function exceeds 80 percent of its maximum allowed execution time. |
To use a template, go to the list of templates on the Monitors page and select the one you wish to use. Make any desired configuration changes on the Create a Monitor page and save it.
Setup
Install the Observe AWS Integration app and select Lambda from the Configuration list. The installation creates corresponding datasets, and Monitors. To view CPU and Memory metrics, ensure you have enabled Container Insights for your cluster in the AWS Console.