Install the Kubernetes app
Note
Customers may continue using observe-stack; however, for new data collection, we recommend using the Observe Agent on Kubernetes.
Warning
Amazon EKS Auto Mode, Azure Kubernetes Service (AKS) Automatic, or GKE Autopilot is not supported yet.
You can install Kubernetes using the Kubernetes app located on the Apps page. The app allows you to easily create a data stream token for Kubernetes and provides a seamless experience for the installation.
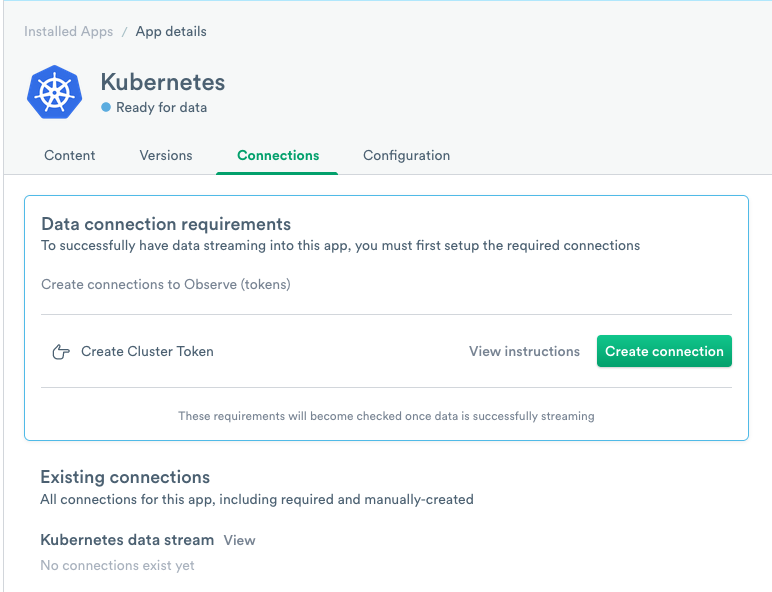
Figure 1 - The Observe Kubernetes app
Click Create connection to create a token for the data stream and configure the app.
If you prefer to install Kubernetes manually, use the following installation instructions.
Connecting Kubernetes with Kustomize manifests
Important
Since Observe kustomize manifests v1.0.0, Observe has reduced the amount of metrics its stack collects by default. To collect Pod metrics and more cAdvisor metrics, see Collecting Pod Metrics and cAdvisor Metrics.
Proceeding with this step requires an Observe Customer ID and token.
Some Observe instances may optionally use a name instead of Customer ID; if this is the case for your instance, contact your Observe Data Engineer to discuss implementation. A stem name will work as is, but a DNS redirect name may require client configuration.
Observe provides a manifest that installs all the necessary components for collecting telemetry data from Kubernetes. This manifest can be retrieved directly from https://github.com/observeinc/manifests.
The installation process consists of two steps:
kubectl apply -k https://github.com/observeinc/manifests/stack && \
  kubectl -n observe create secret generic credentials \
  --from-literal=OBSERVE_CUSTOMER=${OBSERVE_CUSTOMER?} \
  --from-literal=OBSERVE_TOKEN=${OBSERVE_TOKEN?}
Observe provides this example for illustrative purposes only. In production environments, Observe recommends downloading the manifest separately and tracking changes over time using your configuration management tool of choice. You can use kubectl kustomize <URL> to generate a static version of the Observe manifest.
By omission, the Observe manifest creates an observe namespace that contains all of the collection infrastructures. Only then can Observe create a secret containing the appropriate credentials for sending data to Observe.
Once you apply your manifest, wait for all pods within the namespace to be ready:
kubectl wait --timeout=60s pods -n observe --for=condition=Ready --all
Connecting Kubernetes with Helm
Important
Since Observe Helm charts v0.4.21, Observe has reduced the amount of metrics its stack collects by default. To collect Pod metrics and more cAdvisor metrics, see Collecting Pod Metrics and cAdvisor Metrics.
To proceed with this step, you need the collection endpoint associated with your Observe customer ID, and a connection token.
Helm can be used to install the Observe Kubernetes collection agents to an existing namespace. If it does not already exist, you need to create an observe namespace with a human readable cluster name annotation. This can be done with your infrastructure management tool of choice, for example, Terraform, or with the following command:
CLUSTER_NAME="My Cluster"
kubectl create namespace observe && \
  kubectl annotate namespace observe observeinc.com/cluster-name="$CLUSTER_NAME"
See namespace on Observe GitHub for more information on the namespace requirement.
To add the Observe Helm repository, run the following commands:
helm repo add observe https://observeinc.github.io/helm-charts
helm repo update
Then create a release for the stack chart in the observe namespace, using helm install:
helm install --namespace=observe observe-stack observe/stack \
	--set global.observe.collectionEndpoint="${OBSERVE_COLLECTION_ENDPOINT?}" \
	--set observe.token.value="${OBSERVE_TOKEN?}"
Save the values to a file, and keep it somewhere safe for further configuration and upgrades:
helm -n observe get values observe-stack -o yaml > observe-stack-values.yaml
Configuration
See configuration details on Observe GitHub for more details on Helm chart configuration, including setting custom resource limits for the agents.
To add Kubernetes events, see Github.
Cluster Name Annotations
If you monitor multiple clusters, provide a friendly name for each one. You may attach an identifier by providing an observeinc.com/cluster-name annotation:
kubectl annotate namespace observe observeinc.com/cluster-name="My Cluster"
Note
If you want to link to the AWS app set observeinc.com/cluster-name equal to your clusters arn - kubectl annotate namespace observe observeinc.com/cluster-name="arn:aws:eks:us-west-2:[ACCOUNT]:cluster/[CLUSTER_NAME]"
If you want to link to the GCP app, set observeinc.com/cluster-name equal to your clusters asset inventory name.
For GKE Zonal Location types use:
kubectl annotate namespace observe observeinc.com/cluster-name=" //container.googleapis.com/projects/[PROJECT_ID]/zones/[ZONE]/clusters/[CLUSTER_NAME]"
For GKE Regional Location types use:
kubectl annotate namespace observe observeinc.com/cluster-name=" //container.googleapis.com/projects/[PROJECT_ID]/locations/[REGION]/clusters/[CLUSTER_NAME]"
Integrating with Observe AWS and GCP apps
If you also use Kubernetes with Amazon Elastic Kubernetes Service (EKS) or Google Kubernetes Engine (GKE) for GCP, send data from these services to the Observe Kubernetes app by configuring them in the Configuration tab.
In the Kubernetes app, click the Configuration tab to open the app settings.
Under AWS App, select AWS in the dropdown.
Under GCP App, select GCP.
Click Update to save your changes.
Updating and Uninstalling
To completely remove the Observe integration, delete all of the resources included in the original installation:
Kustomize
kubectl delete -k https://github.com/observeinc/manifests/stack
Helm
helm -n observe uninstall observe-stack
Versioning
Kustomize
Observe uses versioned manifests. To install or uninstall a specific version, add the version parameter to the URL:
kubectl apply -k 'https://github.com/observeinc/manifests/stack?ref=v0.5.0'
kubectl delete -k 'https://github.com/observeinc/manifests/stack?ref=v0.5.0'
You can find the list of published versions on the releases page.
Helm
You can specify a chart version with helm install or helm upgrade.
helm install --namespace=observe observe-stack observe/stack \
  --set global.observe.collectionEndpoint="${OBSERVE_COLLECTION_ENDPOINT?}" \
  --set observe.token.value="${OBSERVE_TOKEN?}"
You can find the list of published versions on the releases page. Optionally specify a stack version in your helm install command with the --version flag in the command above.
Metrics Discovery
If you want to expose Prometheus metrics from your pod, you have two options:
Set the port in the annotations. This method has the disadvantage that it can only surface one HTTP endpoint for collection.
 annotations:
   prometheus.io/port: "9999"
Expose the metrics endpoint through a port with a name ending with
metrics. For example, use the following:ports: - containerPort: 9999 name: metrics - containerPort: 12345 name: sidecar-metrics
You can use the following annotations to further influence the discovery process:
prometheus.io/scheme: set tohttporhttpsprometheus.io/path: defaults to/metrics
To disable collecting metrics on a pod, use one of the following annotations:
prometheus.io/scrape: if set tofalse, the pod is ignored.observeinc.com/scrape=false: used only by the Observe collection process.
To learn more about Kubernetes metrics collection in Observe, including filtering options, see our developer documentation.
AWS Fargate Support
Amazon Elastic Kubernetes Service (EKS) is a managed Kubernetes service that can be configured to run on AWS Fargate. AWS does not support Daemonsets when running on a serverless compute engine such as AWS Fargate. Since the Observe standard log collection method relies on daemonsets, you must add the necessary configuration to collect logs for pods scheduled on AWS Fargate.
AWS provides a method of streaming logs from pods running on Fargate. This requires setting up a Kinesis Firehose that sends data to Observe. Observe provides a Terraform module that automates this setup here. If you do not use Terraform and want to set up EKS log forwarding for AWS Fargate, please contact your Observe Data Engineer.
Migrating from Legacy Manifests
Observe hosts legacy manifests at https://api.observeinc.com/v1/kubernetes/manifest. As of March 2022, these manifests receive only critical security fixes. To migrate to the latest manifest:
Delete all existing Observe resources:
kubectl delete -f https://api.observeinc.com/v1/kubernetes/manifest
Install the latest manifest:
kubectl apply -k https://github.com/observeinc/manifests/stack && \
  kubectl -n observe create secret generic credentials \
  --from-literal=OBSERVE_CUSTOMER=${OBSERVE_CUSTOMER?} \
  --from-literal=OBSERVE_TOKEN=${OBSERVE_TOKEN?}
You need to add a few structural changes between the legacy and current manifests:
Observe removed the proxy deployment. If you used proxying custom telemetry in your cluster, please reach out to support.
Observe now collects metrics through Grafana Agent rather than Telegraf. The
kubernetes/Metricsdataset, which contains Telegraf data, was deprecated in favor ofkubernetes/Pod Metricsandkubernetes/Cadvisor Metrics. If you have custom datasets or monitors built from the former, please reach out to support for assistance.
FAQ
What Kubernetes Versions does Observe support?
Kubernetes targets a minor release every 3 months and maintains a concept of a “support window” that spans one year from the original release date. This typically results in support for four minor versions at any given time.
The Observe support policy provides the following:
The Observe default manifest targets support Kubernetes releases.
Older releases work, but may require configuration overrides
The oldest release Observe officially targets is the oldest version supported by EKS.
To find the latest supported version, go to GitHub.
What Container Runtimes does Observe Support?
The container runtime only affects log collection. Observe validated the current FluentBit configuration on both Docker and containerd. Other runtimes or older versions may require minor configuration adjustments - please reach out to your Observe Data Engineer for assistance.
Can I restrict a collection to a specific namespace?
Observe does not currently support this. Collecting Kubernetes state, in particular, requires accessing resources that are not namespaced, such as node and persistent volume. Log collection may be restricted to specific namespaces, however - see the next question for details.
How do I stop collecting metrics?
When you create the Kubernetes data collection with Helm for the first time, add --set metrics.enabled="false"
helm install --namespace=observe observe-stack observe/stack \
	--set global.observe.collectionEndpoint="https://${OBSERVE_CUSTOMER}.collect.observeinc.com/" \
	--set observe.token.value="${OBSERVE_TOKEN}" \
  --set metrics.enabled="false"
If you already installed the Kubernetes data collection with the Observe’s Helm charts, upgrade the existing Helm with the following instructions:
Create the
observe-stack-values.yamlfile.
global:
  observe:
    collectionEndpoint: https://${OBSERVE_CUSTOMER}.collect.observeinc.com/
metrics:
  enabled: false
observe:
  token:
    value: ${OBSERVE_TOKEN}
If you do not want to collect pod metrics, your observe-stack-values.yaml would look like the following.
global:
  observe:
    collectionEndpoint: https://${OBSERVE_CUSTOMER}.collect.observeinc.com/
metrics:
  grafana-agent:
    prom_config:
      scrape_configs:
        cadvisor_action: keep
        kubelet_action: keep
        pod_action: drop
        resource_action: keep
observe:
  token:
    value: ${OBSERVE_TOKEN}
If you want to selectively collect metrics, please review Helm chart for metrics for more information.
Upgrade the existing Helm.
helm upgrade --reset-values -f observe-stack-values.yaml --namespace=observe observe-stack observe/stack
Create the
example.envfile.
PROM_SCRAPE_CADVISOR_ACTION=drop
PROM_SCRAPE_POD_ACTION=drop
PROM_SCRAPE_RESOURCE_ACTION=drop
PROM_SCRAPE_KUBELET_ACTION=drop
If you want not to collect pod metrics, your example.env would look like the following.
PROM_SCRAPE_CADVISOR_ACTION=keep
PROM_SCRAPE_POD_ACTION=drop
PROM_SCRAPE_RESOURCE_ACTION=keep
PROM_SCRAPE_KUBELET_ACTION=keep
If you want to selectively collect metrics, please review metrics for more information.
Update the
observe-metricsdeployment.
kubectl create configmap -n observe env-overrides --from-env-file example.env
kubectl rollout restart -n observe deployment observe-metrics
How do I update my credentials?
You should first regenerate the credentials secret. The simplest way of achieving this is to delete the existing secret and create a new one:
kubectl delete -n observe secret credentials --ignore-not-found && \
	kubectl -n observe create secret generic credentials \
	--from-literal=OBSERVE_CUSTOMER=${OBSERVE_CUSTOMER?} \
	--from-literal=OBSERVE_TOKEN=${OBSERVE_TOKEN?}
Now that you have new credentials, you need to restart pods in the observe namespace to pick up the new values:
kubectl rollout restart -n observe daemonset && \
	kubectl rollout restart -n observe deployment
Can I filter the logs sent to Observe?
Observe currently supports filtering on log files pulled using Fluent Bit with the inclusion of a fluent-bit-extra.conf file alongside the fluent-bit.conf file deployed via our manifest. An example manifest to filter out logs from the “namespacePattern” namespace:
apiVersion: v1
data:
  fluent-bit-extra.conf: |-
    [FILTER]
        Name         grep
        Match        k8slogs
        Exclude      namespace /.*namespacePattern.*/
Depending on the shape of your data, you may be able to filter on additional keys for greater specificity. See the Fluent Bit grep filter documentation for more information.
How can I disable scheduling a daemonset pod on a specific node?
In order to provide full coverage of your cluster, the observe-logs daemonset is by design scheduled onto all nodes. If you want to remove it from a subset of nodes, you can add a taint:
kubectl taint nodes ${NODENAME?} observeinc.com/unschedulable
This taint is only verified during scheduling. If you already have an observe-logs pod running on the node, you must delete it manually:
kubectl delete pods -n observe -l name=observe-logs --field-selector=spec.nodeName=${NODENAME?}
What does a mem buf overlimit warning mean?
When reviewing fluent-bit logs, you may encounter a warning similar to the following example:
[2022/03/14 16:00:18] [ warn] [input] tail.0 paused (mem buf overlimit)
This indicates that fluent-bit temporarily stopped reading logs from the files on the disk, and waiting for existing buffered data to be successfully uploaded. Typically you don’t need to take any action, and fluent-bit does not send a message once fluent-bit restarts tailing of logs.
If you see this message very frequently, you may have a very bursty log source or limited upload bandwidth. In either case, please reach out to your Observe Data Engineer for assistance.