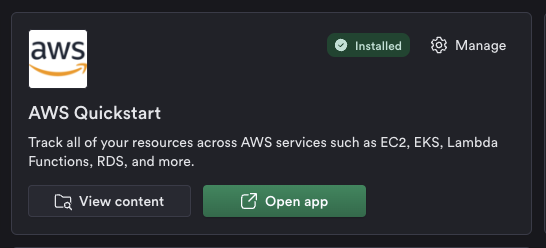
AWS Quickstart
Install the AWS Quickstart app to monitor and troubleshoot your AWS infrastructure. Observe’s AWS integration collects:
Information about resources, such as EC2 instances, RDS databases, and more, allowing you to track resource lifecycle changes over time.
CloudWatch Metrics, to monitor and alert on KPIs for your infrastructure
CloudWatch Logs, to troubleshoot logs emitted by applications running within AWS services Furthermore, applicable metrics and logs are automatically linked to their associated resources to enable deeper troubleshooting.
Setting up the Observe AWS integration
Once you have installed the AWS Quickstart app, it should appear in your Applications page within Observe.
In order to set up the integration, please follow these steps
Viewing data about your AWS systems
Resources
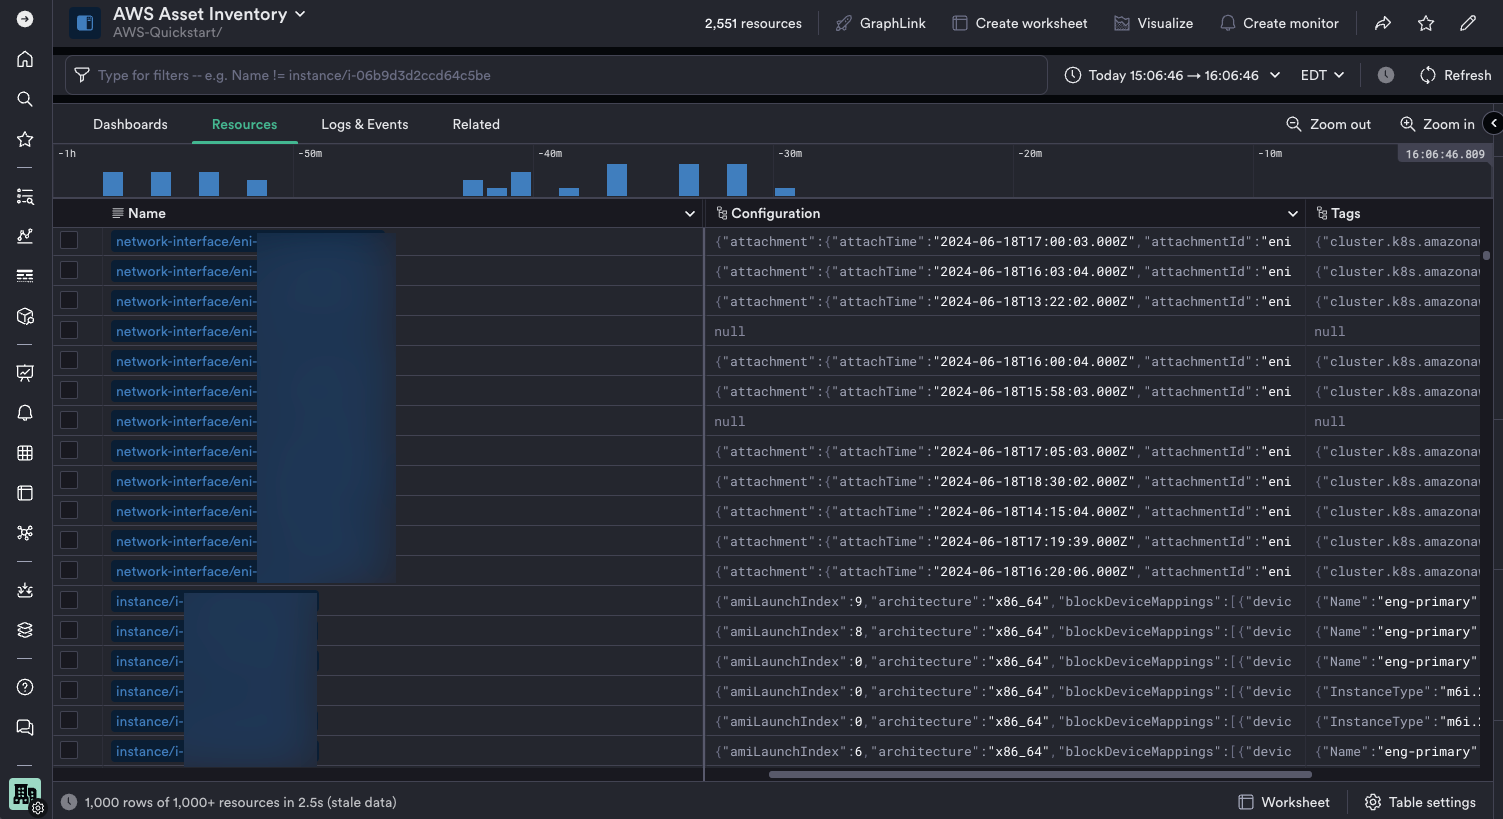
The AWS integration is designed to auto discover resources in your AWS environment using AWS Config snapshots. Assets are automatically captured from every monitored account, including configurations associated with each asset depending on its type, along with its tags.
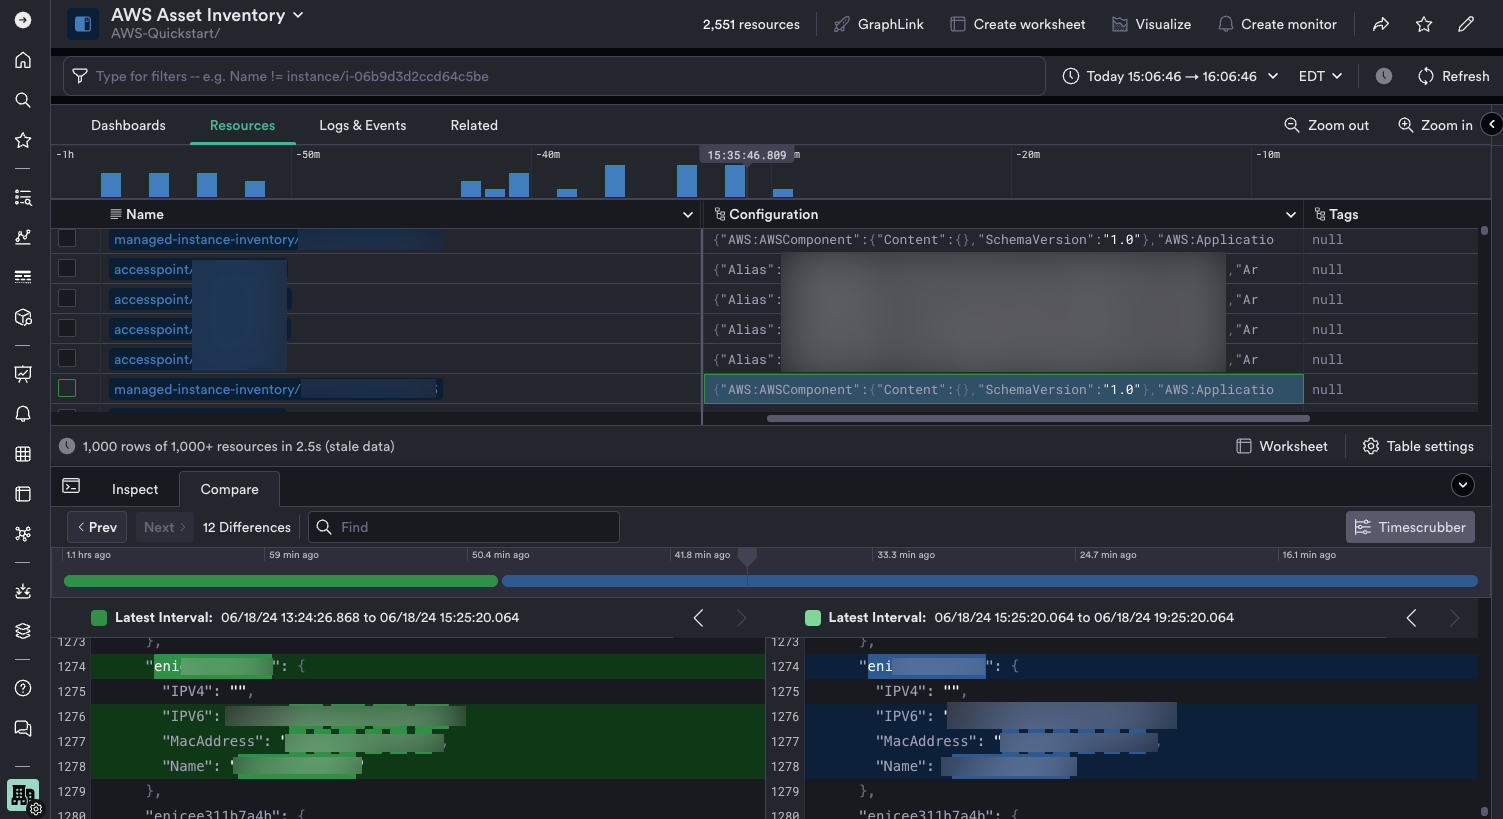
Perform detailed inspection of each resource, including inspecting property changes over time.
Metrics
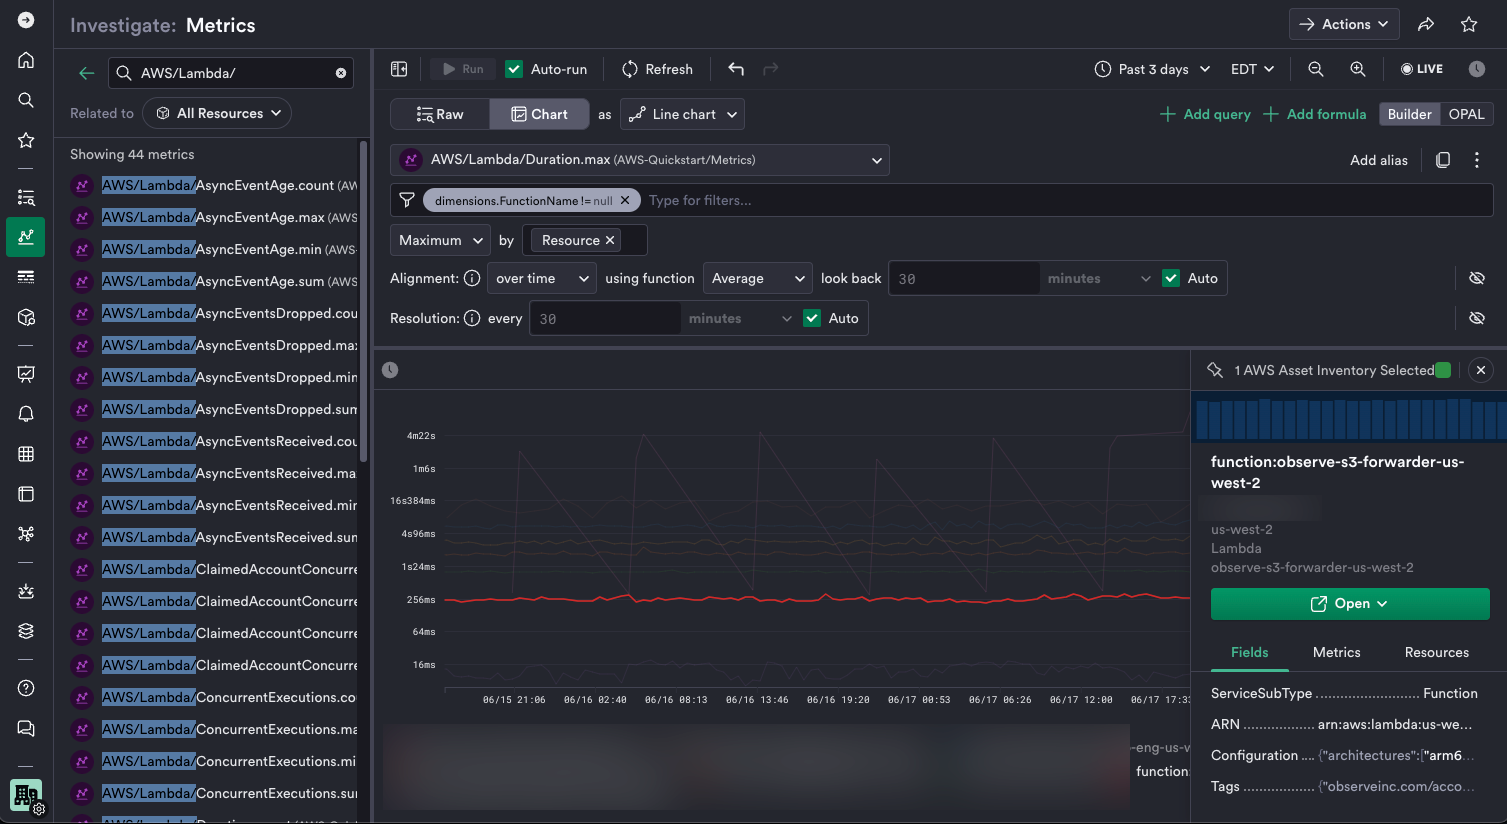
Use the Metric Explorer to filter, transform, and visualize CloudWatch metrics collected from your AWS environments.
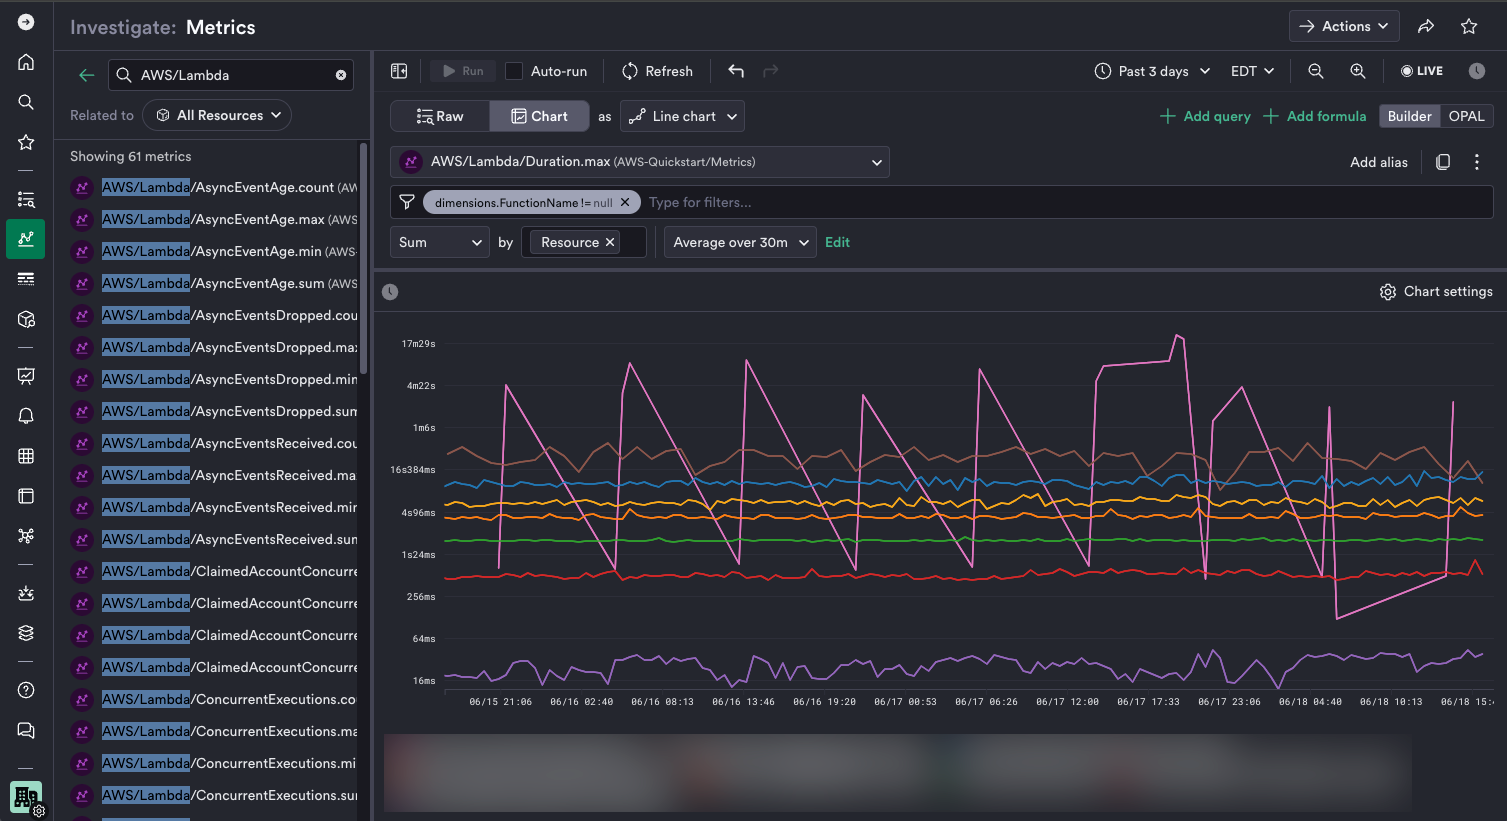
Select a metric time series and click on inspect to drill down into its associated resource.
Logs
Use the Log Explorer to filter, transform, and visualize CloudWatch logs collected from your AWS environments.
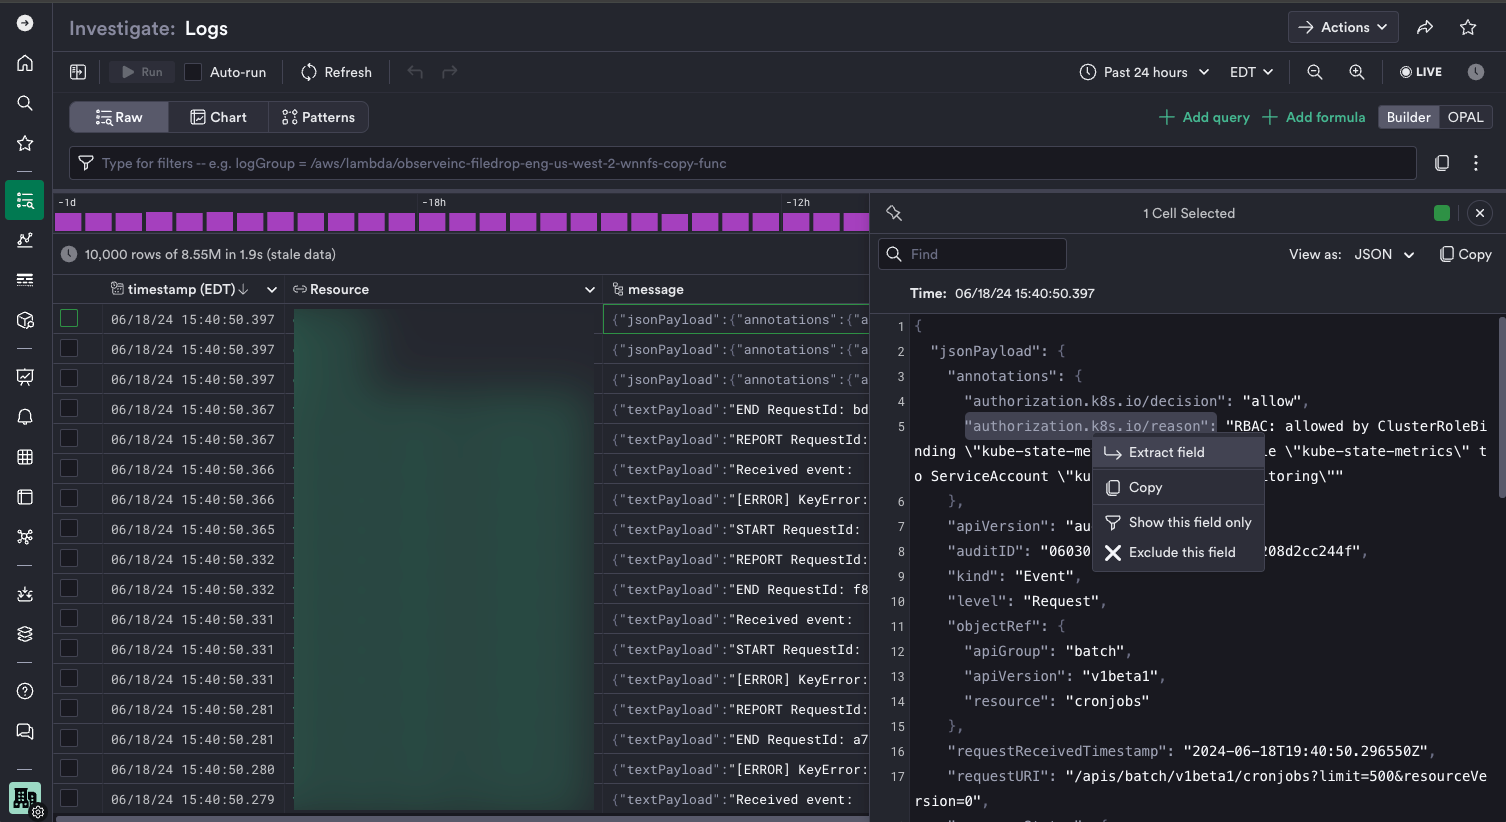
Depending on the log format, JSON formatted messages are automatically parsed for easy extraction and filtering and accessible through the jsonPayload field, while other log events are available as textPayload.
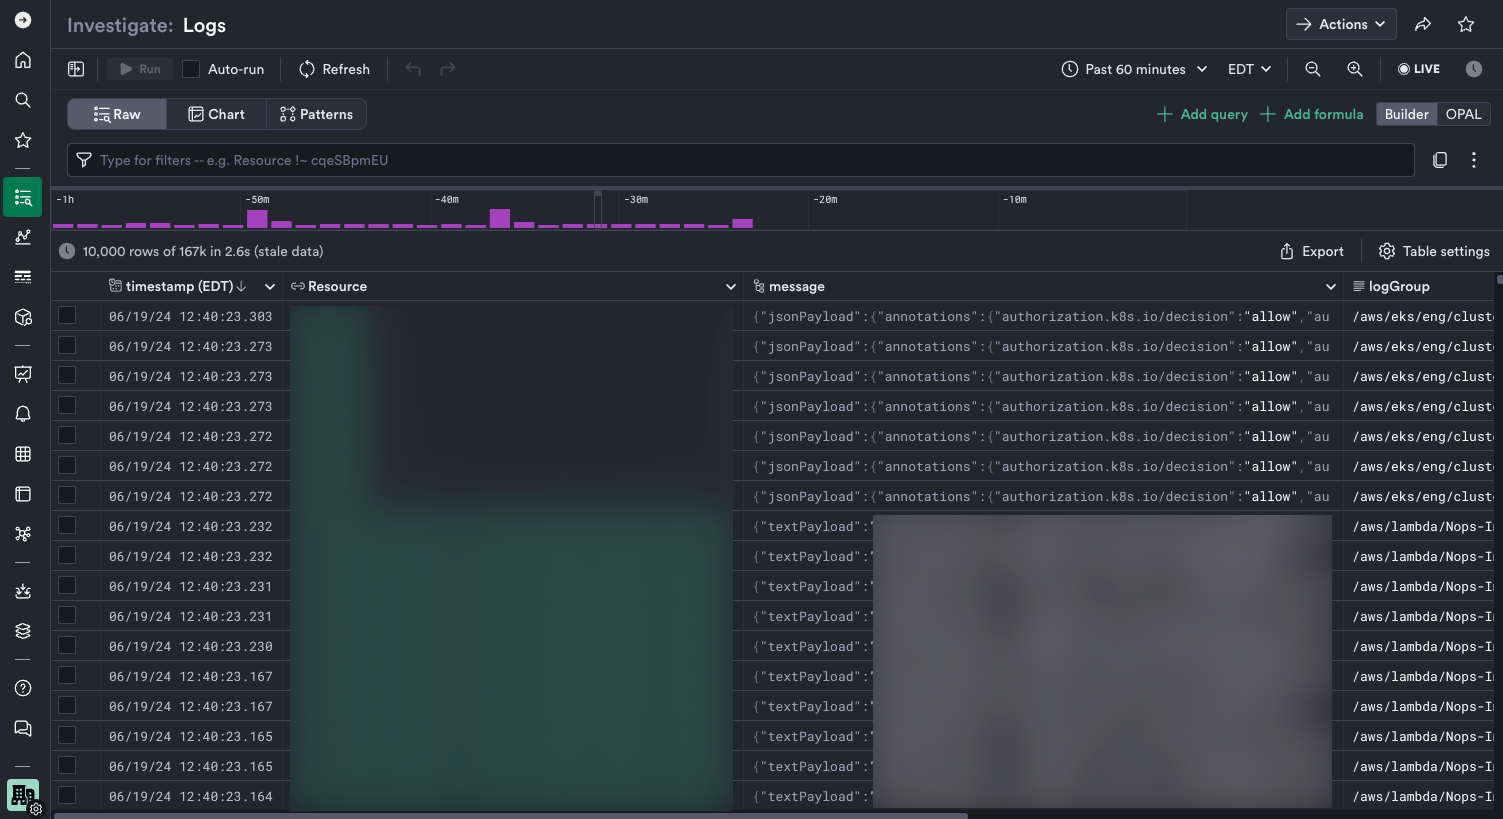
Inspect and extract fields from structure logs:
