View PostgreSQL data in Observe
After installing the PostgreSQL app, view the health of your PostgreSQL DB instances by going to the Instance dataset in Observe. This dataset models the instances of PostgreSQL DB running in your environment, whether you manage the instance on a host or through a managed service on a cloud provider. This dataset offers GraphLinks to the following resources:
- Metrics
- Log Events
- Query Logs
- Error Logs
- PG Stat Activity Events
From this resource, you can filter to any number of PostgreSQL DB instances and use the default dashboards to get insight into health and status.
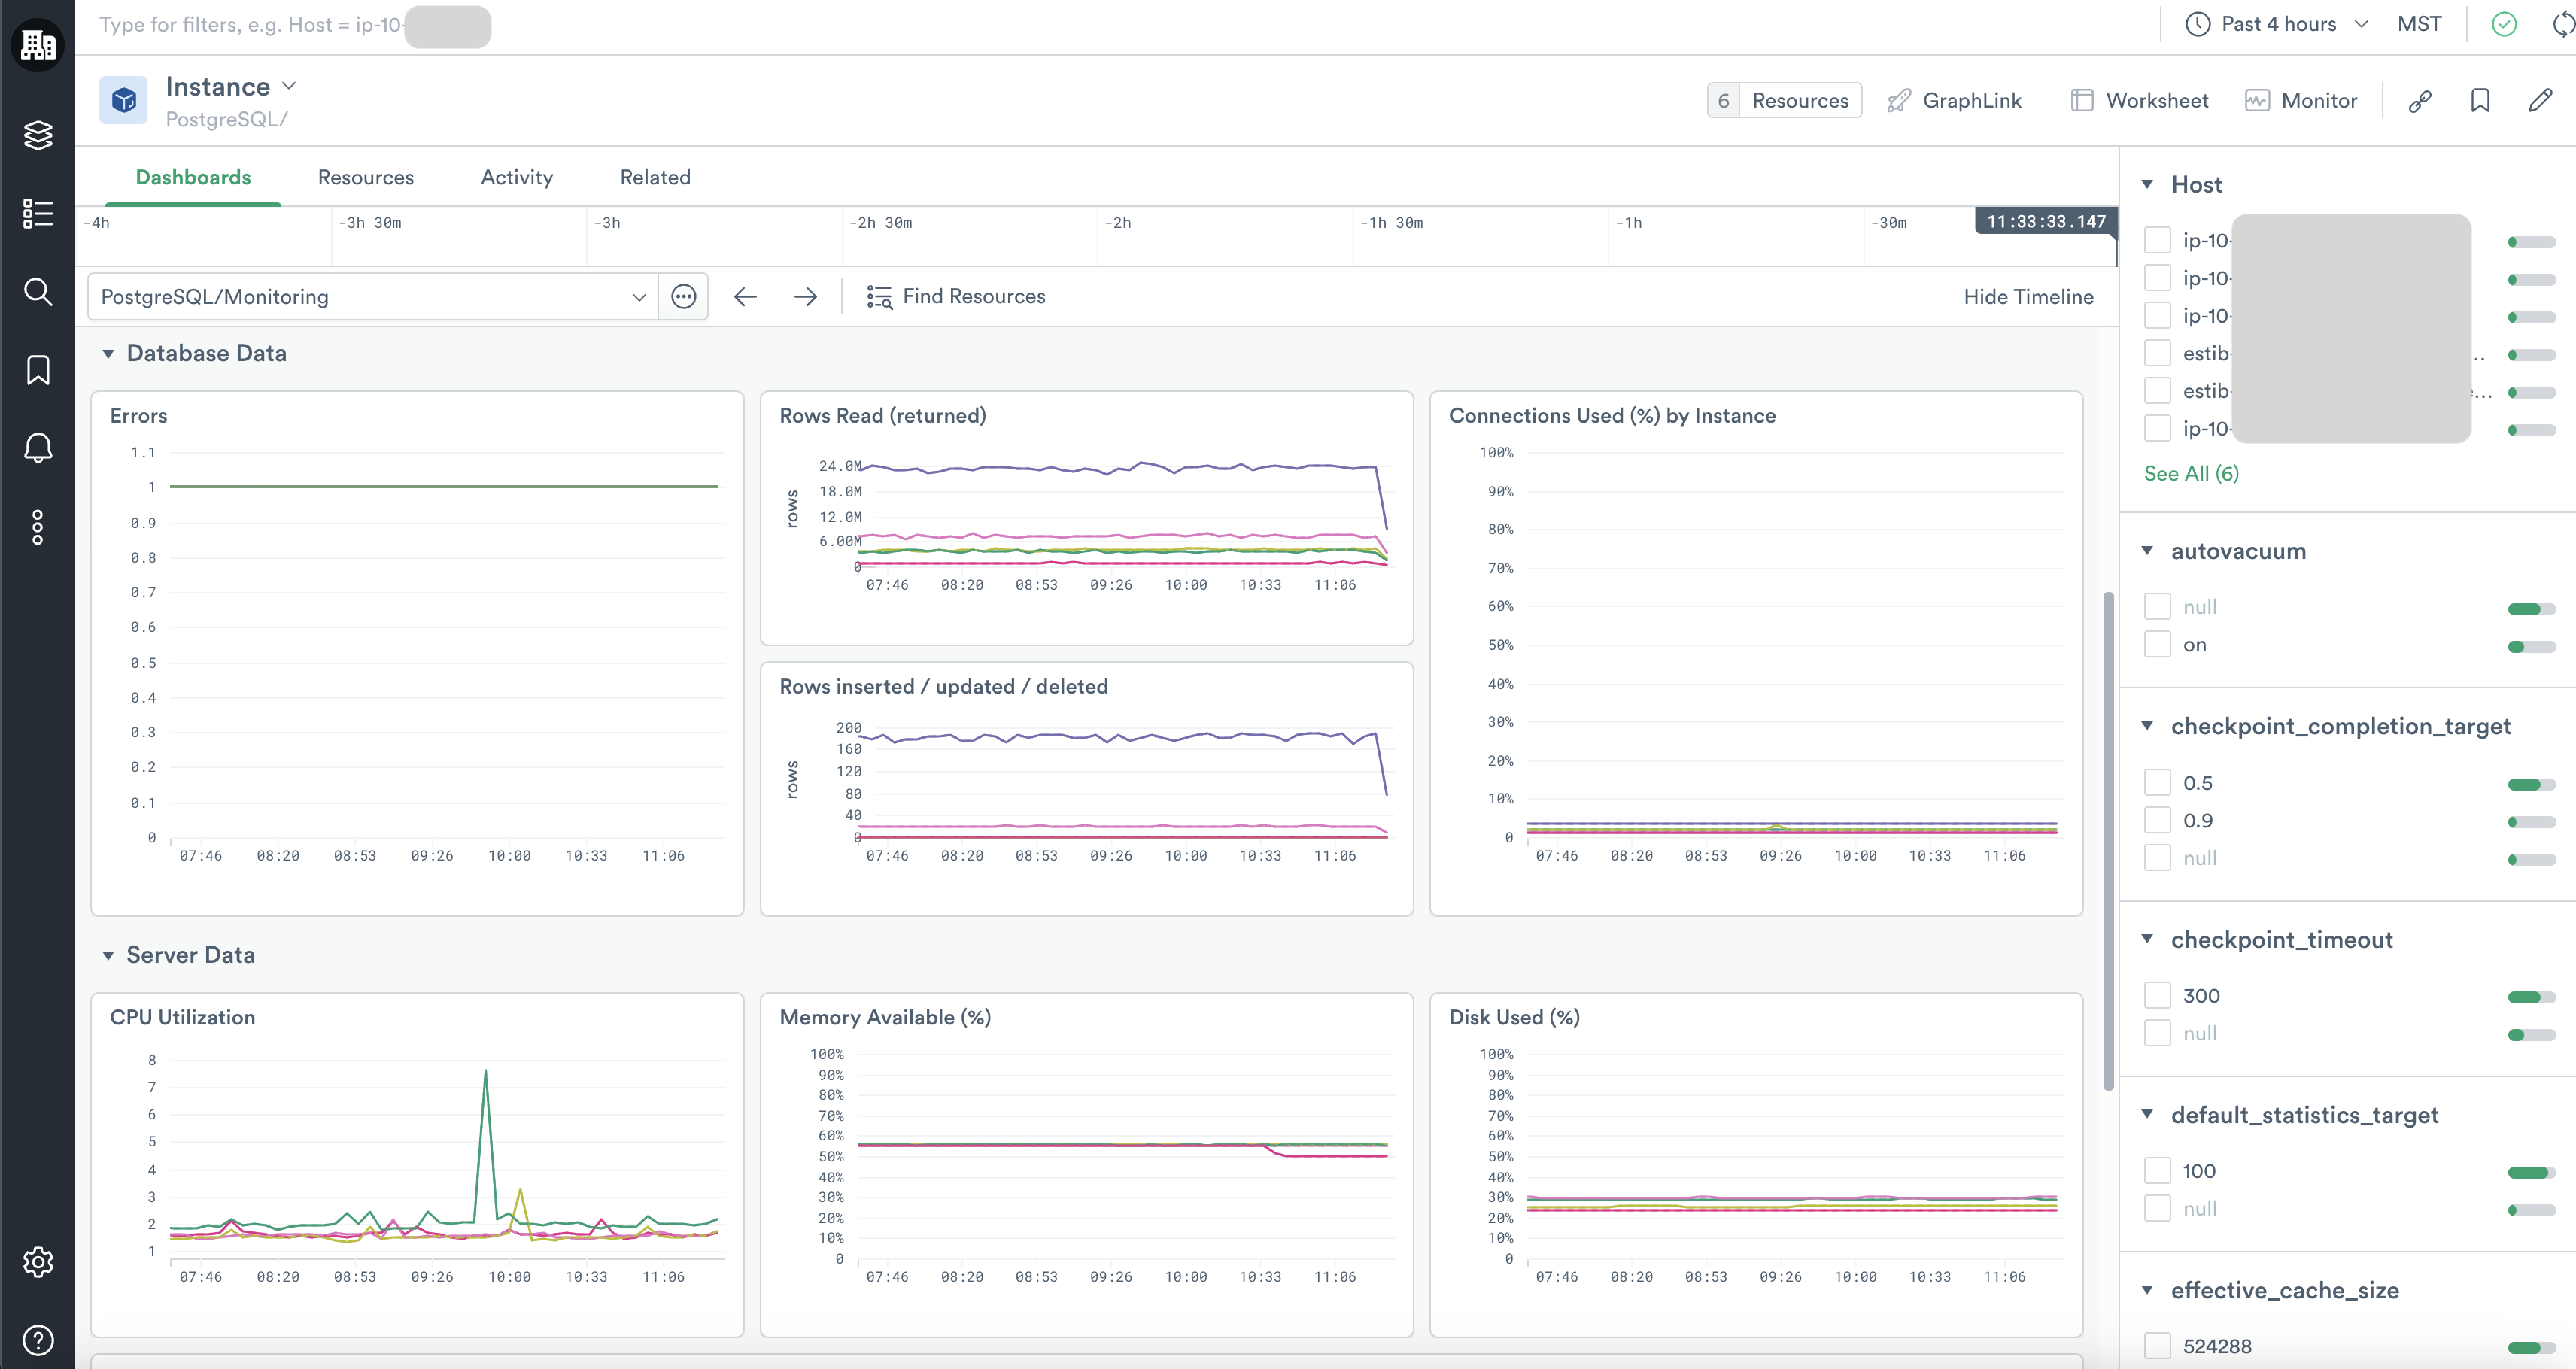
PostgreSQL/Monitoring
The PostgreSQL/Monitoring dashboard offers a quick glance at key health metrics for your PostgreSQL DB instances, including summaries of errors, throughput, connection availability, and server resource consumption. From these graphs, you can use GraphLink to see related data in the Host app or jump to other PostgreSQL DB dashboards.
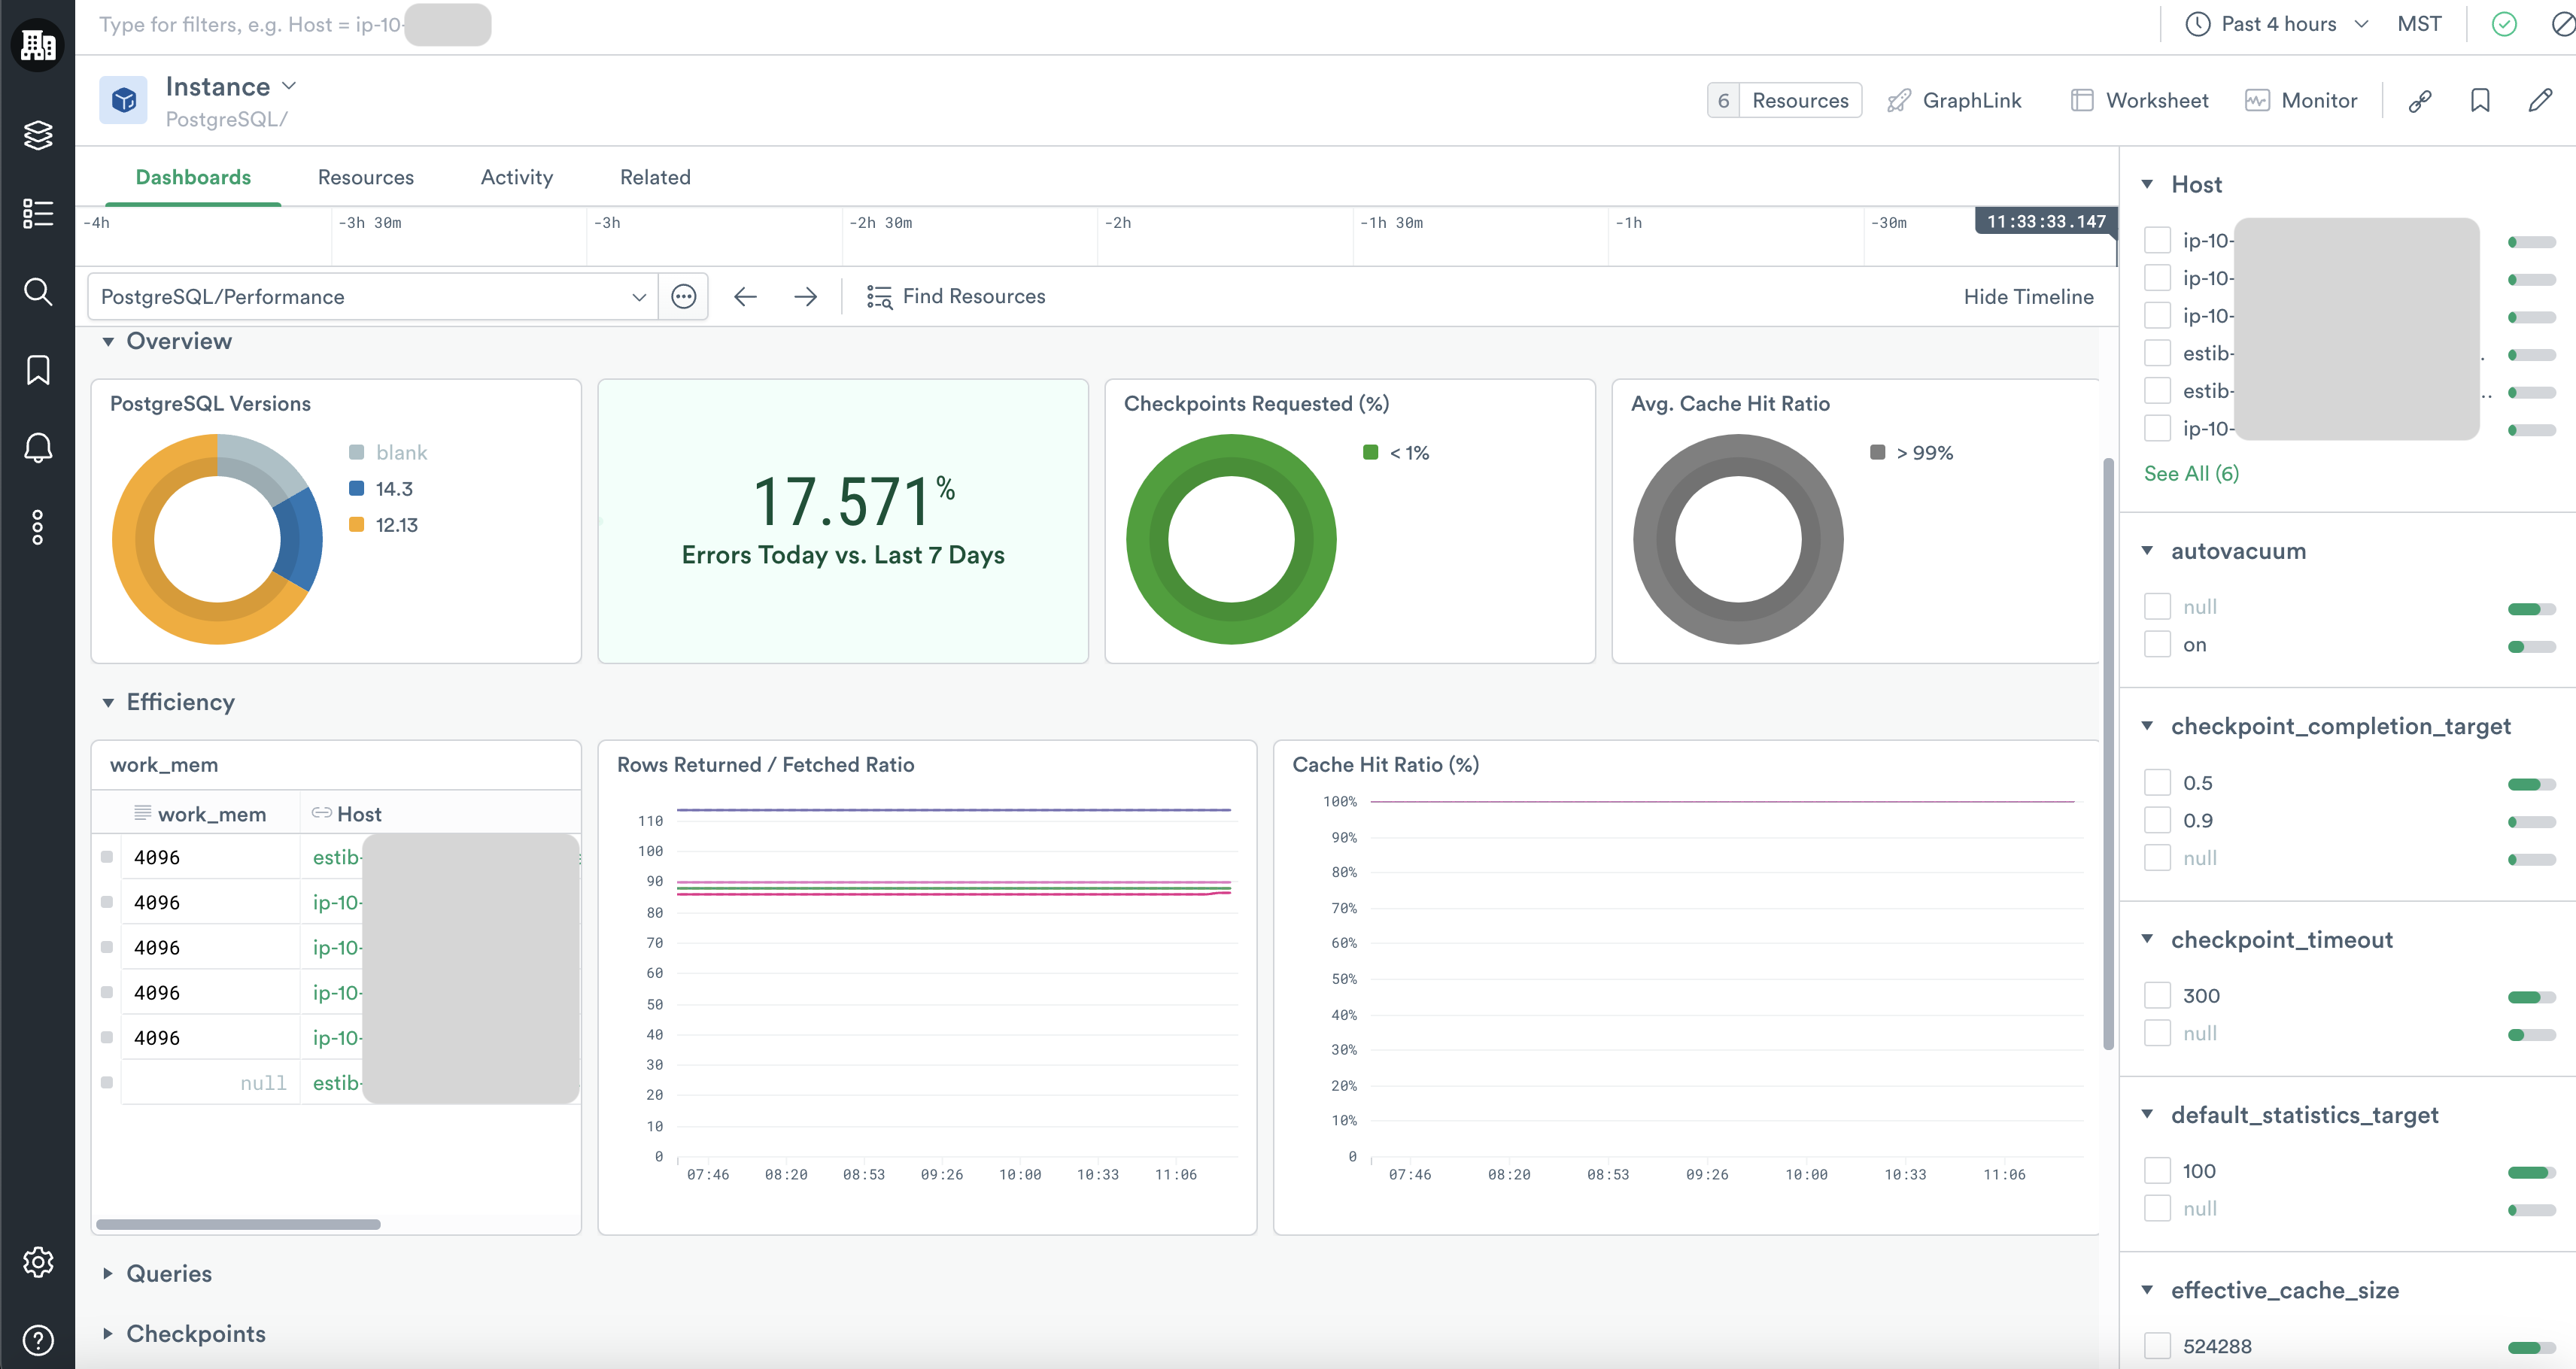
PostgreSQL/Performance
The PostgreSQL/Performance dashboard summarizes key aspects of your PostgreSQL DB instance performance, including data on cache hits, query performance, and checkpoint activity. As you identify important trends and anomalies in this dashboard, you can then pivot to other more specific dashboards and dive into deeper investigations.
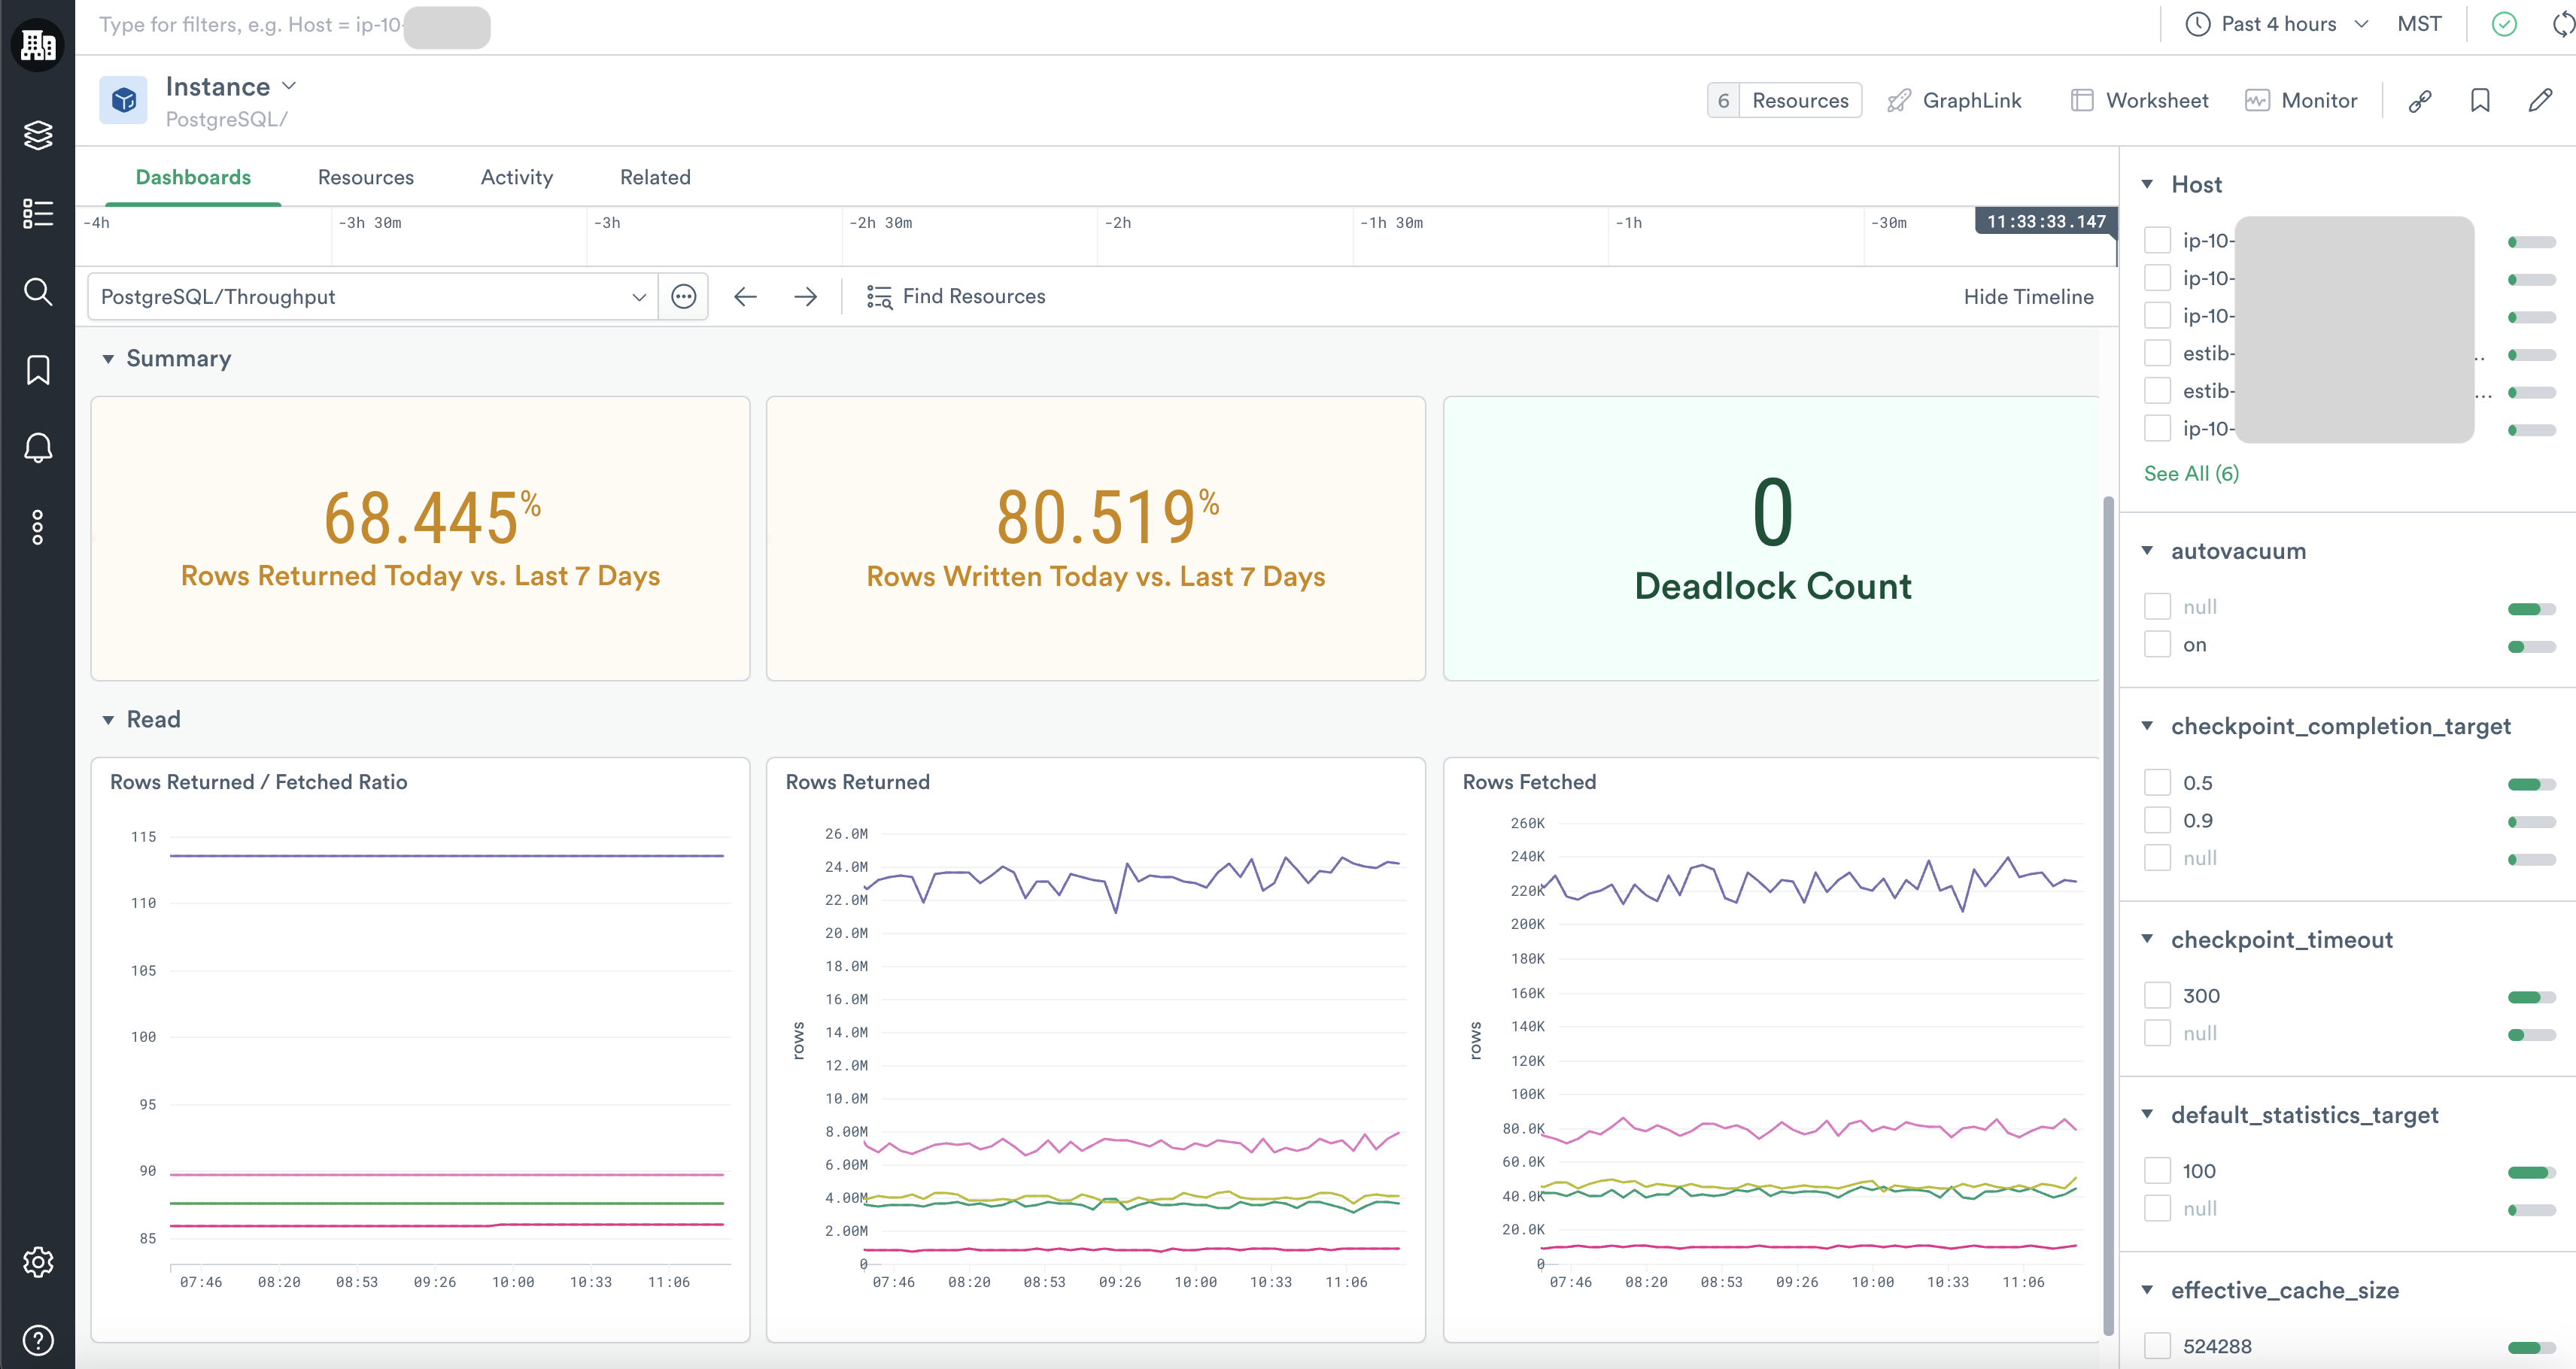
PostgreSQL/Throughput
The PostgreSQL/Throughput dashboard gives you a deeper view of the read, write, and deadlock activity on your instances.
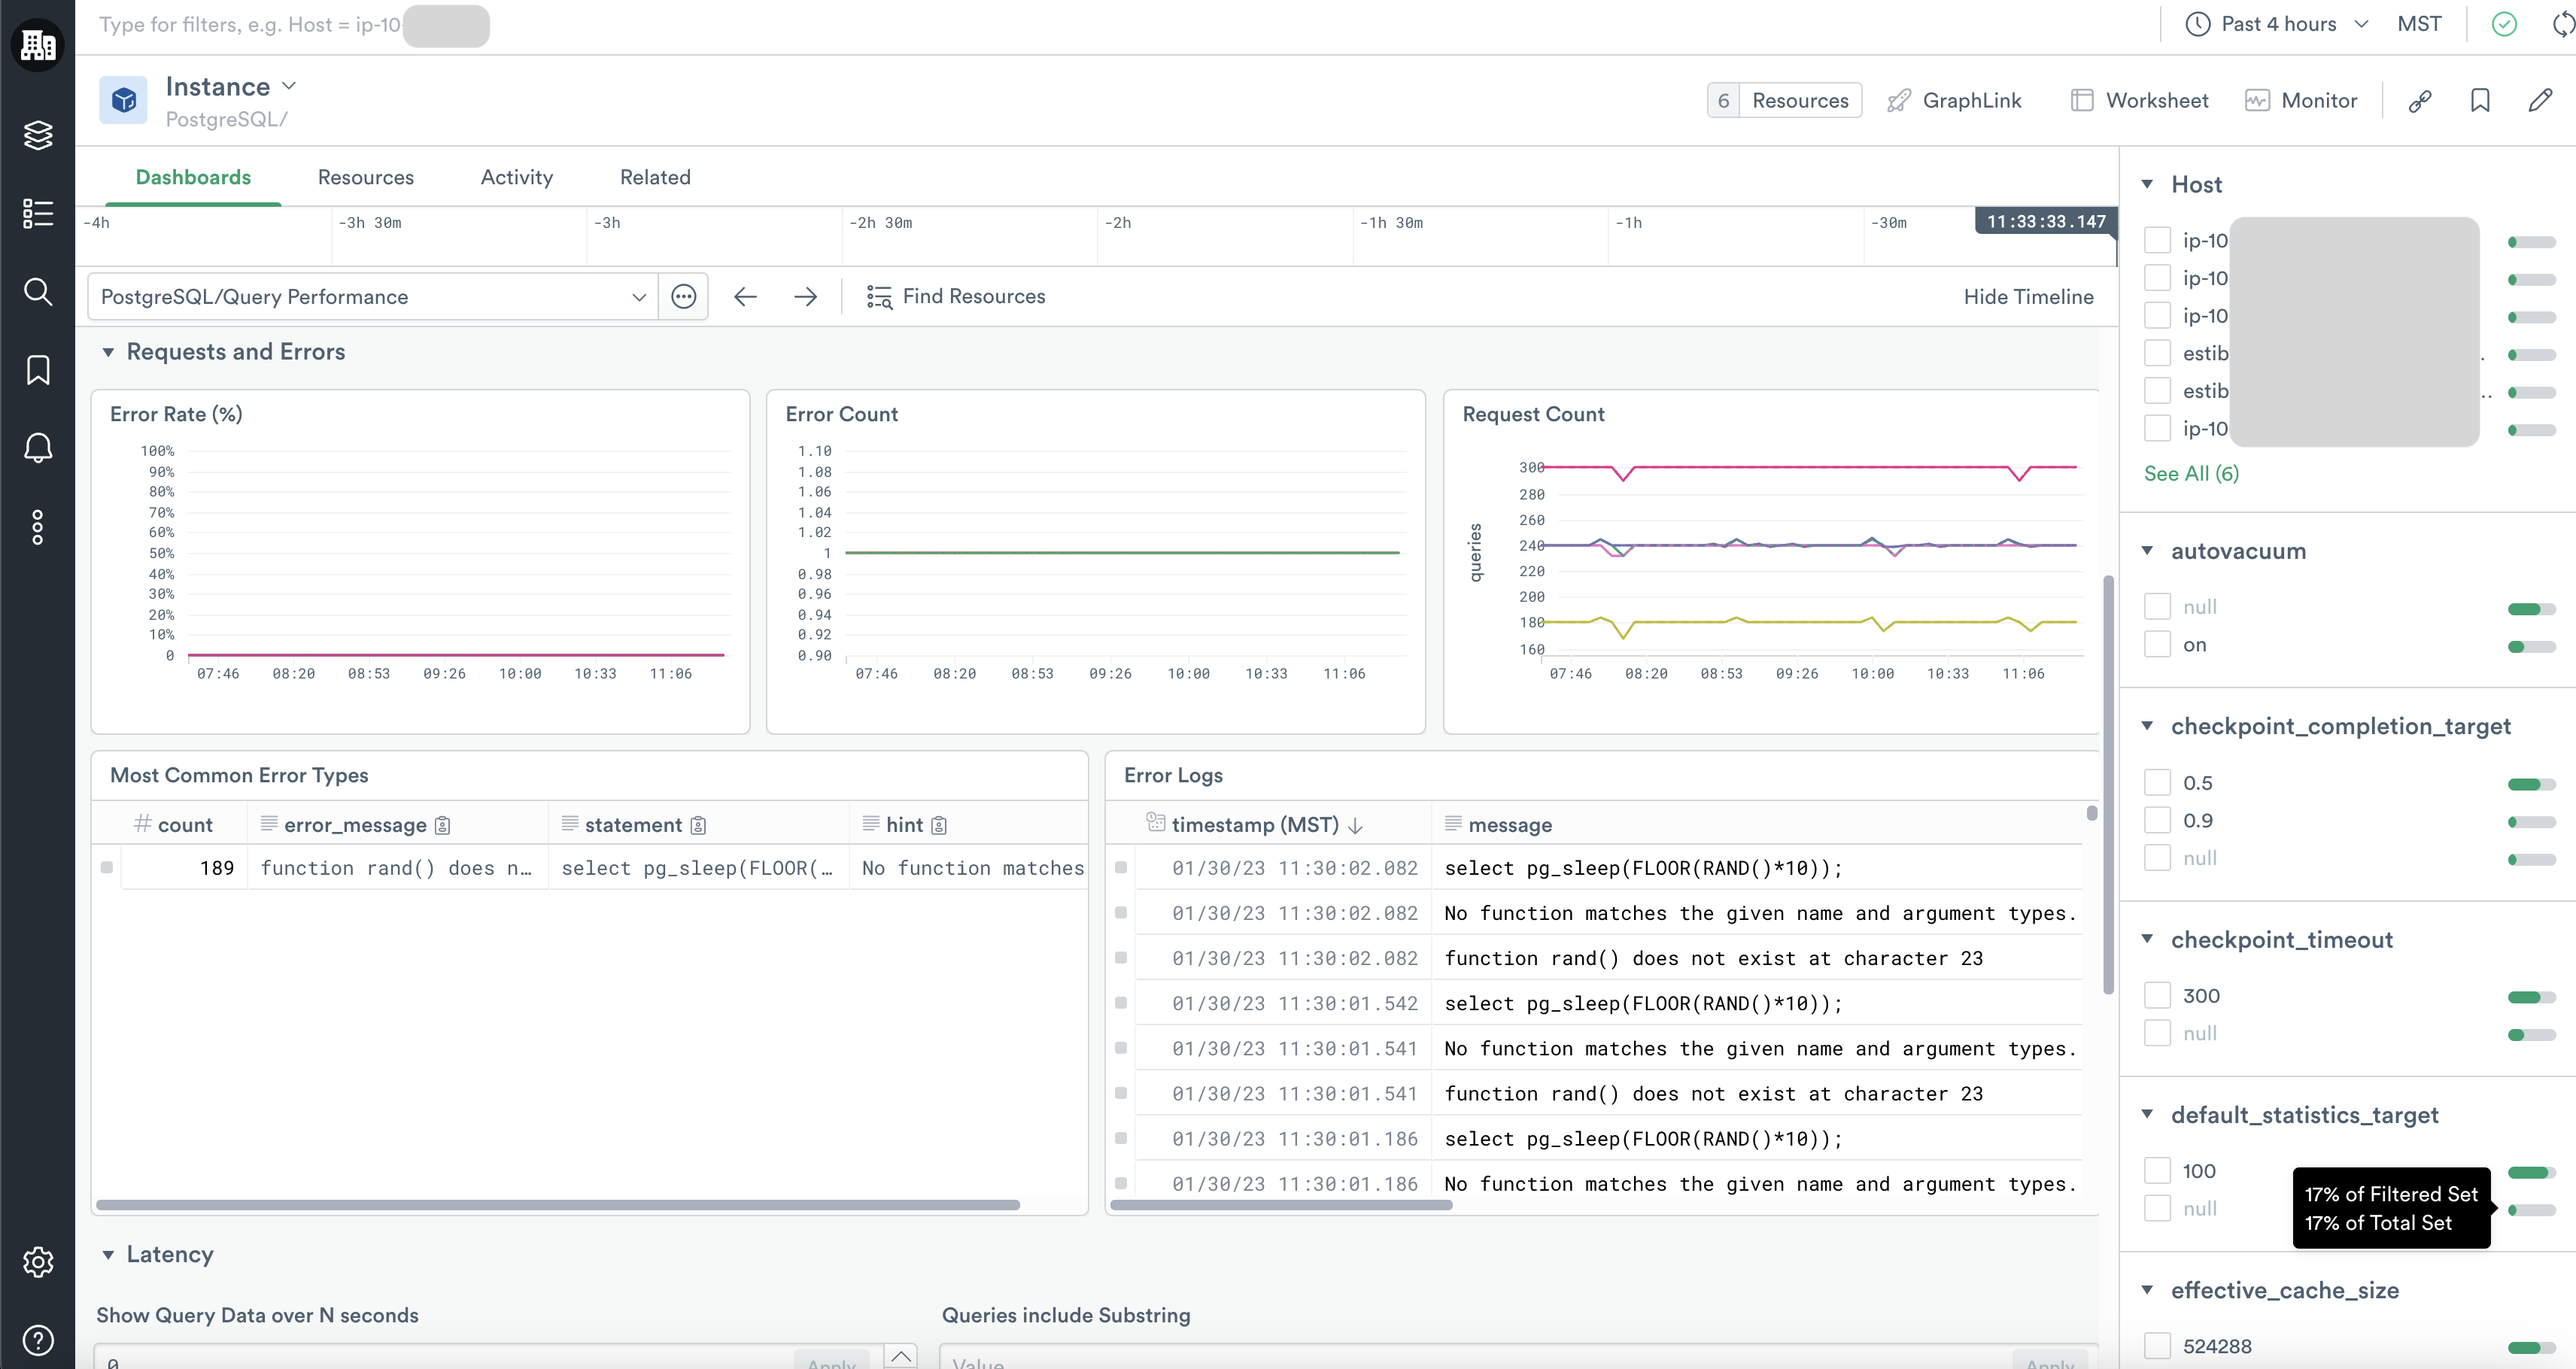
PostgreSQL/Query Performance
With the PostgreSQL/Query Performance dashboard you can explore the error rates, request rates, and latency of queries on your database instances. You can even inspect which queries are associated with extra latency.
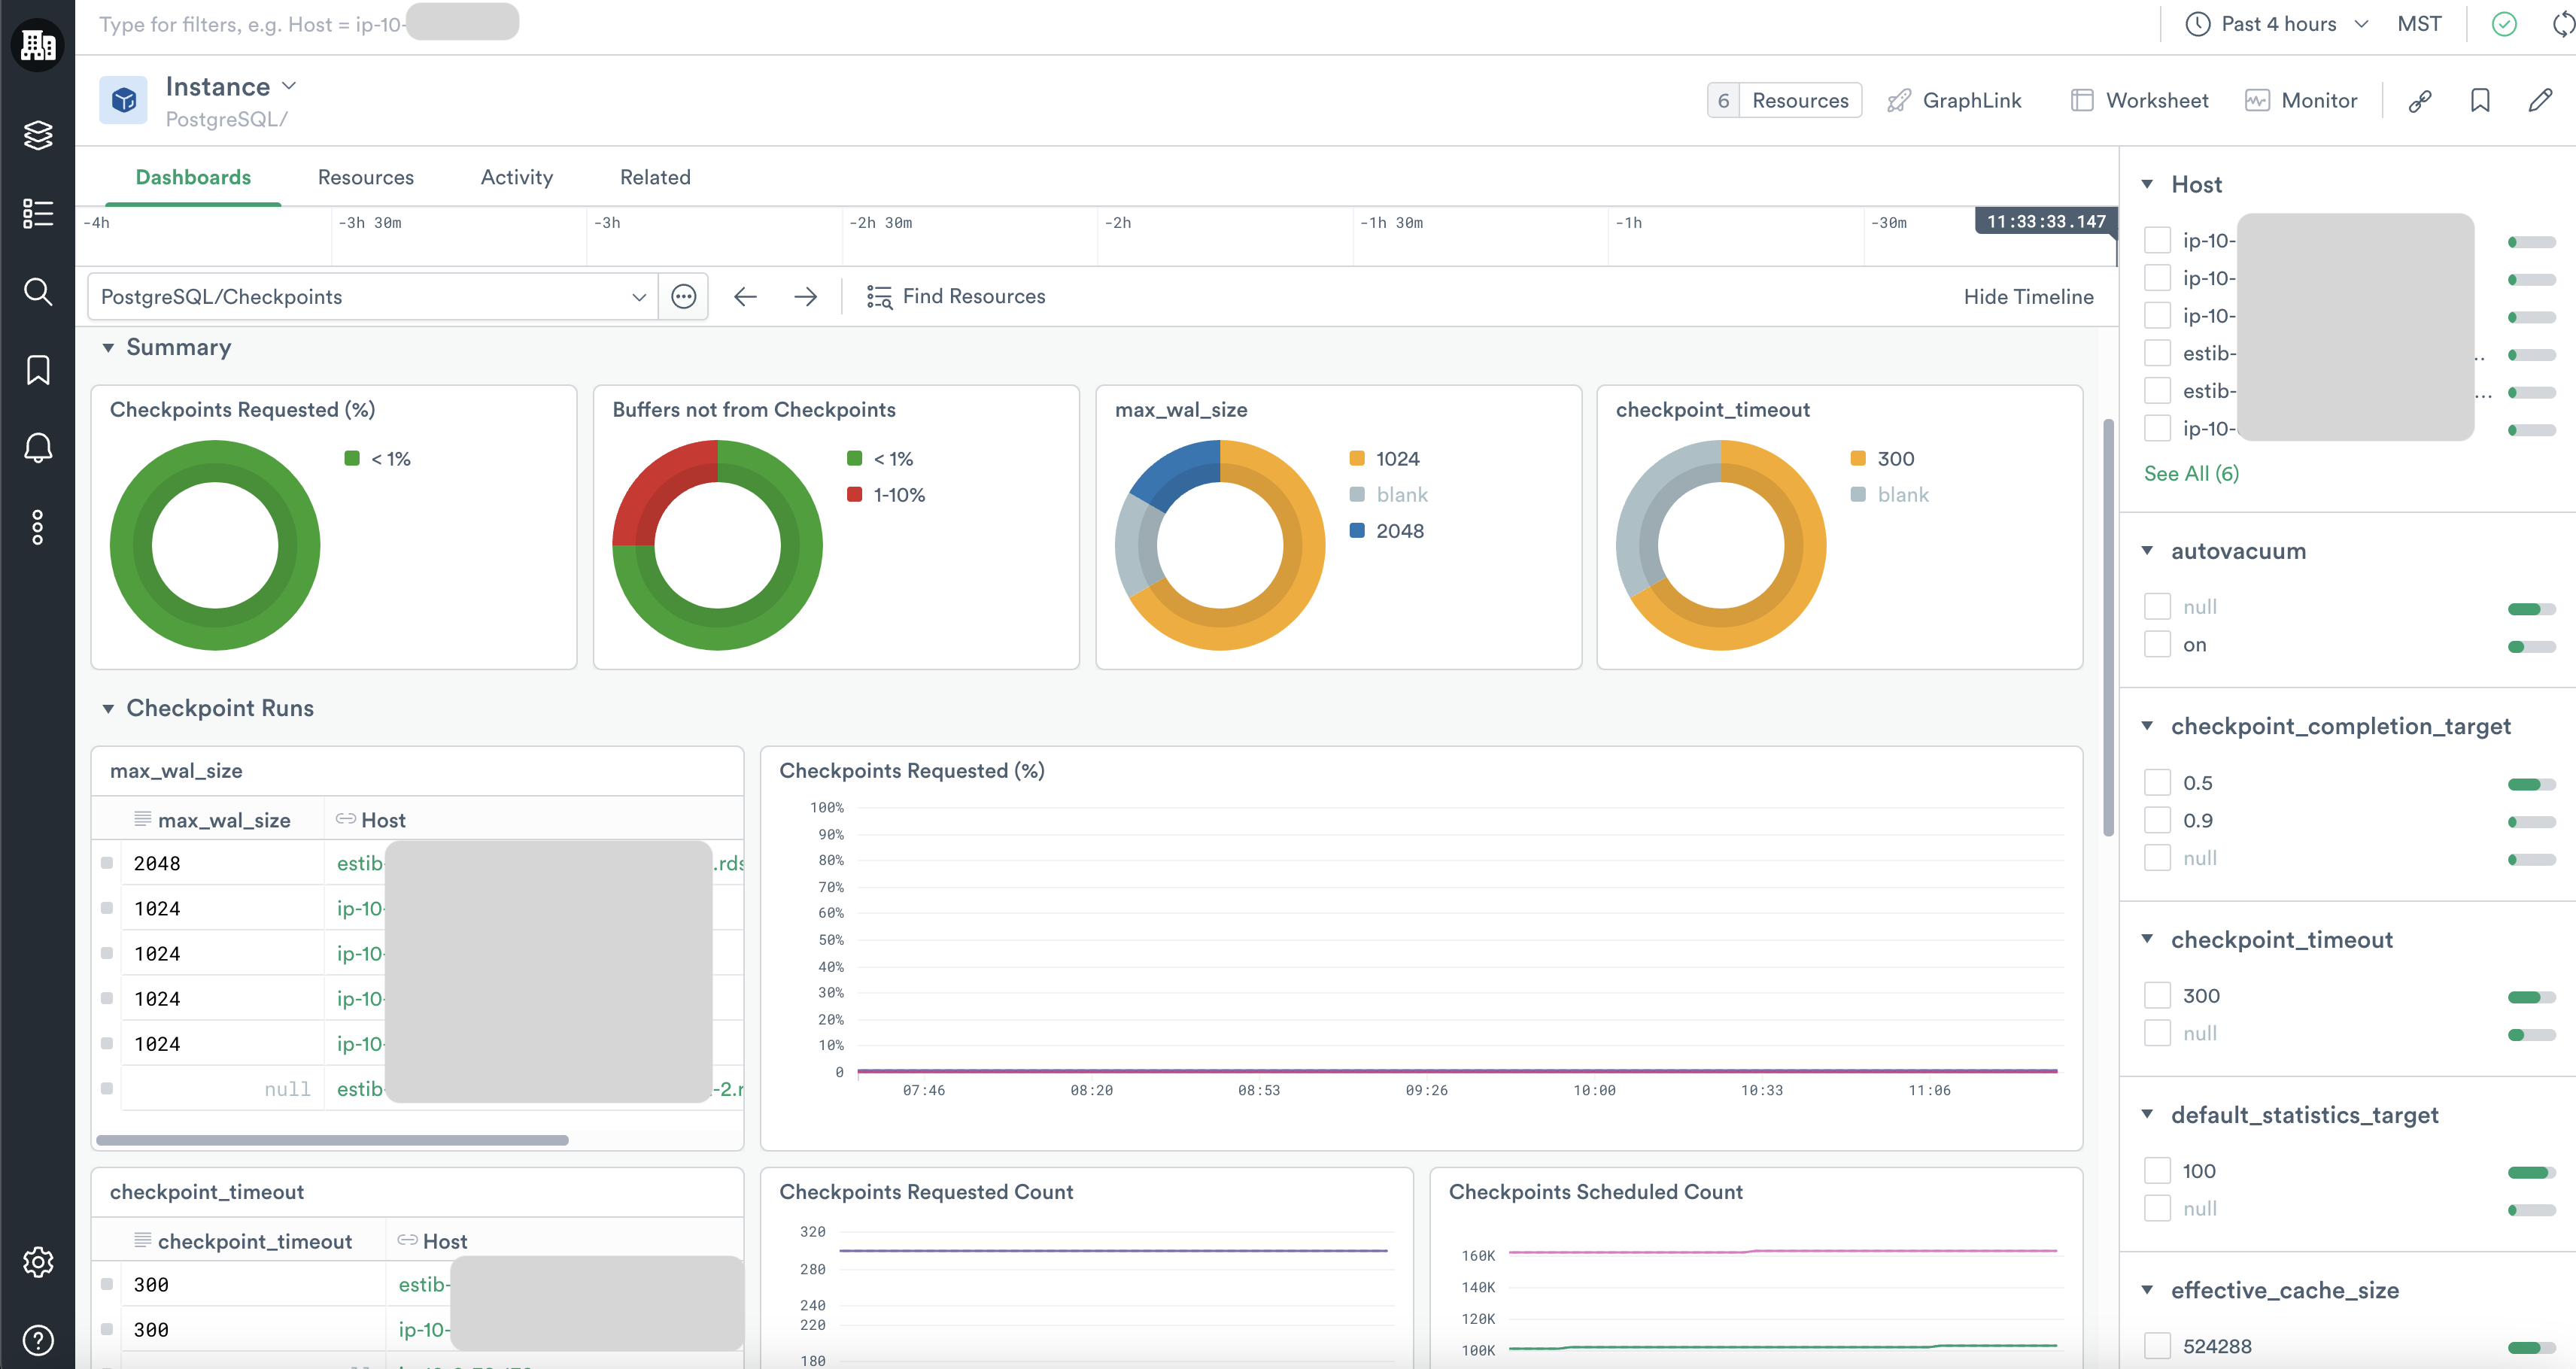
PostgreSQL/Checkpoints
The PostgreSQL/Checkpoints dashboard details the counts of checkpoints scheduled versus unscheduled as well as the count of buffers written by checkpoints versus backends and background writers.
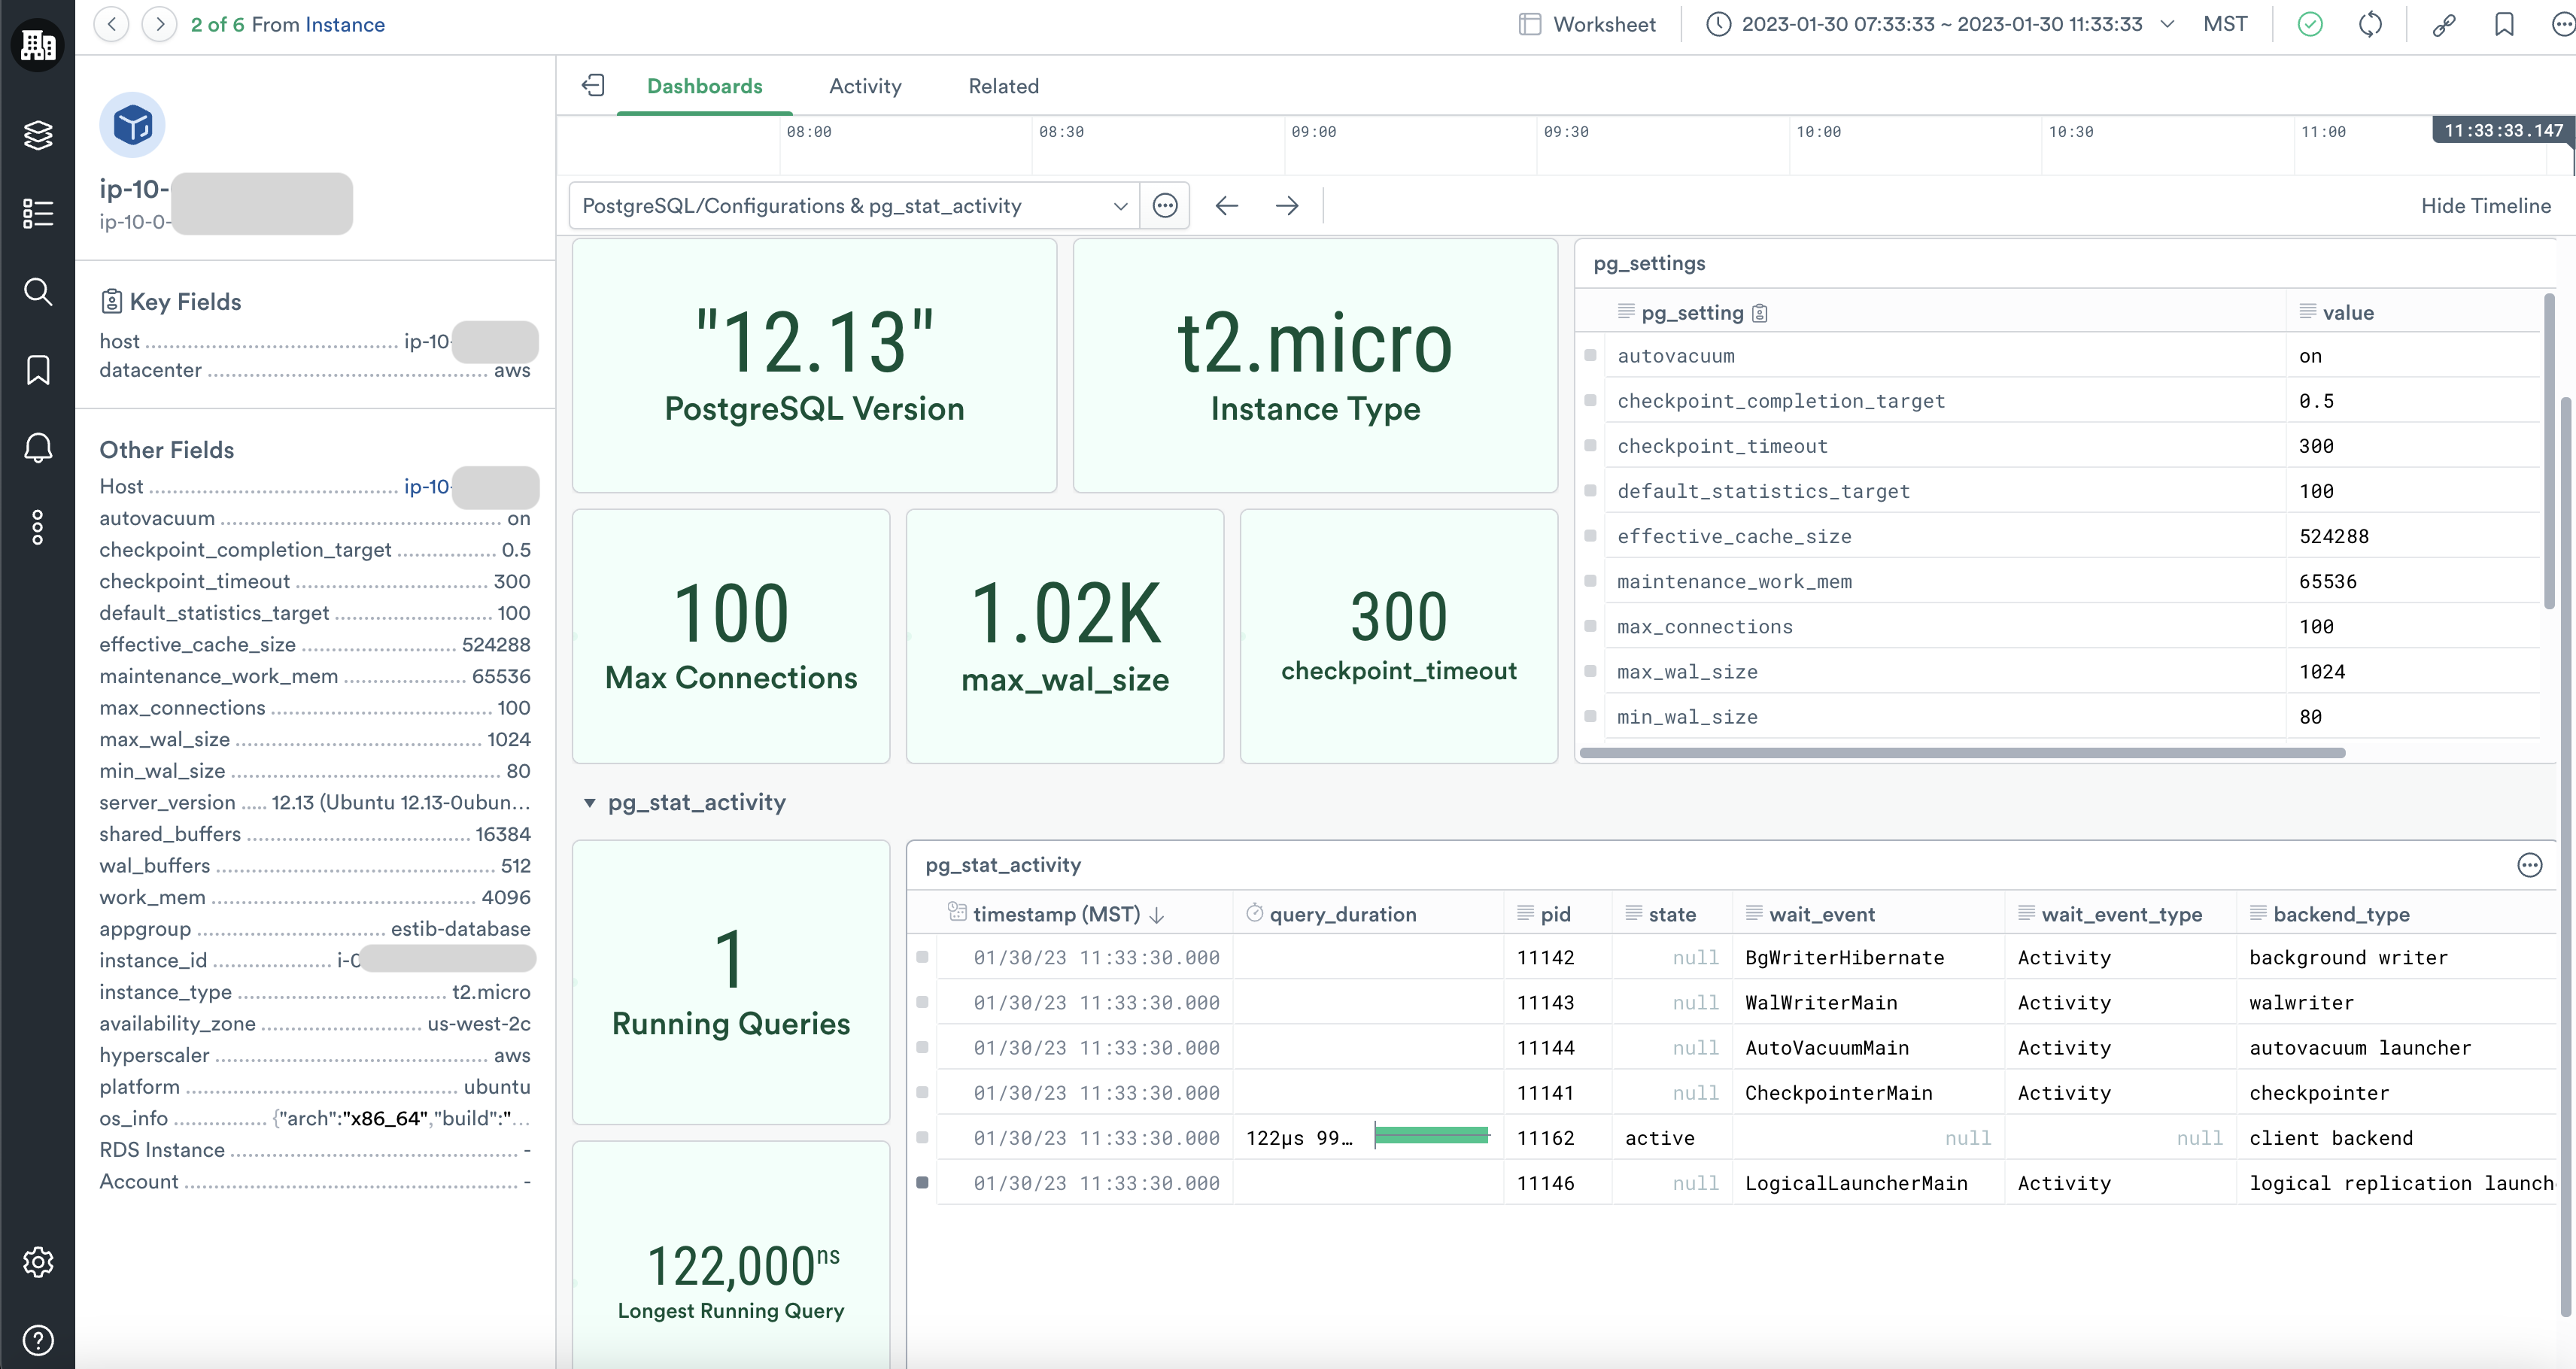
PostgreSQL/Configurations & pg_stat_activity
By clicking through a specific resource instance, you can also review its pg_settings in the PostgreSQL/Configurations & pg_stat_activity dashboard without logging into the server. There you can also inspect the live running queries, their durations, and their PIDs, which is especially useful if you need to kill or troubleshoot runaway queries.
Updated 17 days ago