

Troubleshoot slow databases and n+1 issues
This example describes how you can troubleshoot slow databases and n+1 issues using Observe by Snowflake.
Here's how you can use Observe by Snowflake APM to detect n+1 issues and other types of database slowness in your distributed service.
Let's say you're an on-call developer, DevOps engineer, or SRE that's responsible for the e-commerce site and you've received a report of abnormal latency in the checkout service. Inspect the checkout service in Observe by Snowflake APM and see from the latency distribution that there are some outliers, and from the performance breakdown chart that there's a recent major spike in latency.
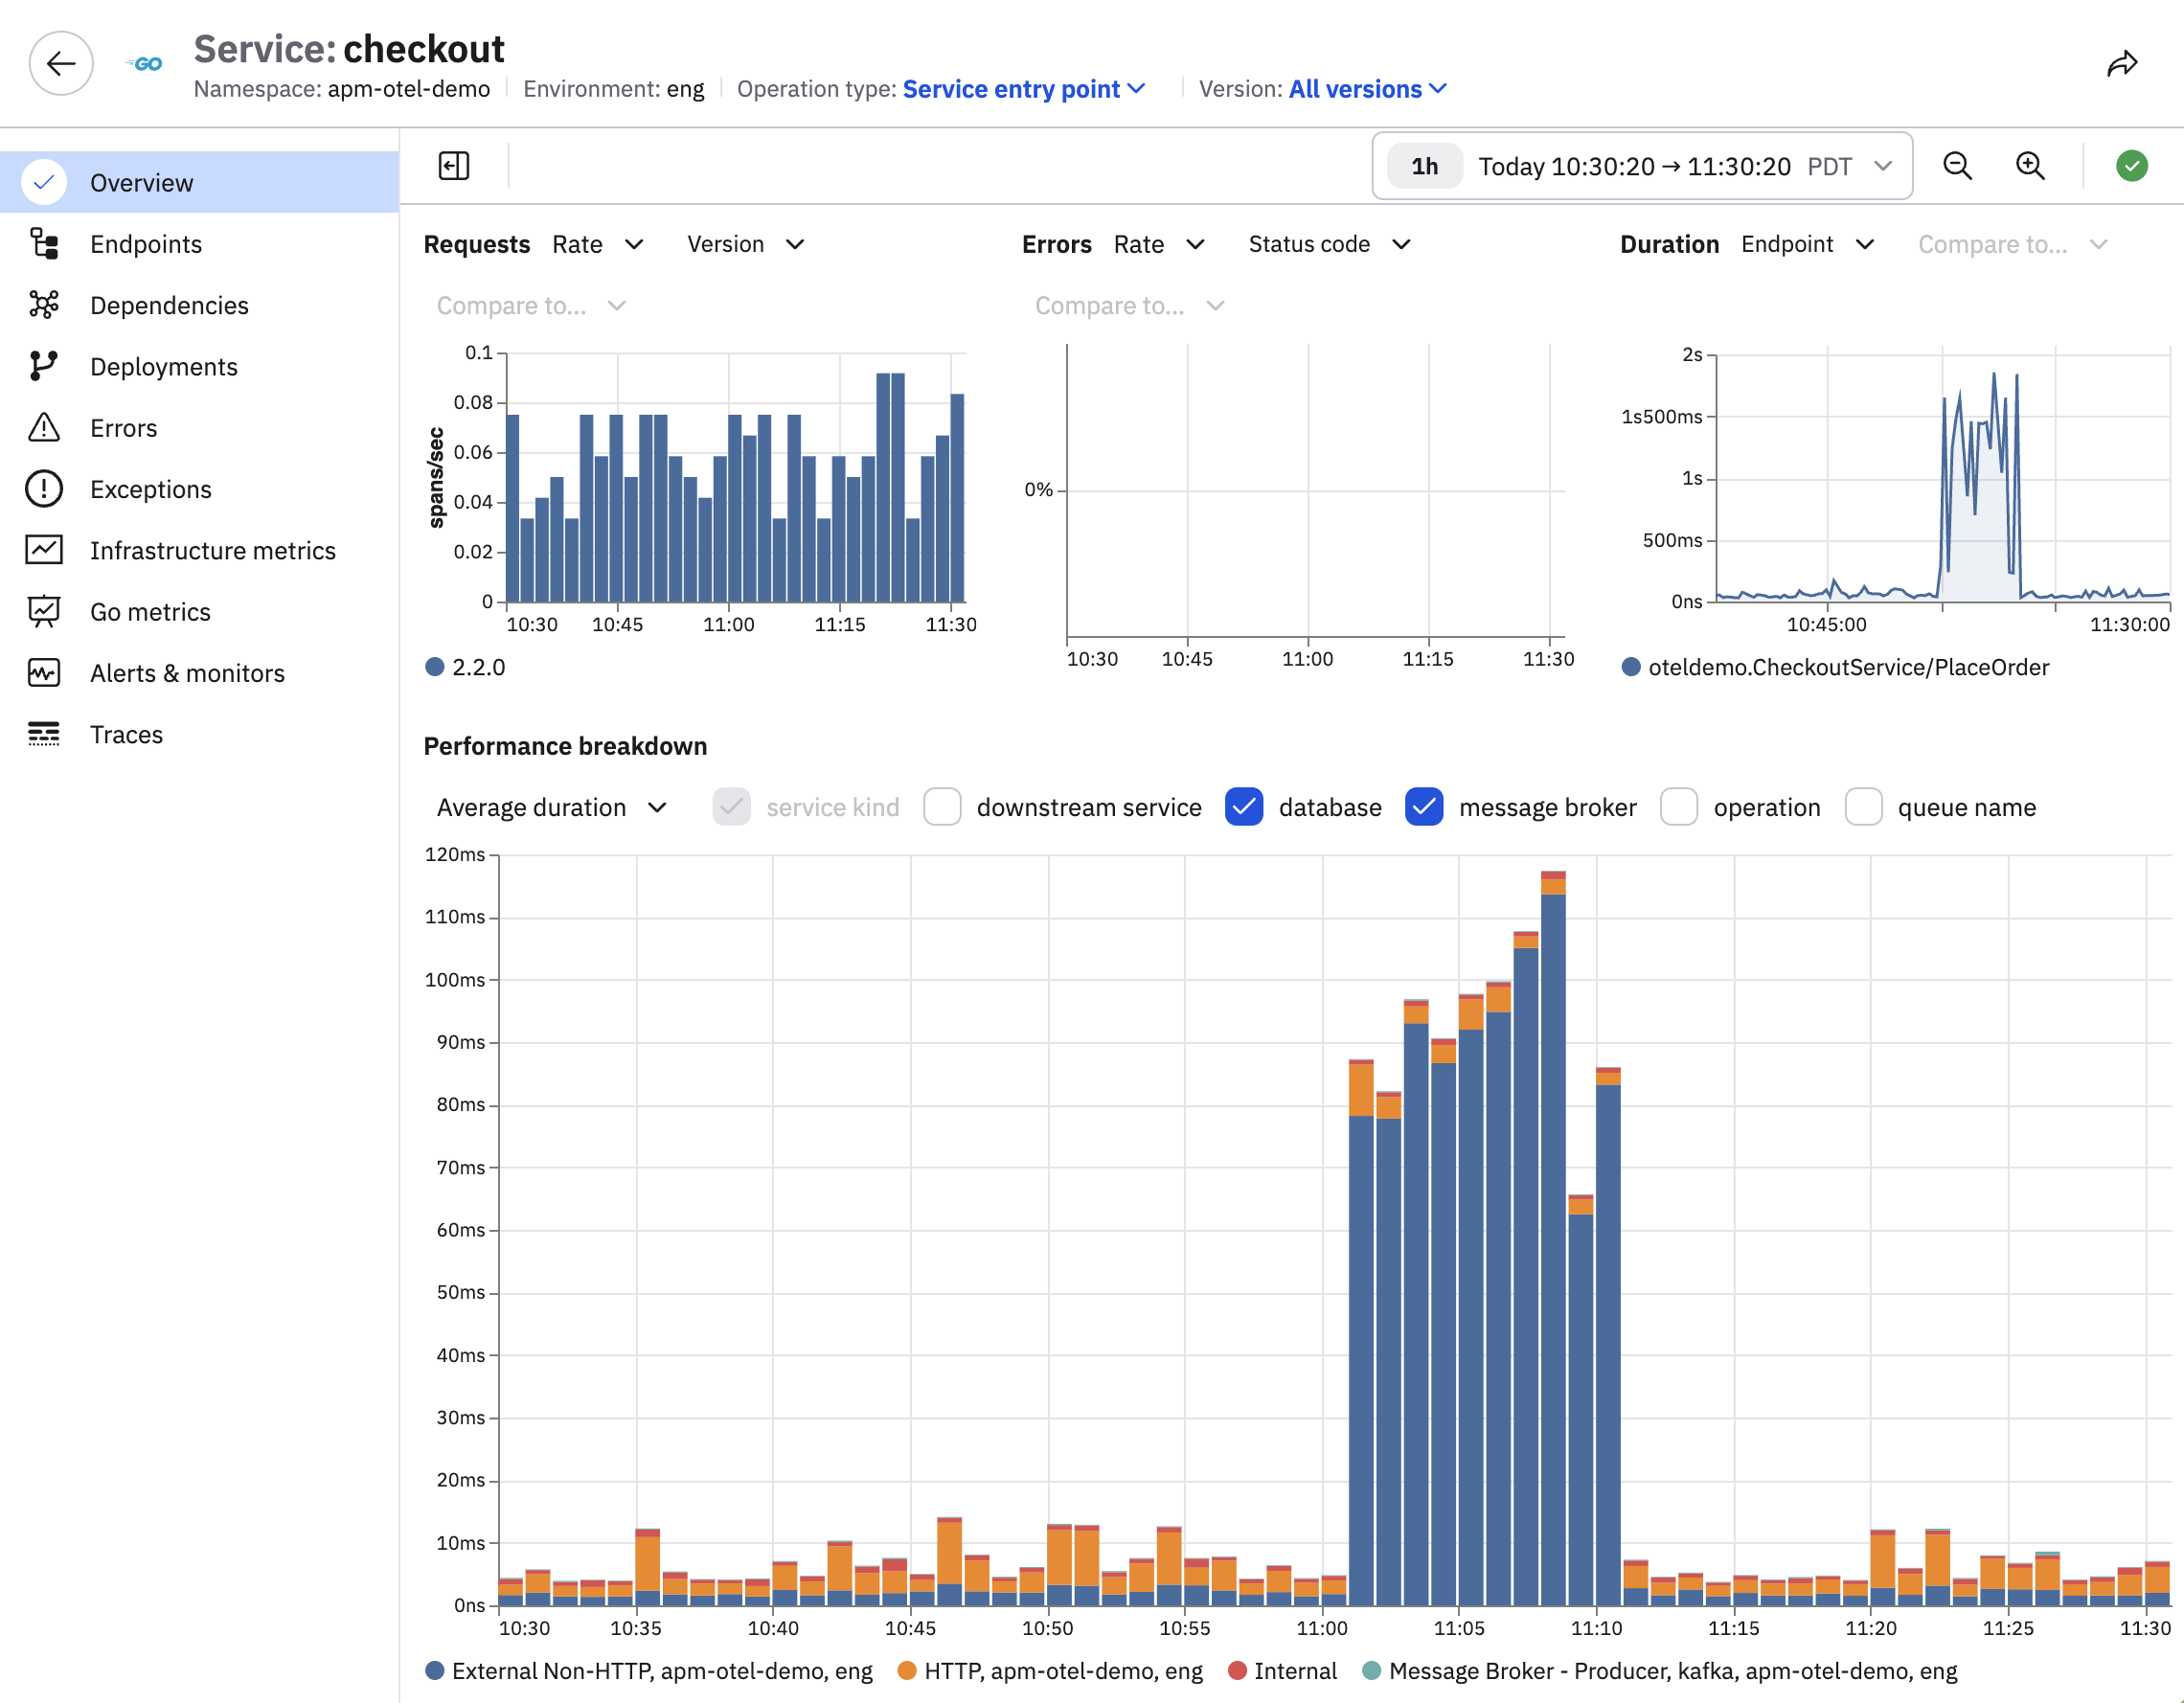
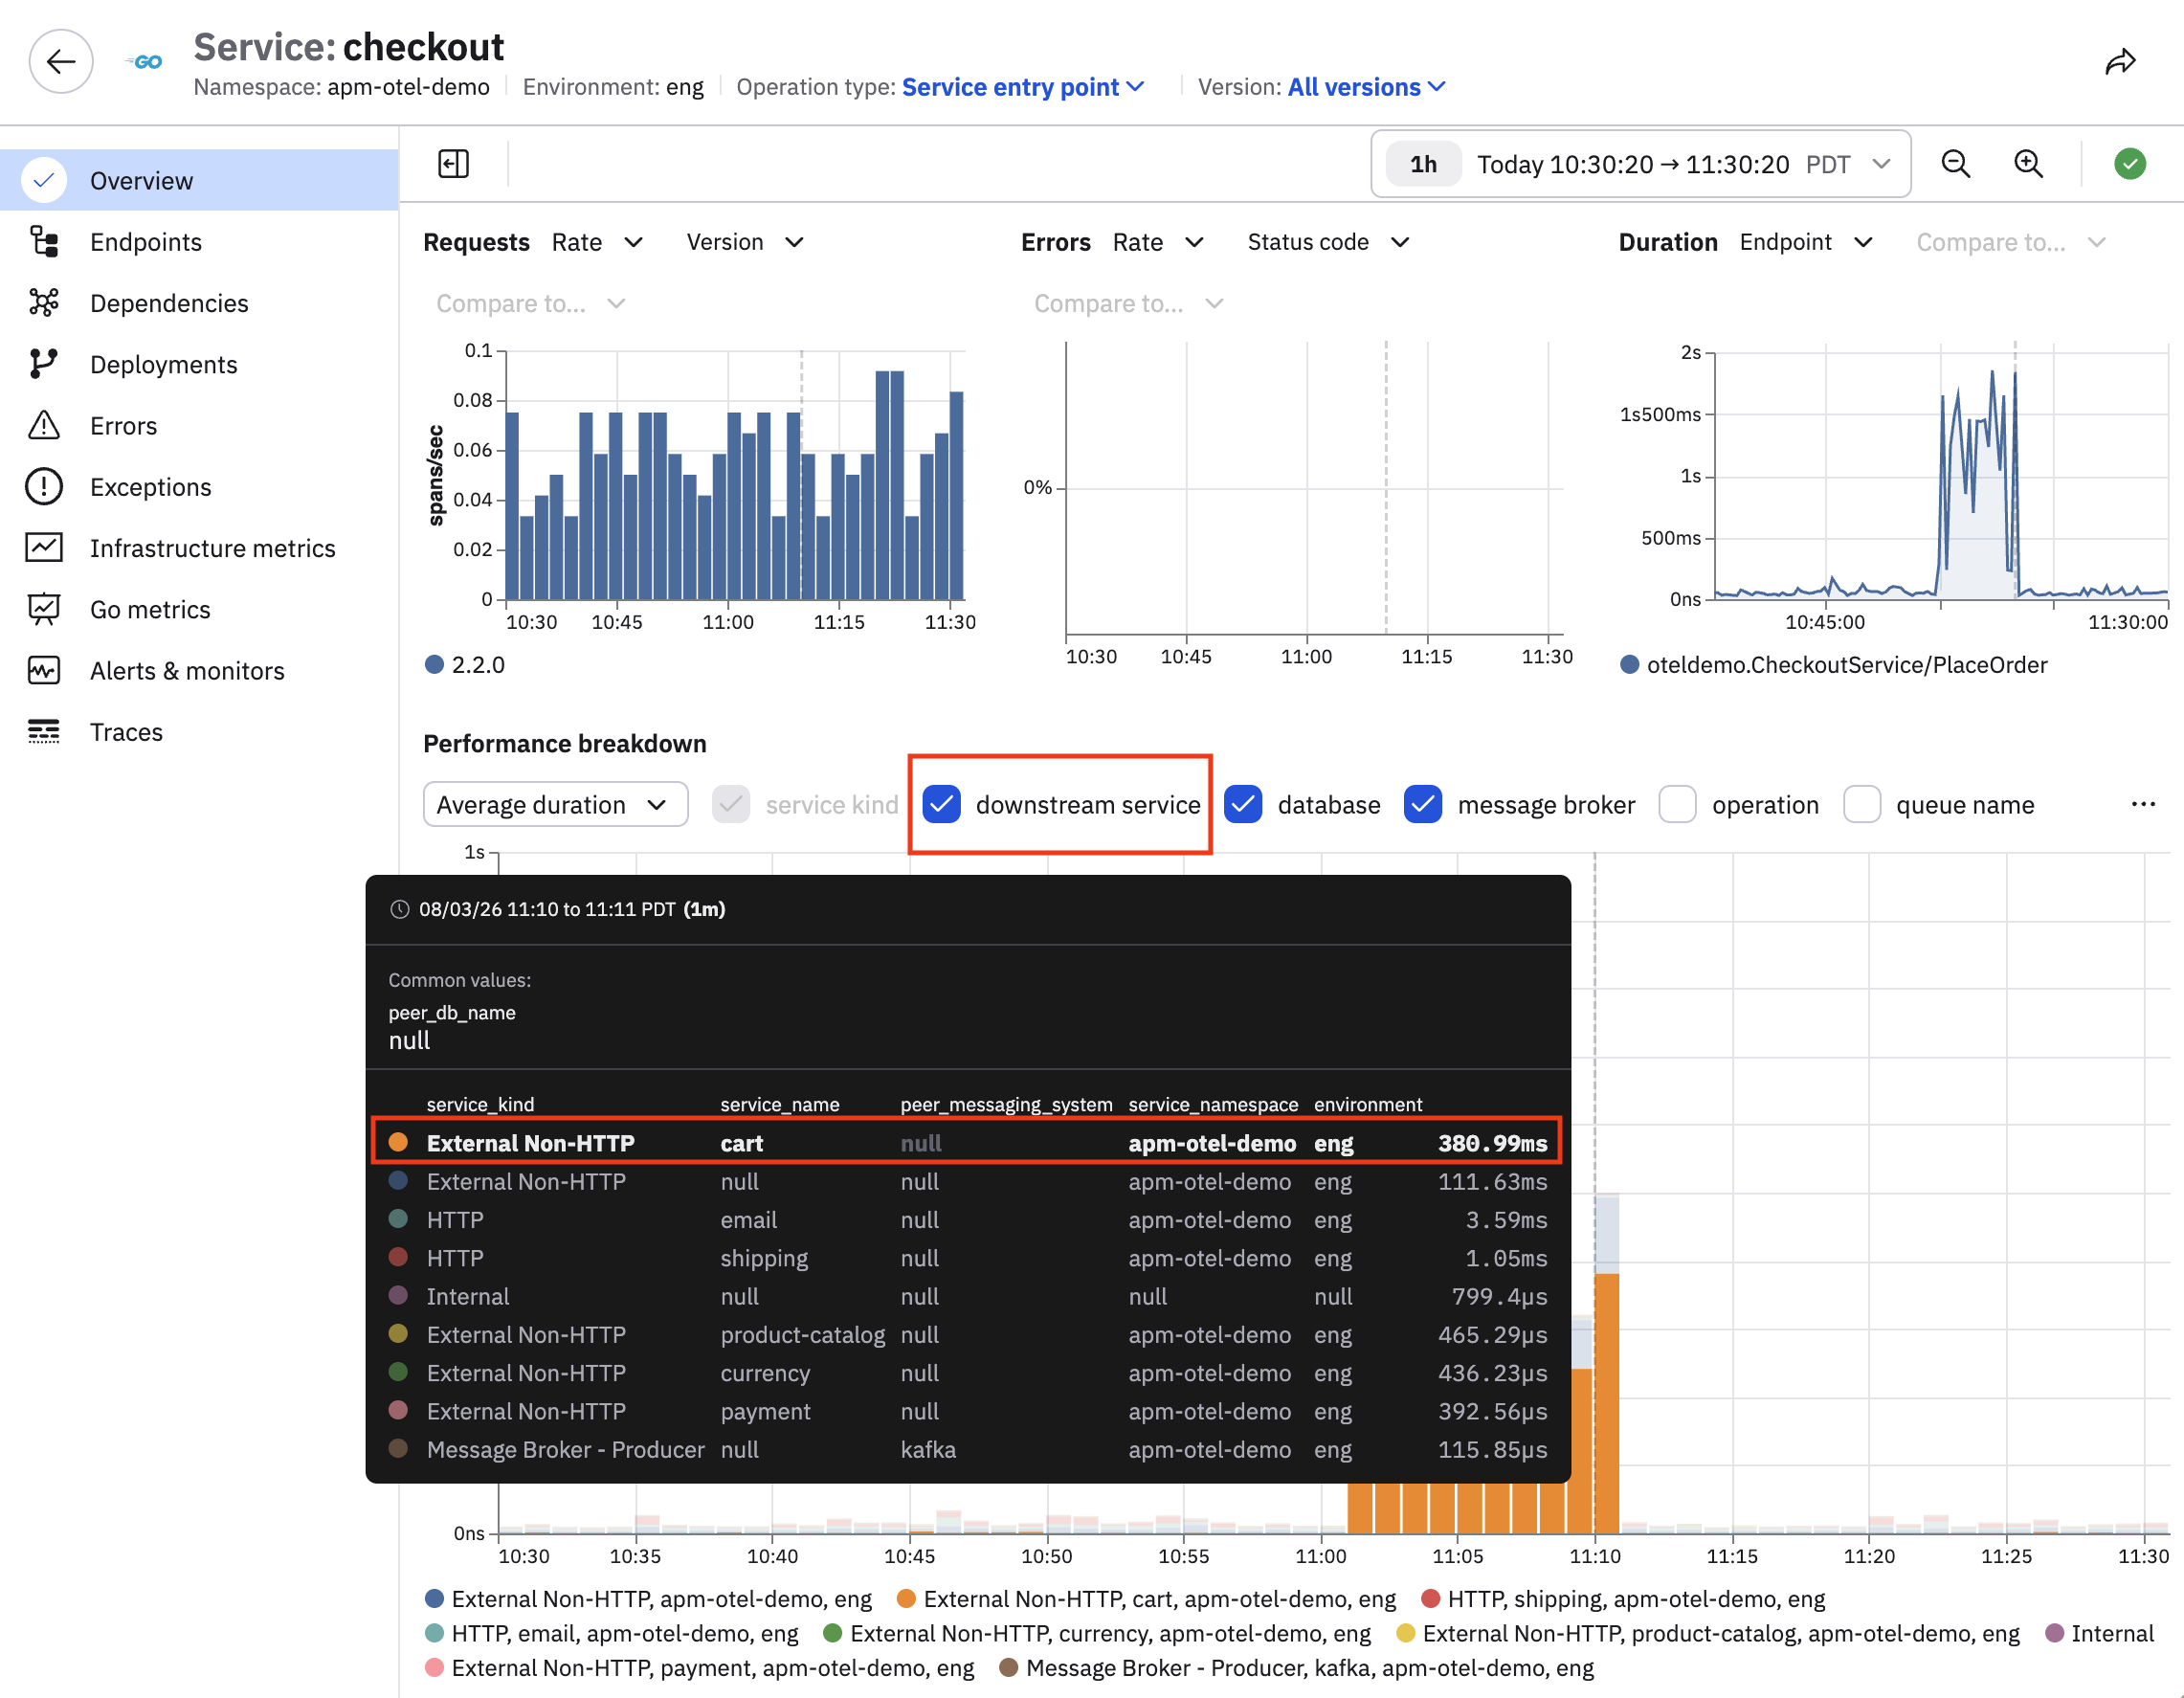
View the performance breakdown by downstream service to see that most of the time spent in the checkout service is actually waiting for the cart service to return a response.
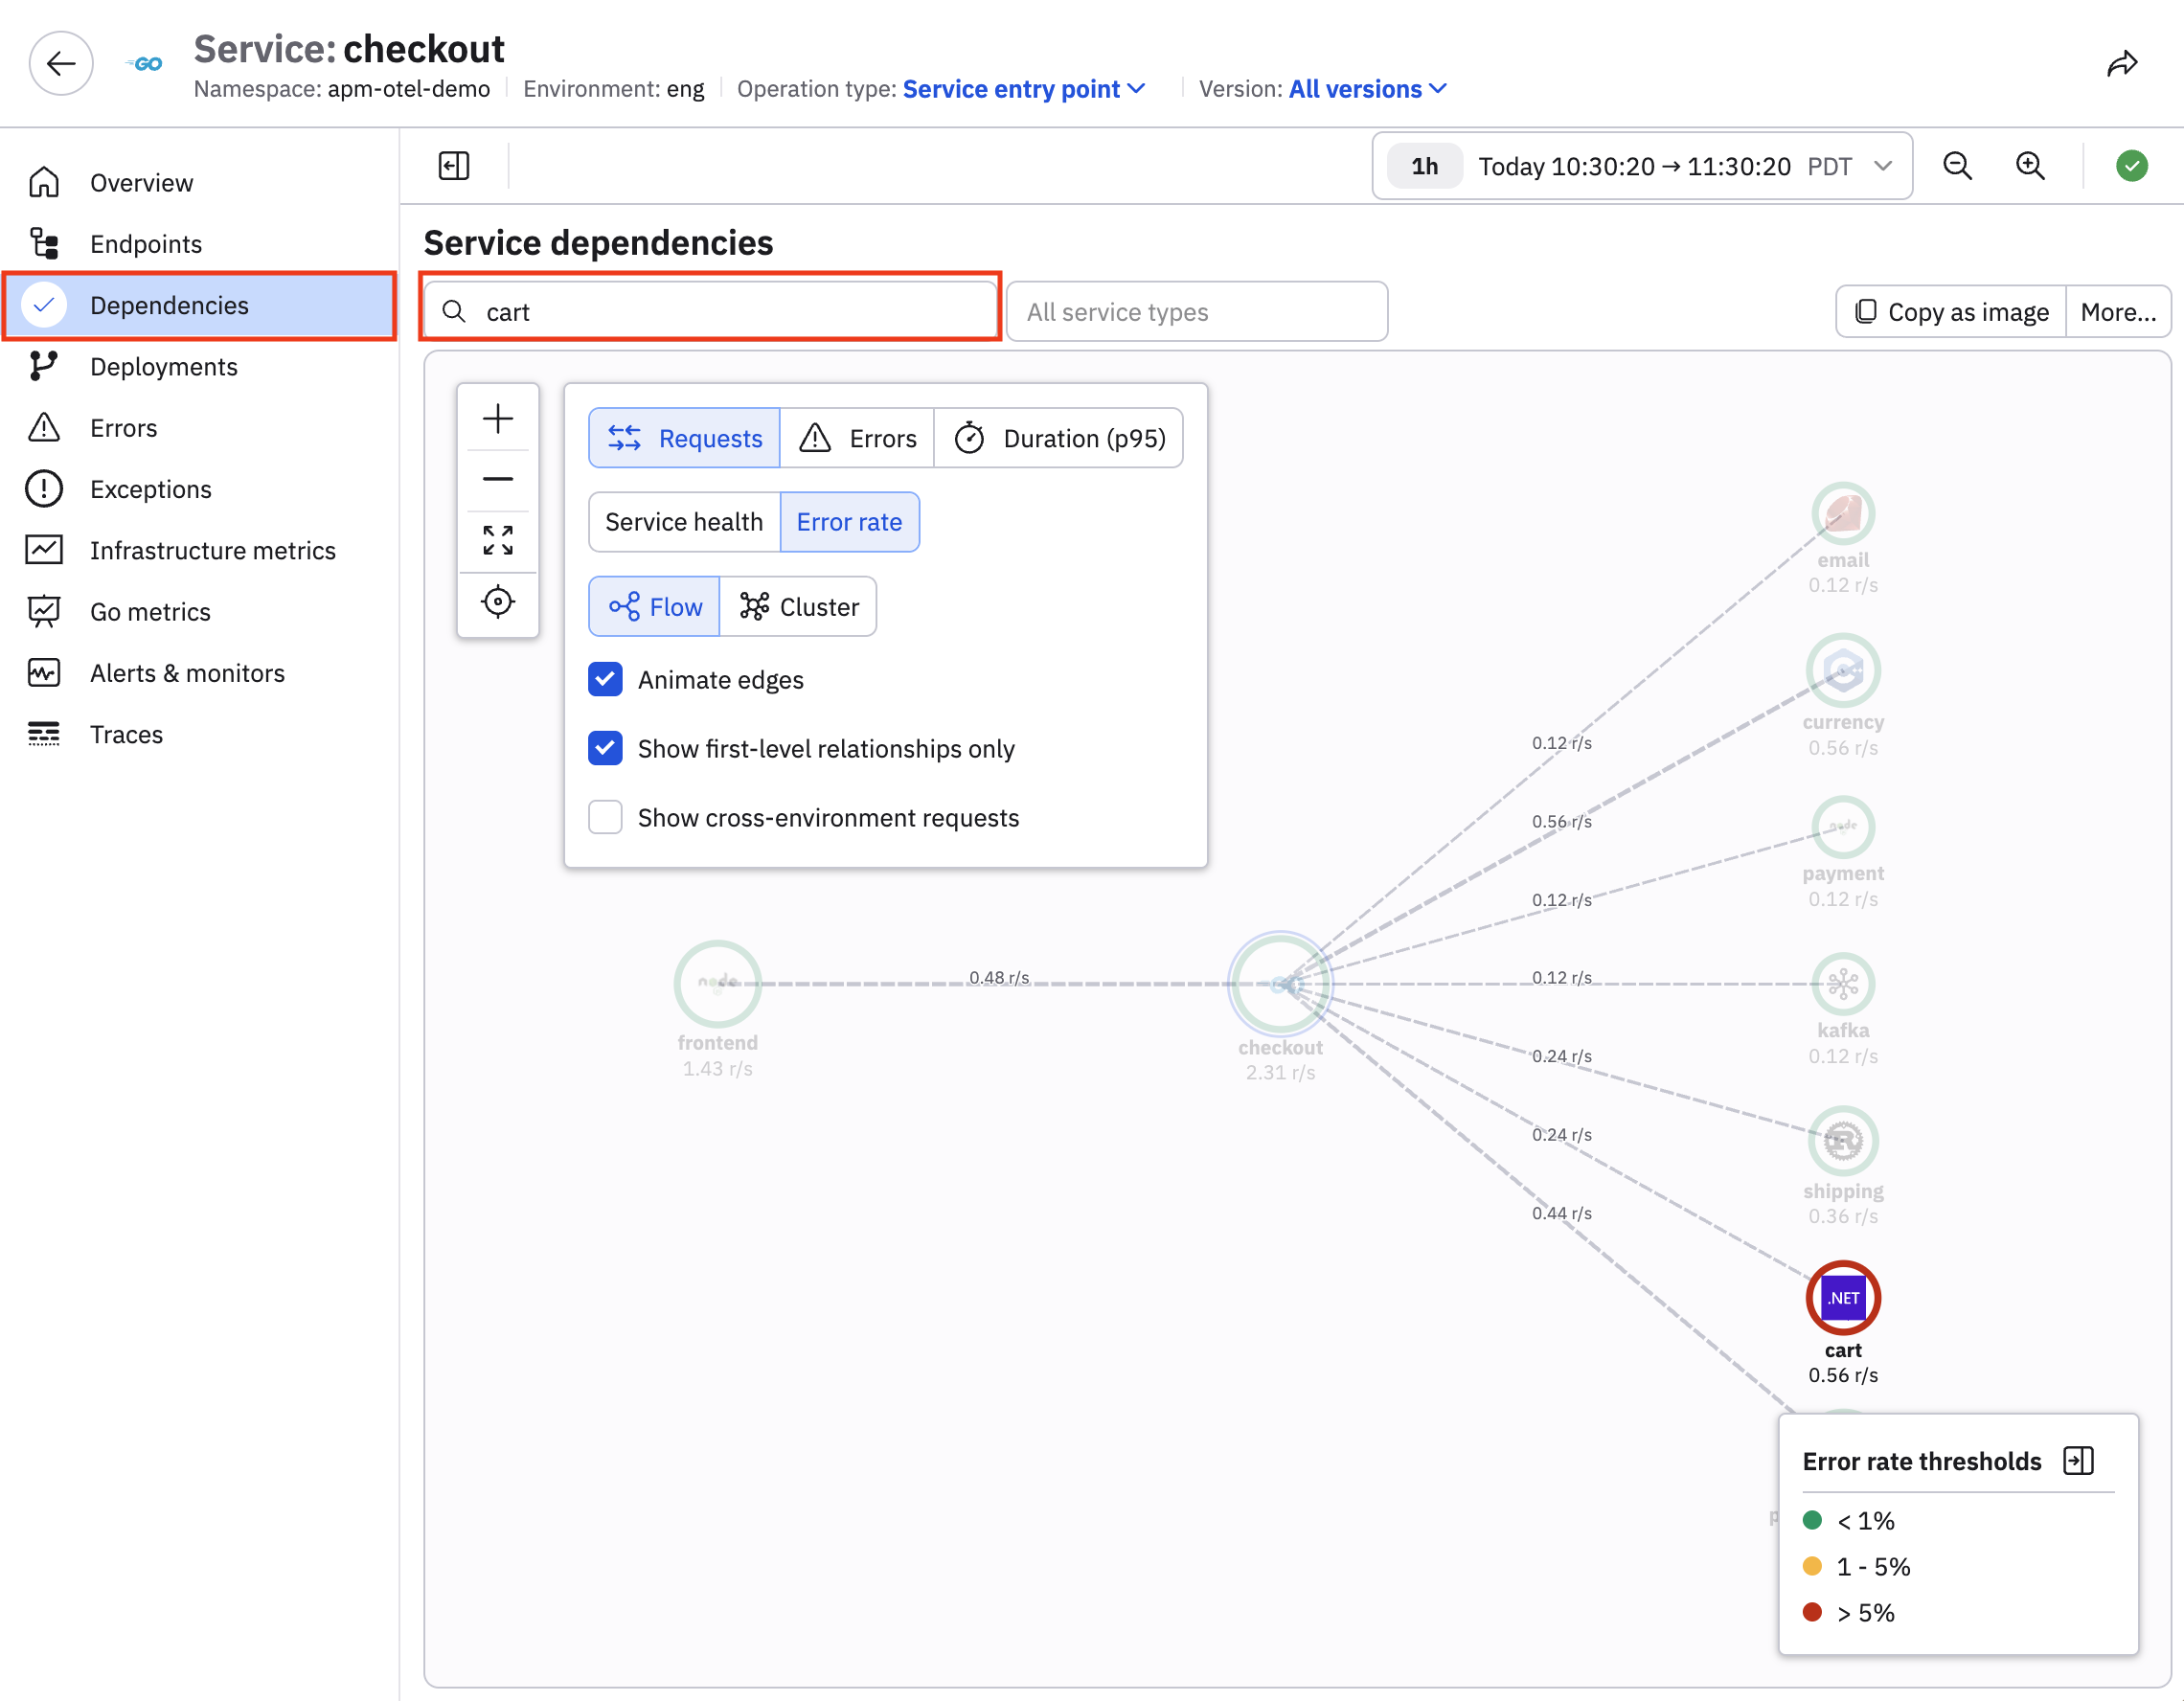
Click Dependencies and navigate to the downstream cart service from the service map for the checkout service. The edges of the service map are not red because no errors are currently being generated. But the red icon around the cart service does indicate an elevated error percentage.
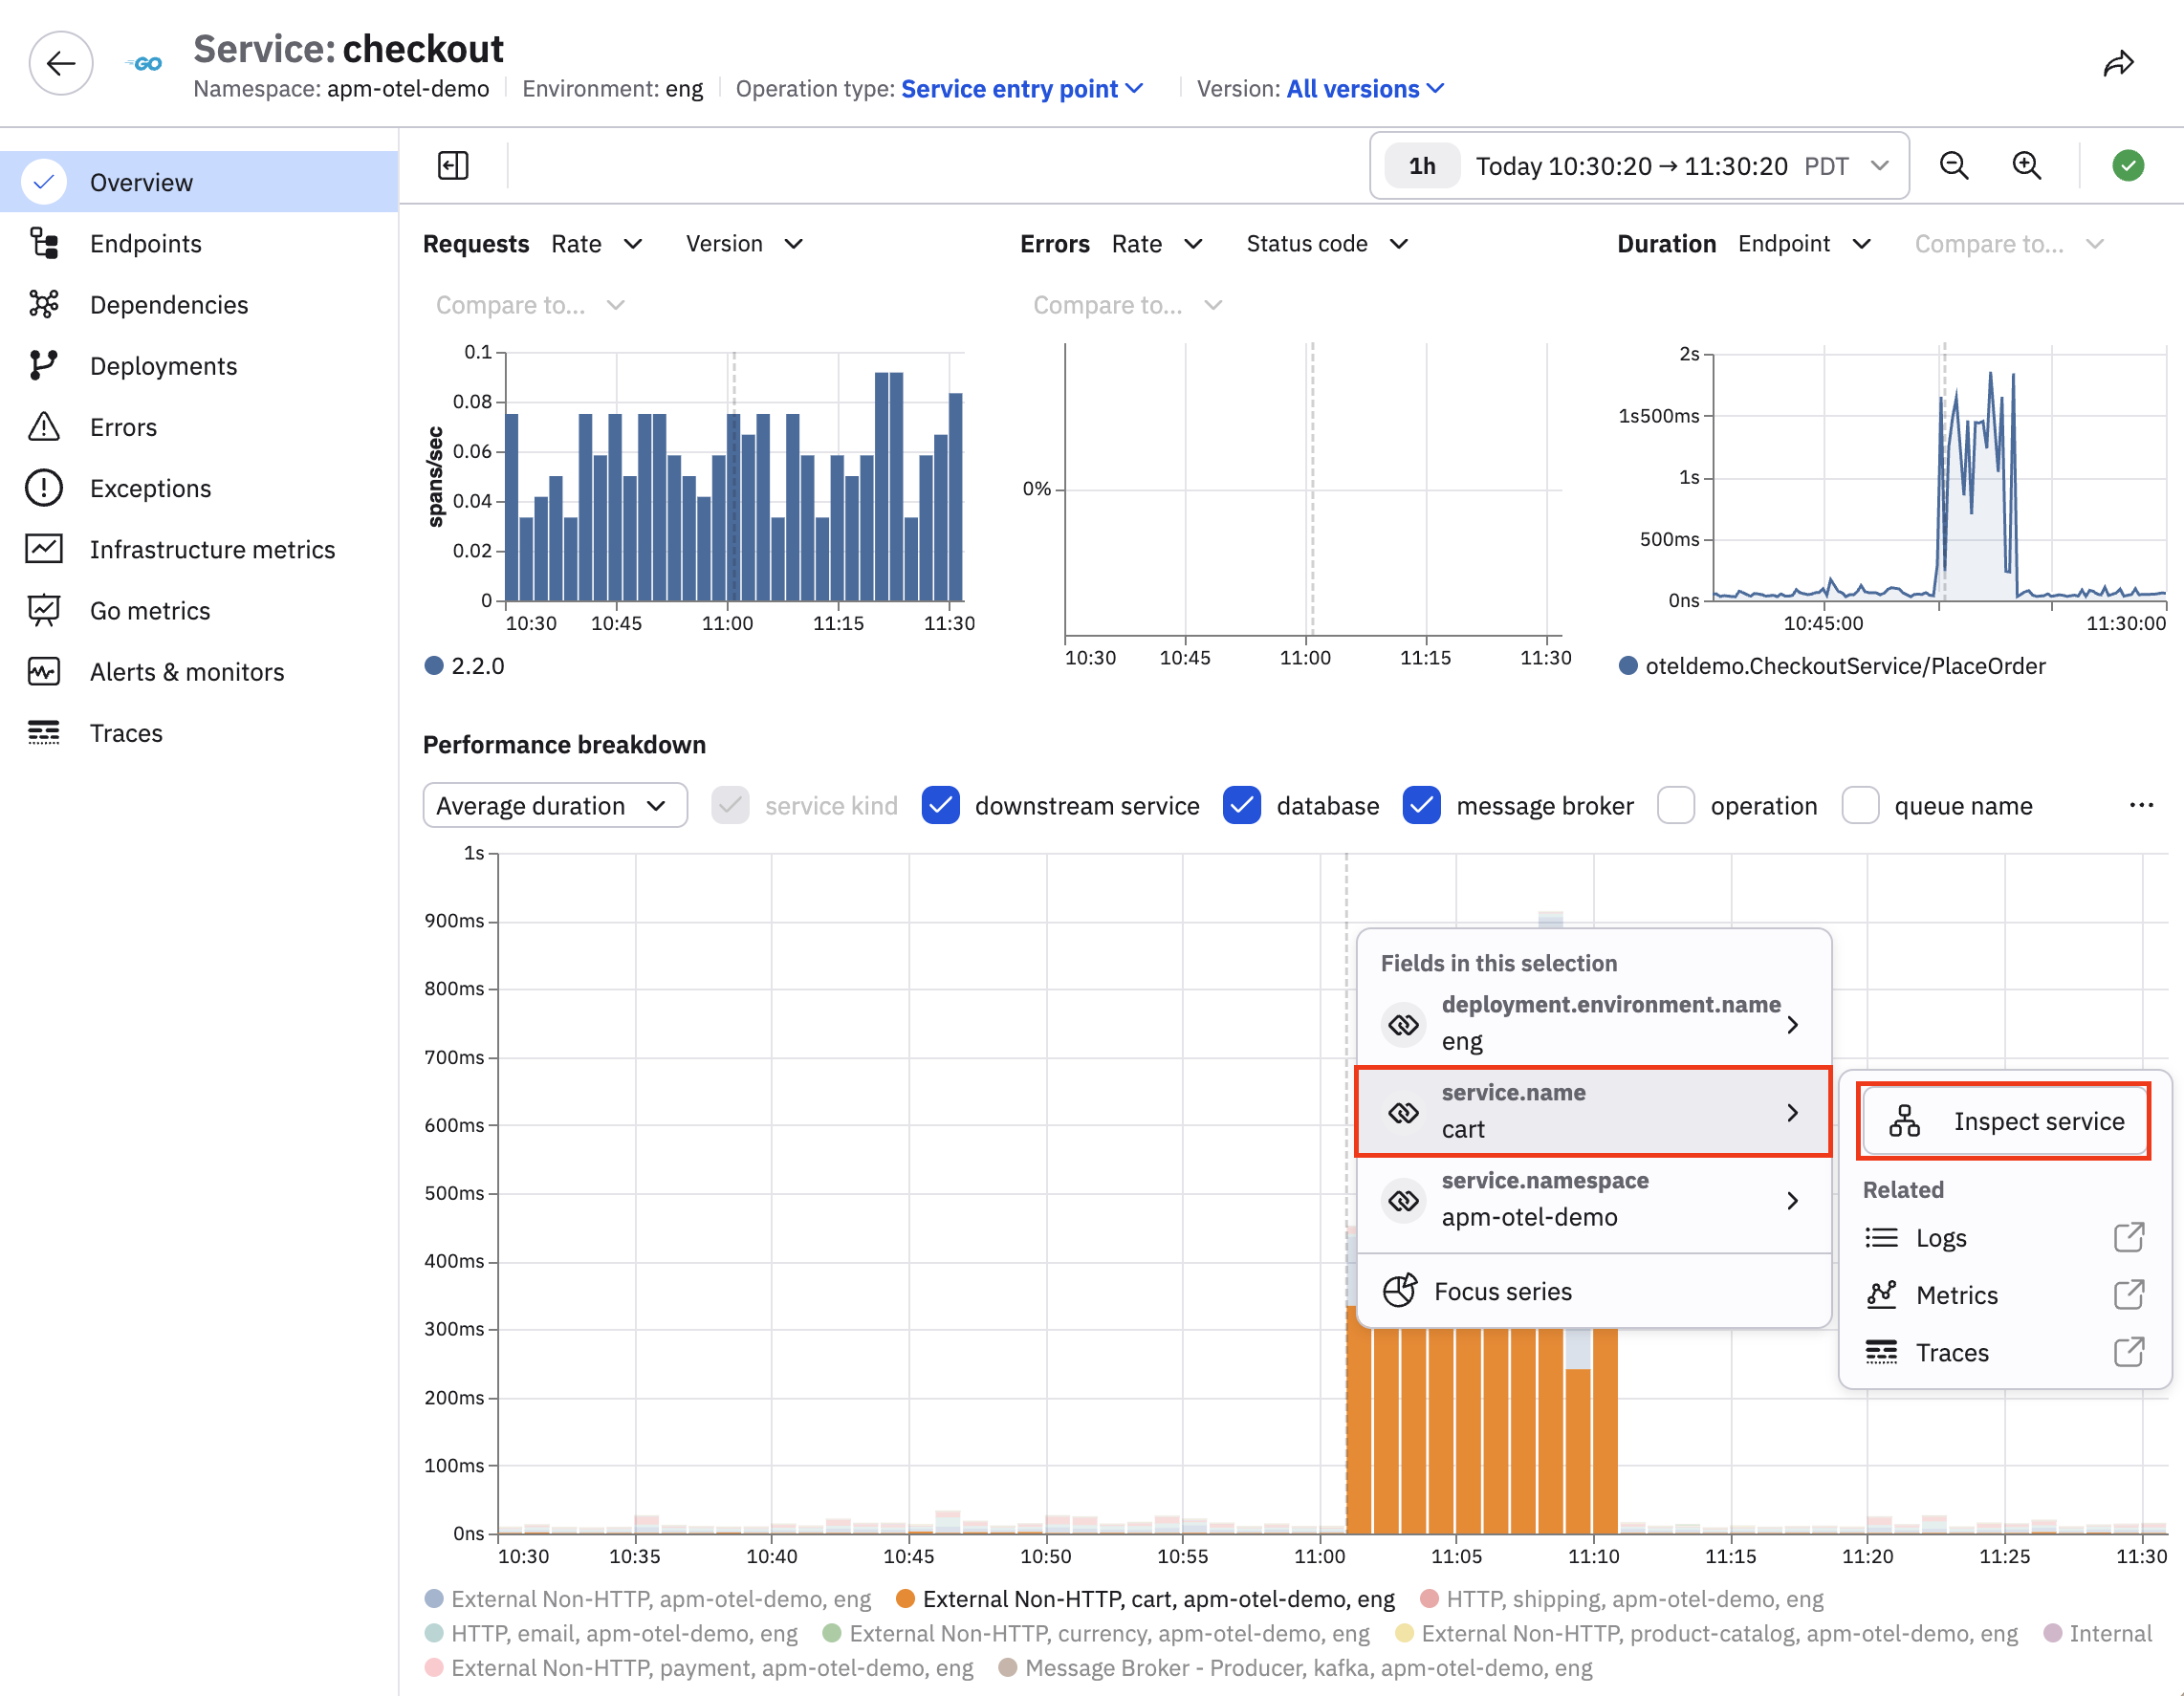
Returning to the overview, we can select the downstream cart service to begin further investigation. Click on the downstream service in the chart, then hover on cart, then click Inspect service.
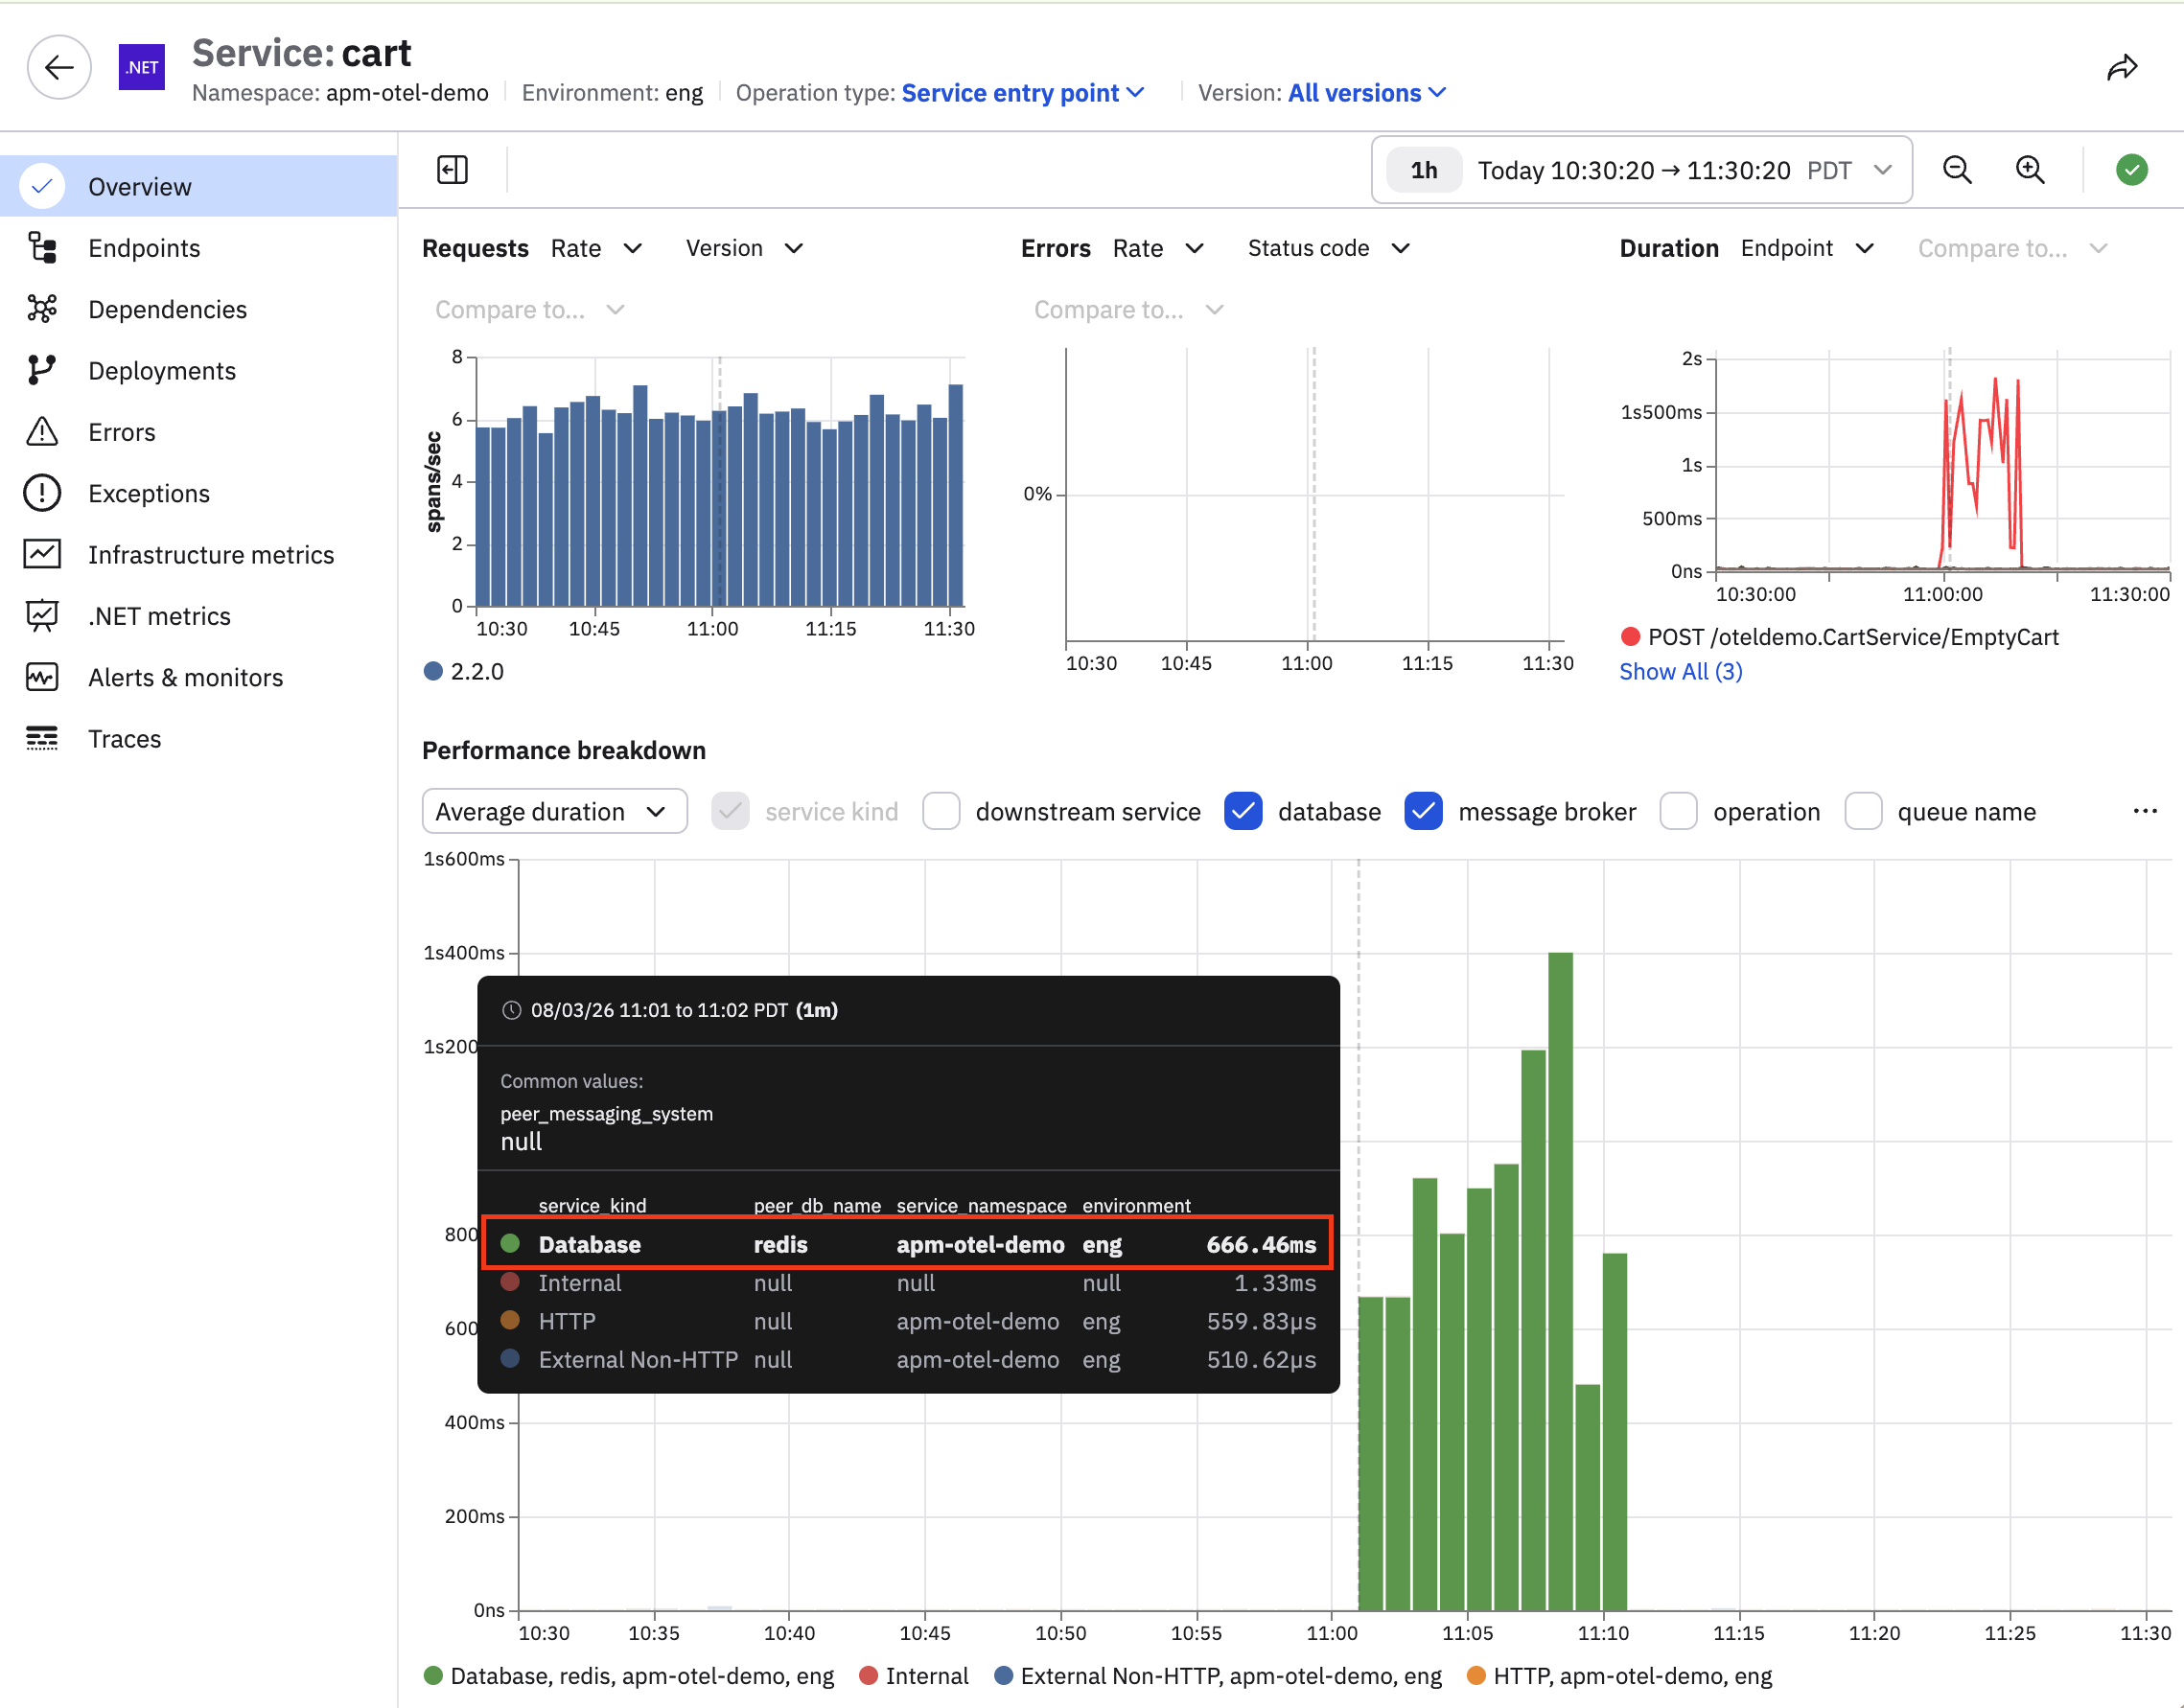
We can examine the new chart to see that most of the time is spent in Redis:
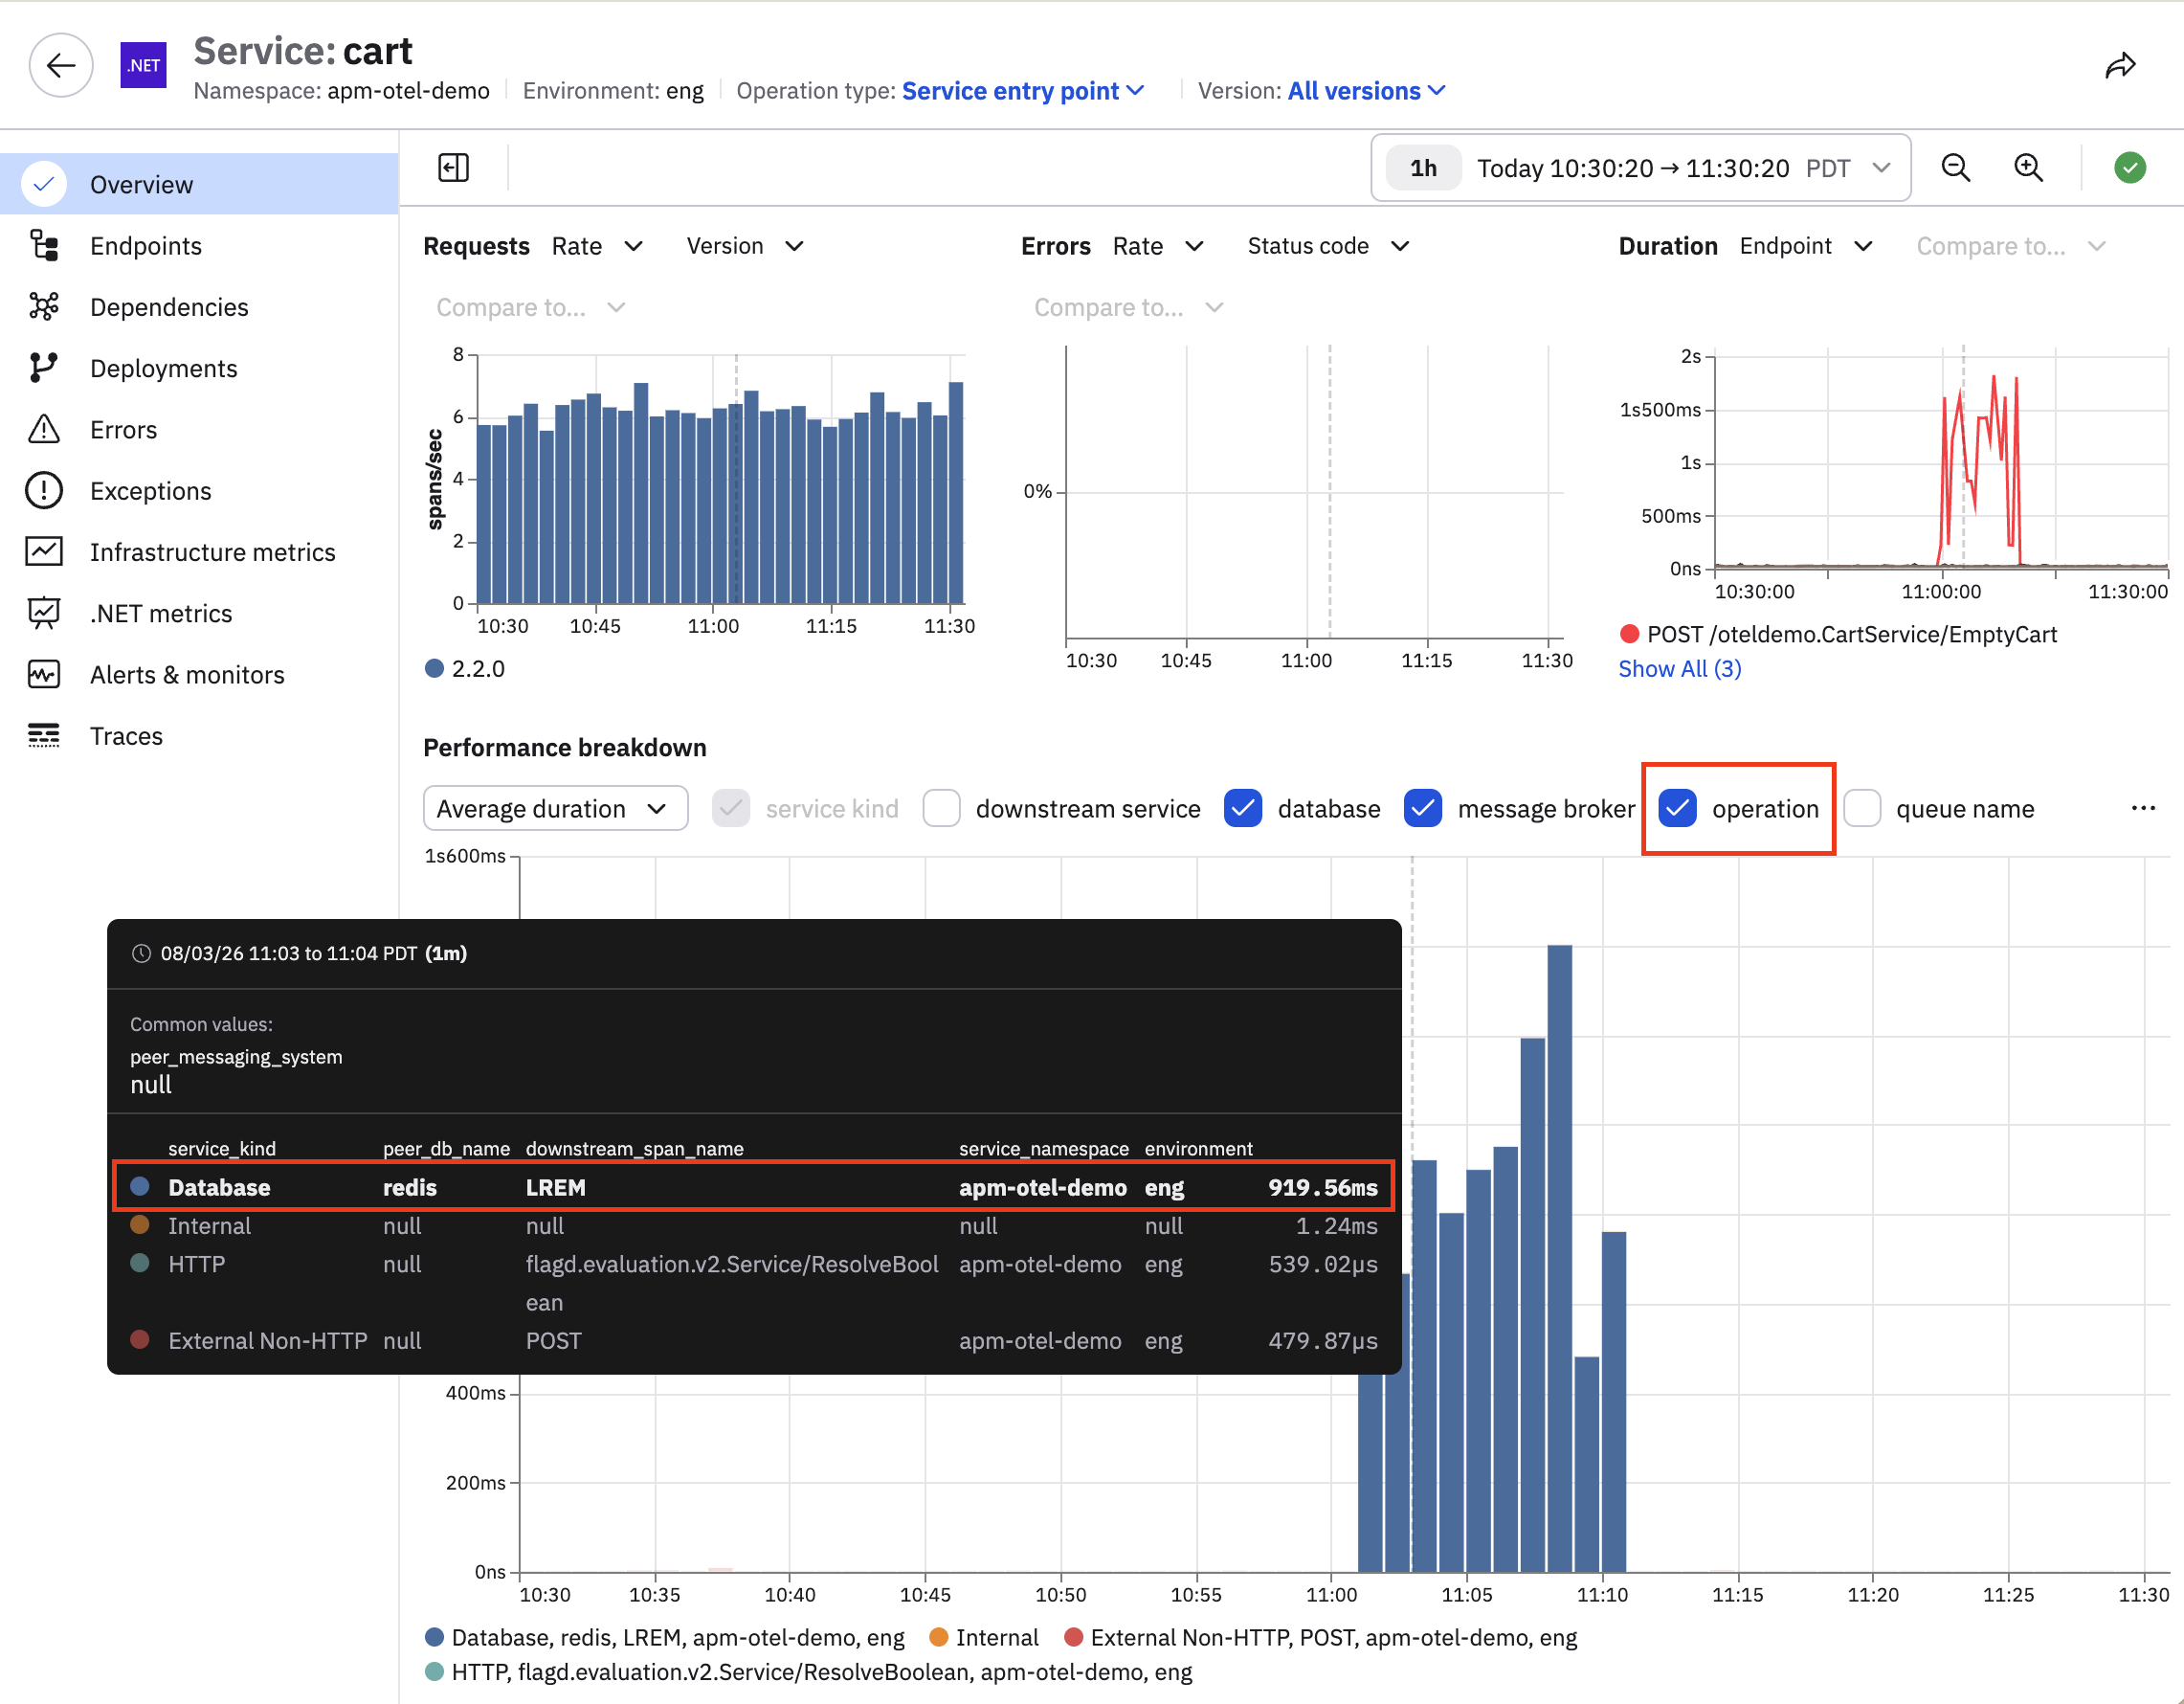
Add operation to the performance breakdown. Now we see that it's specifically the LREM operation in Redis that's causing the latency:
Now click Endpoints to narrow down the degradation further to a single endpoint, namely the EmptyCart endpoint in the cart service, which had a recent spike in latency.
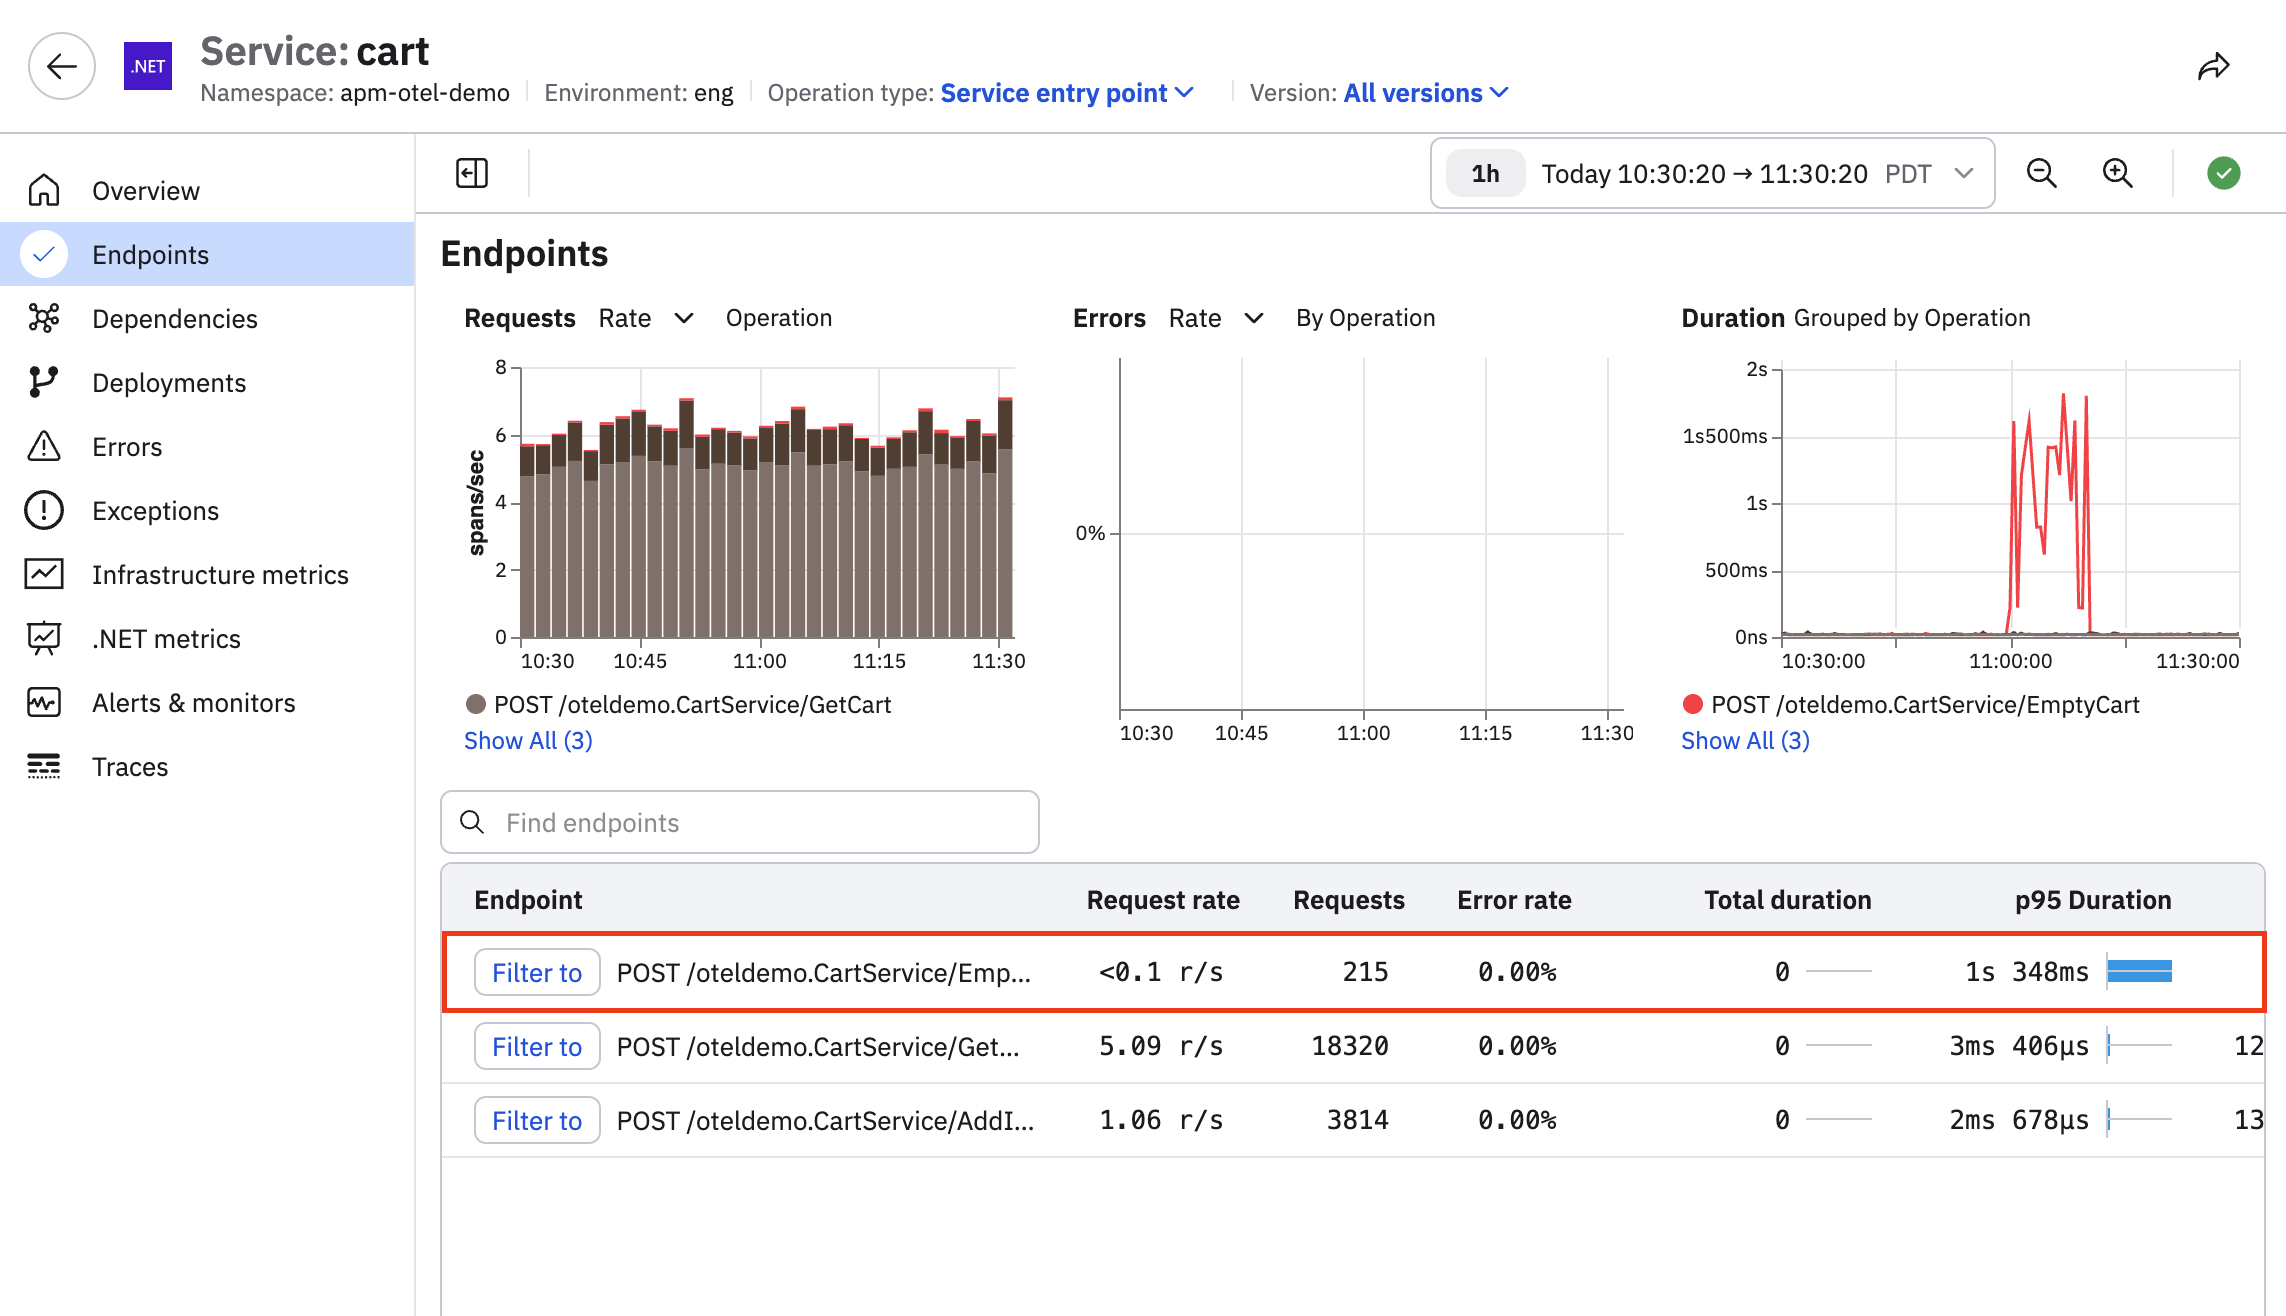
The performance breakdown of the EmptyCart endpoint reveals that the latency spike can be explained by LREM operations in Redis, which means we've narrowed down the issue to just this endpoint.
It's time to look at slow traces for the EmptyCart endpoint. The Traces tab in the endpoint inspector is automatically filtered to show the slowest traces. Click Filter to, then click the Traces tab in the side panel:
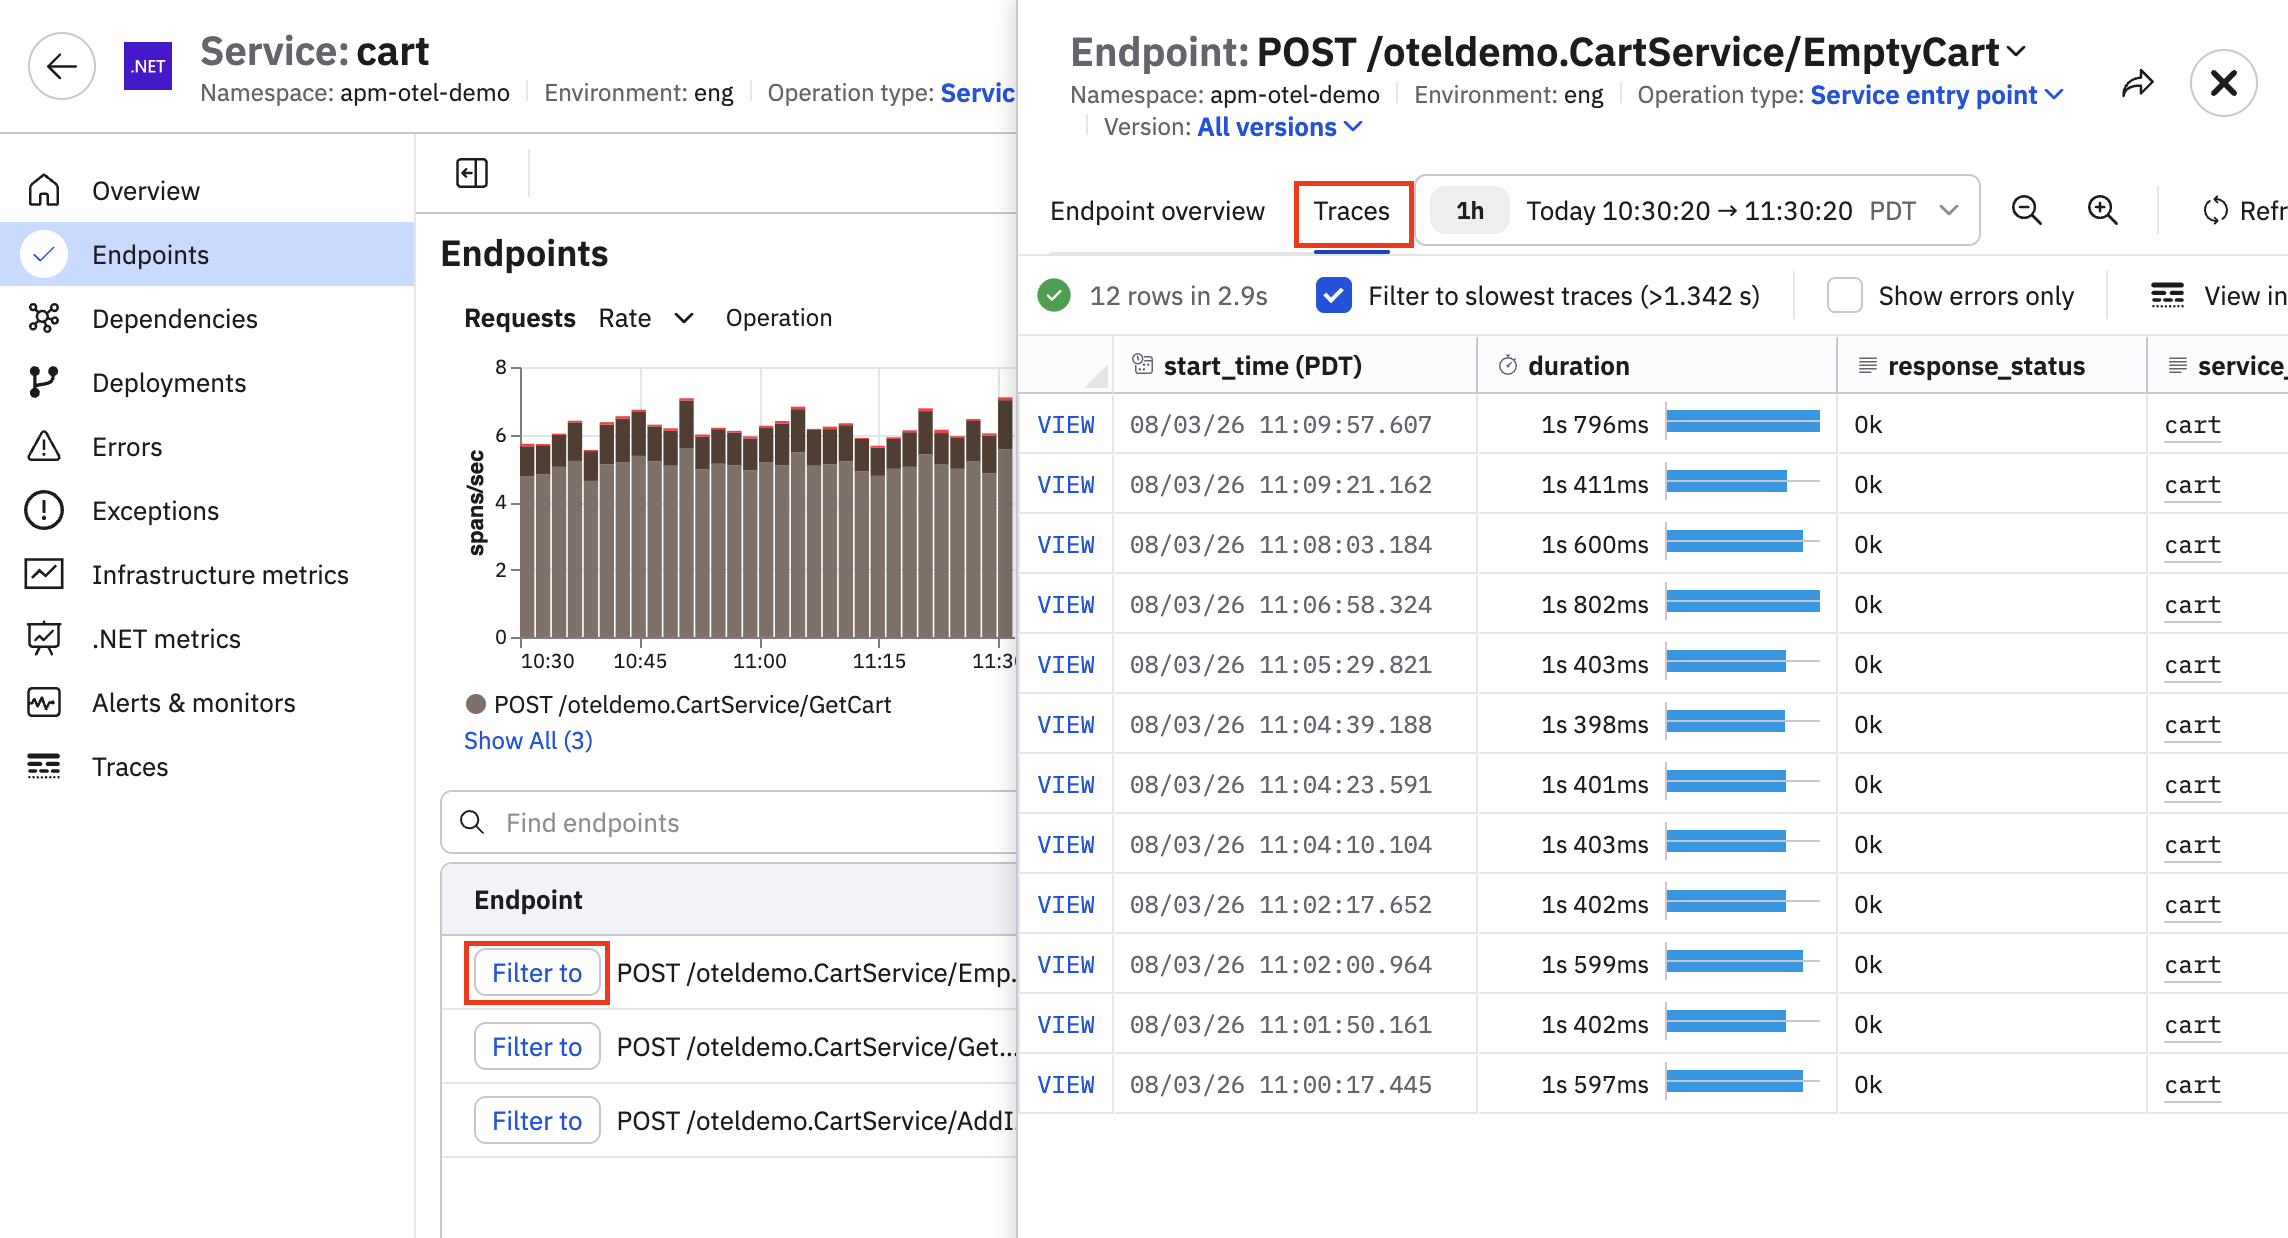
Click View for any of the traces with a lengthy duration.
The waterfall shows a lot of LREM calls, a telltale sign of an n+1 issue.
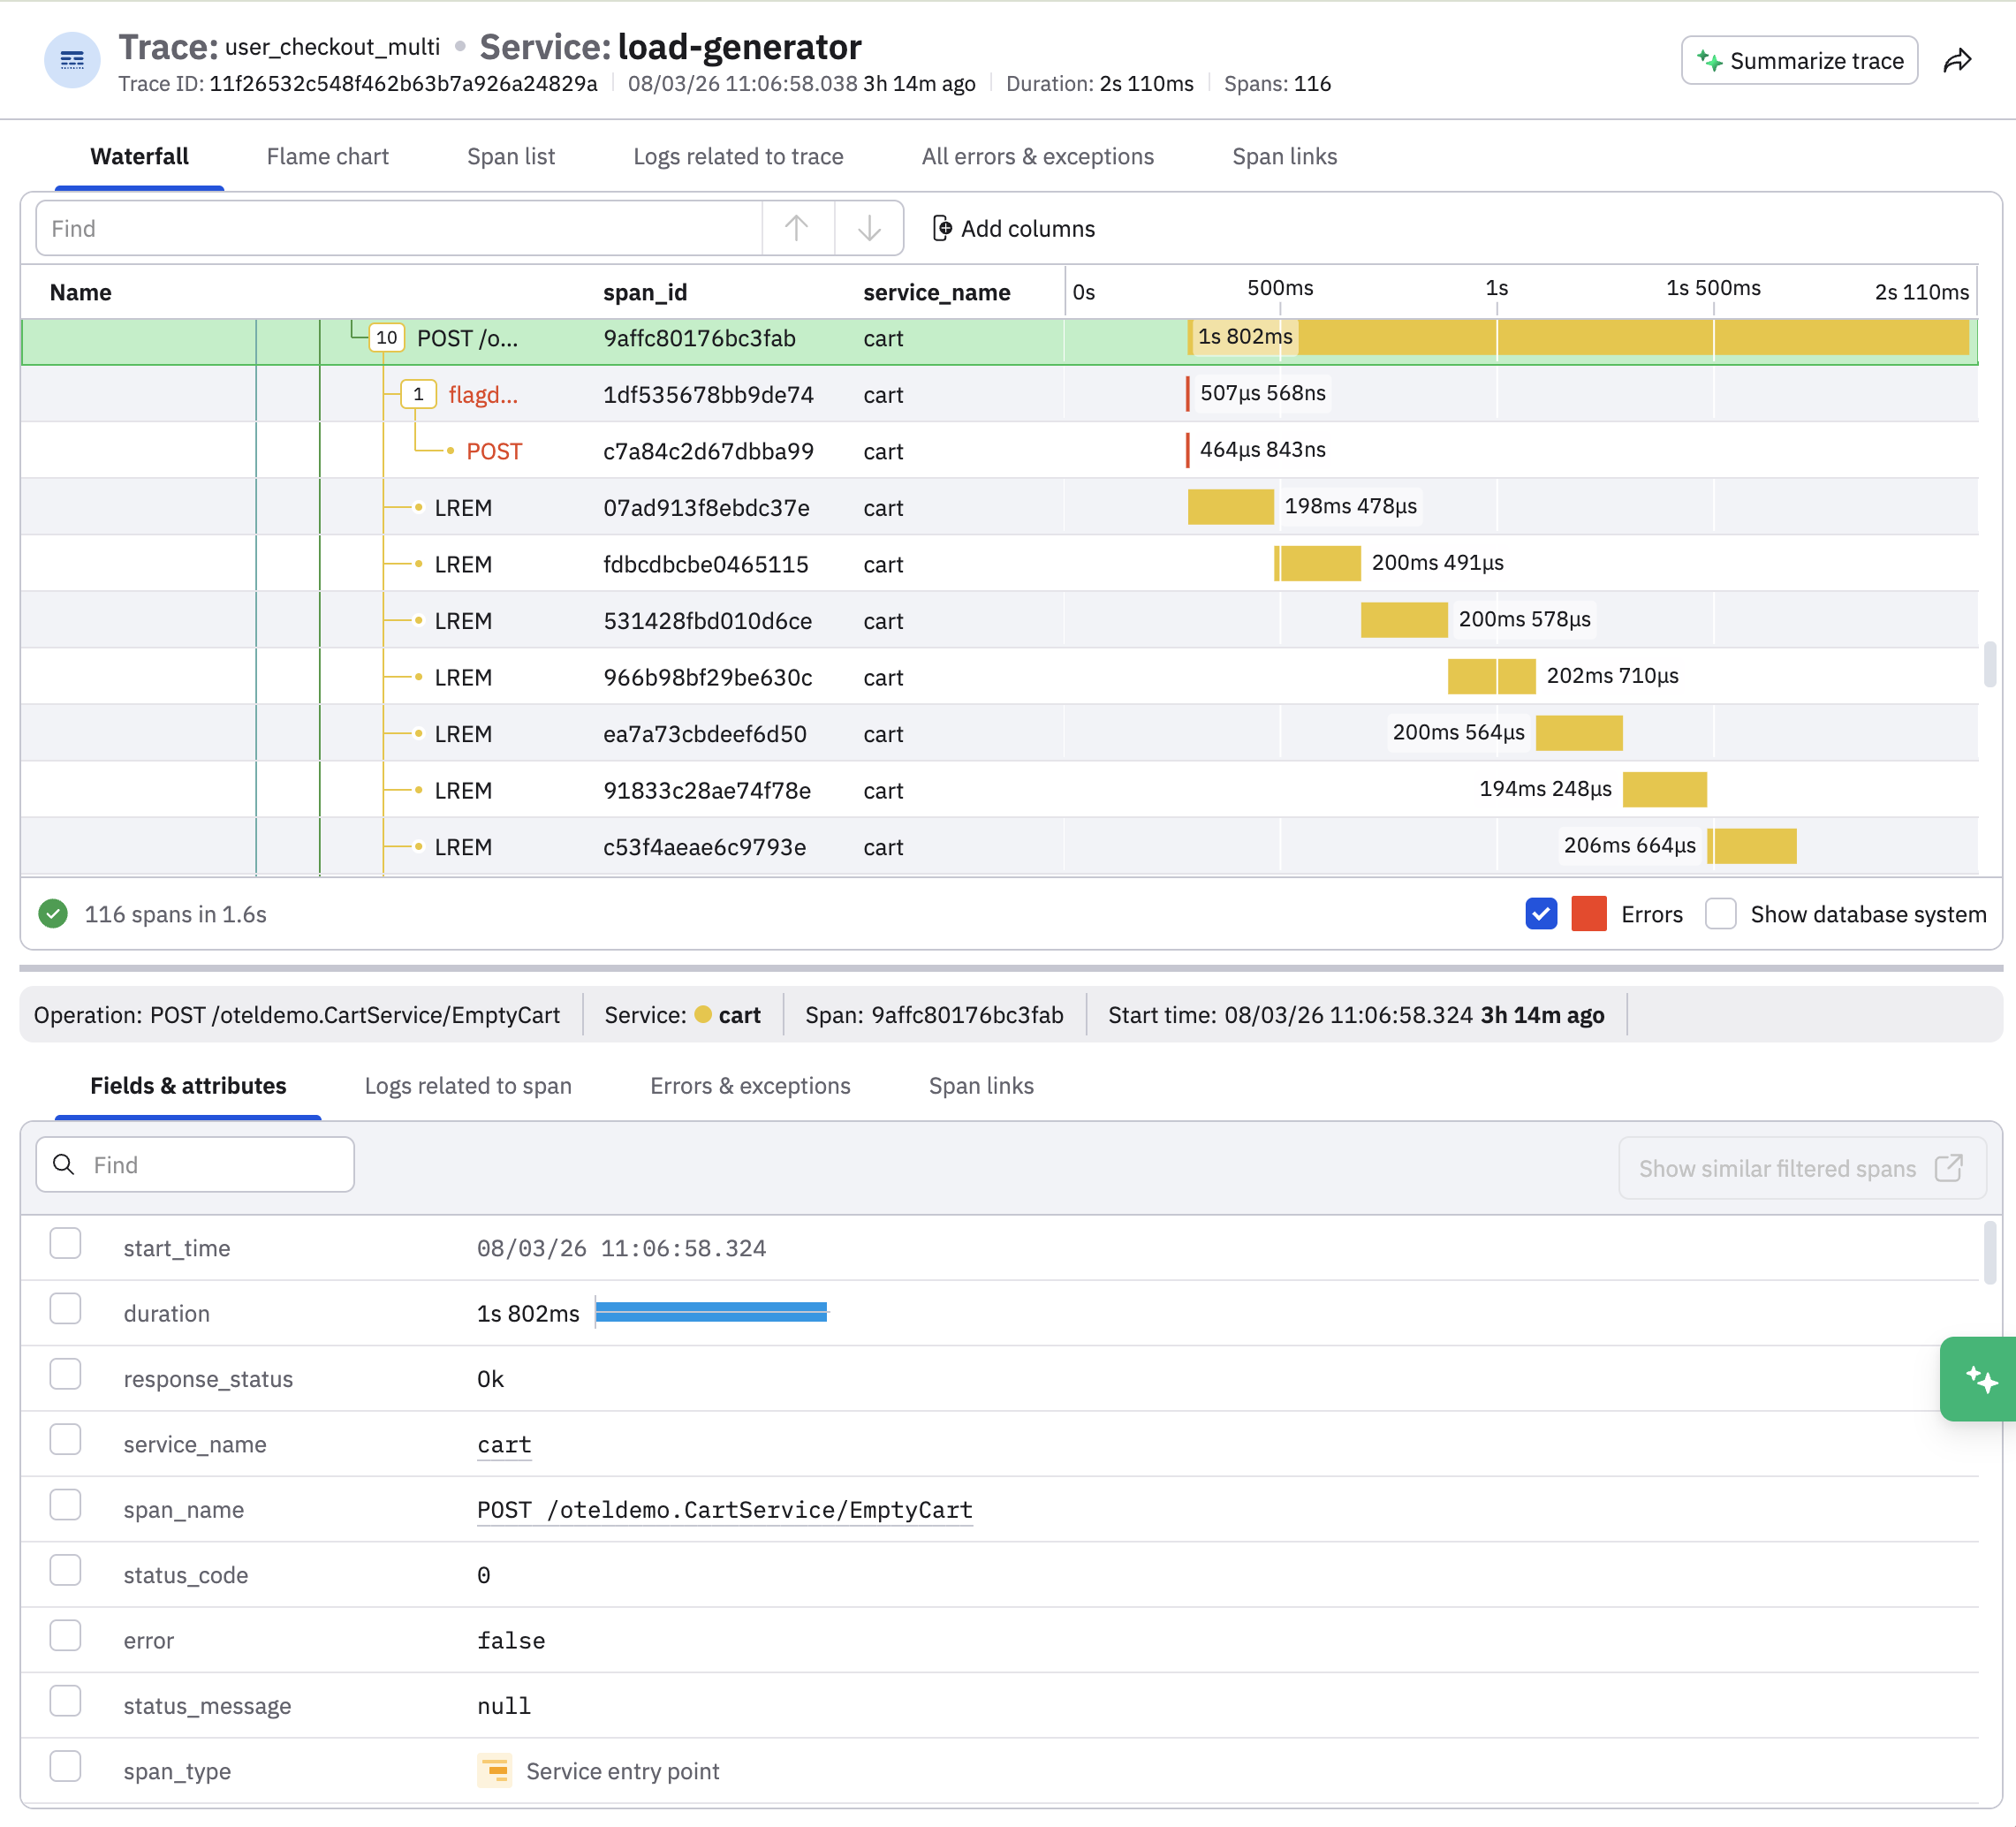
Select one of the LREM spans to inspect the attributes on these LREM calls to see the specific queries being issued:
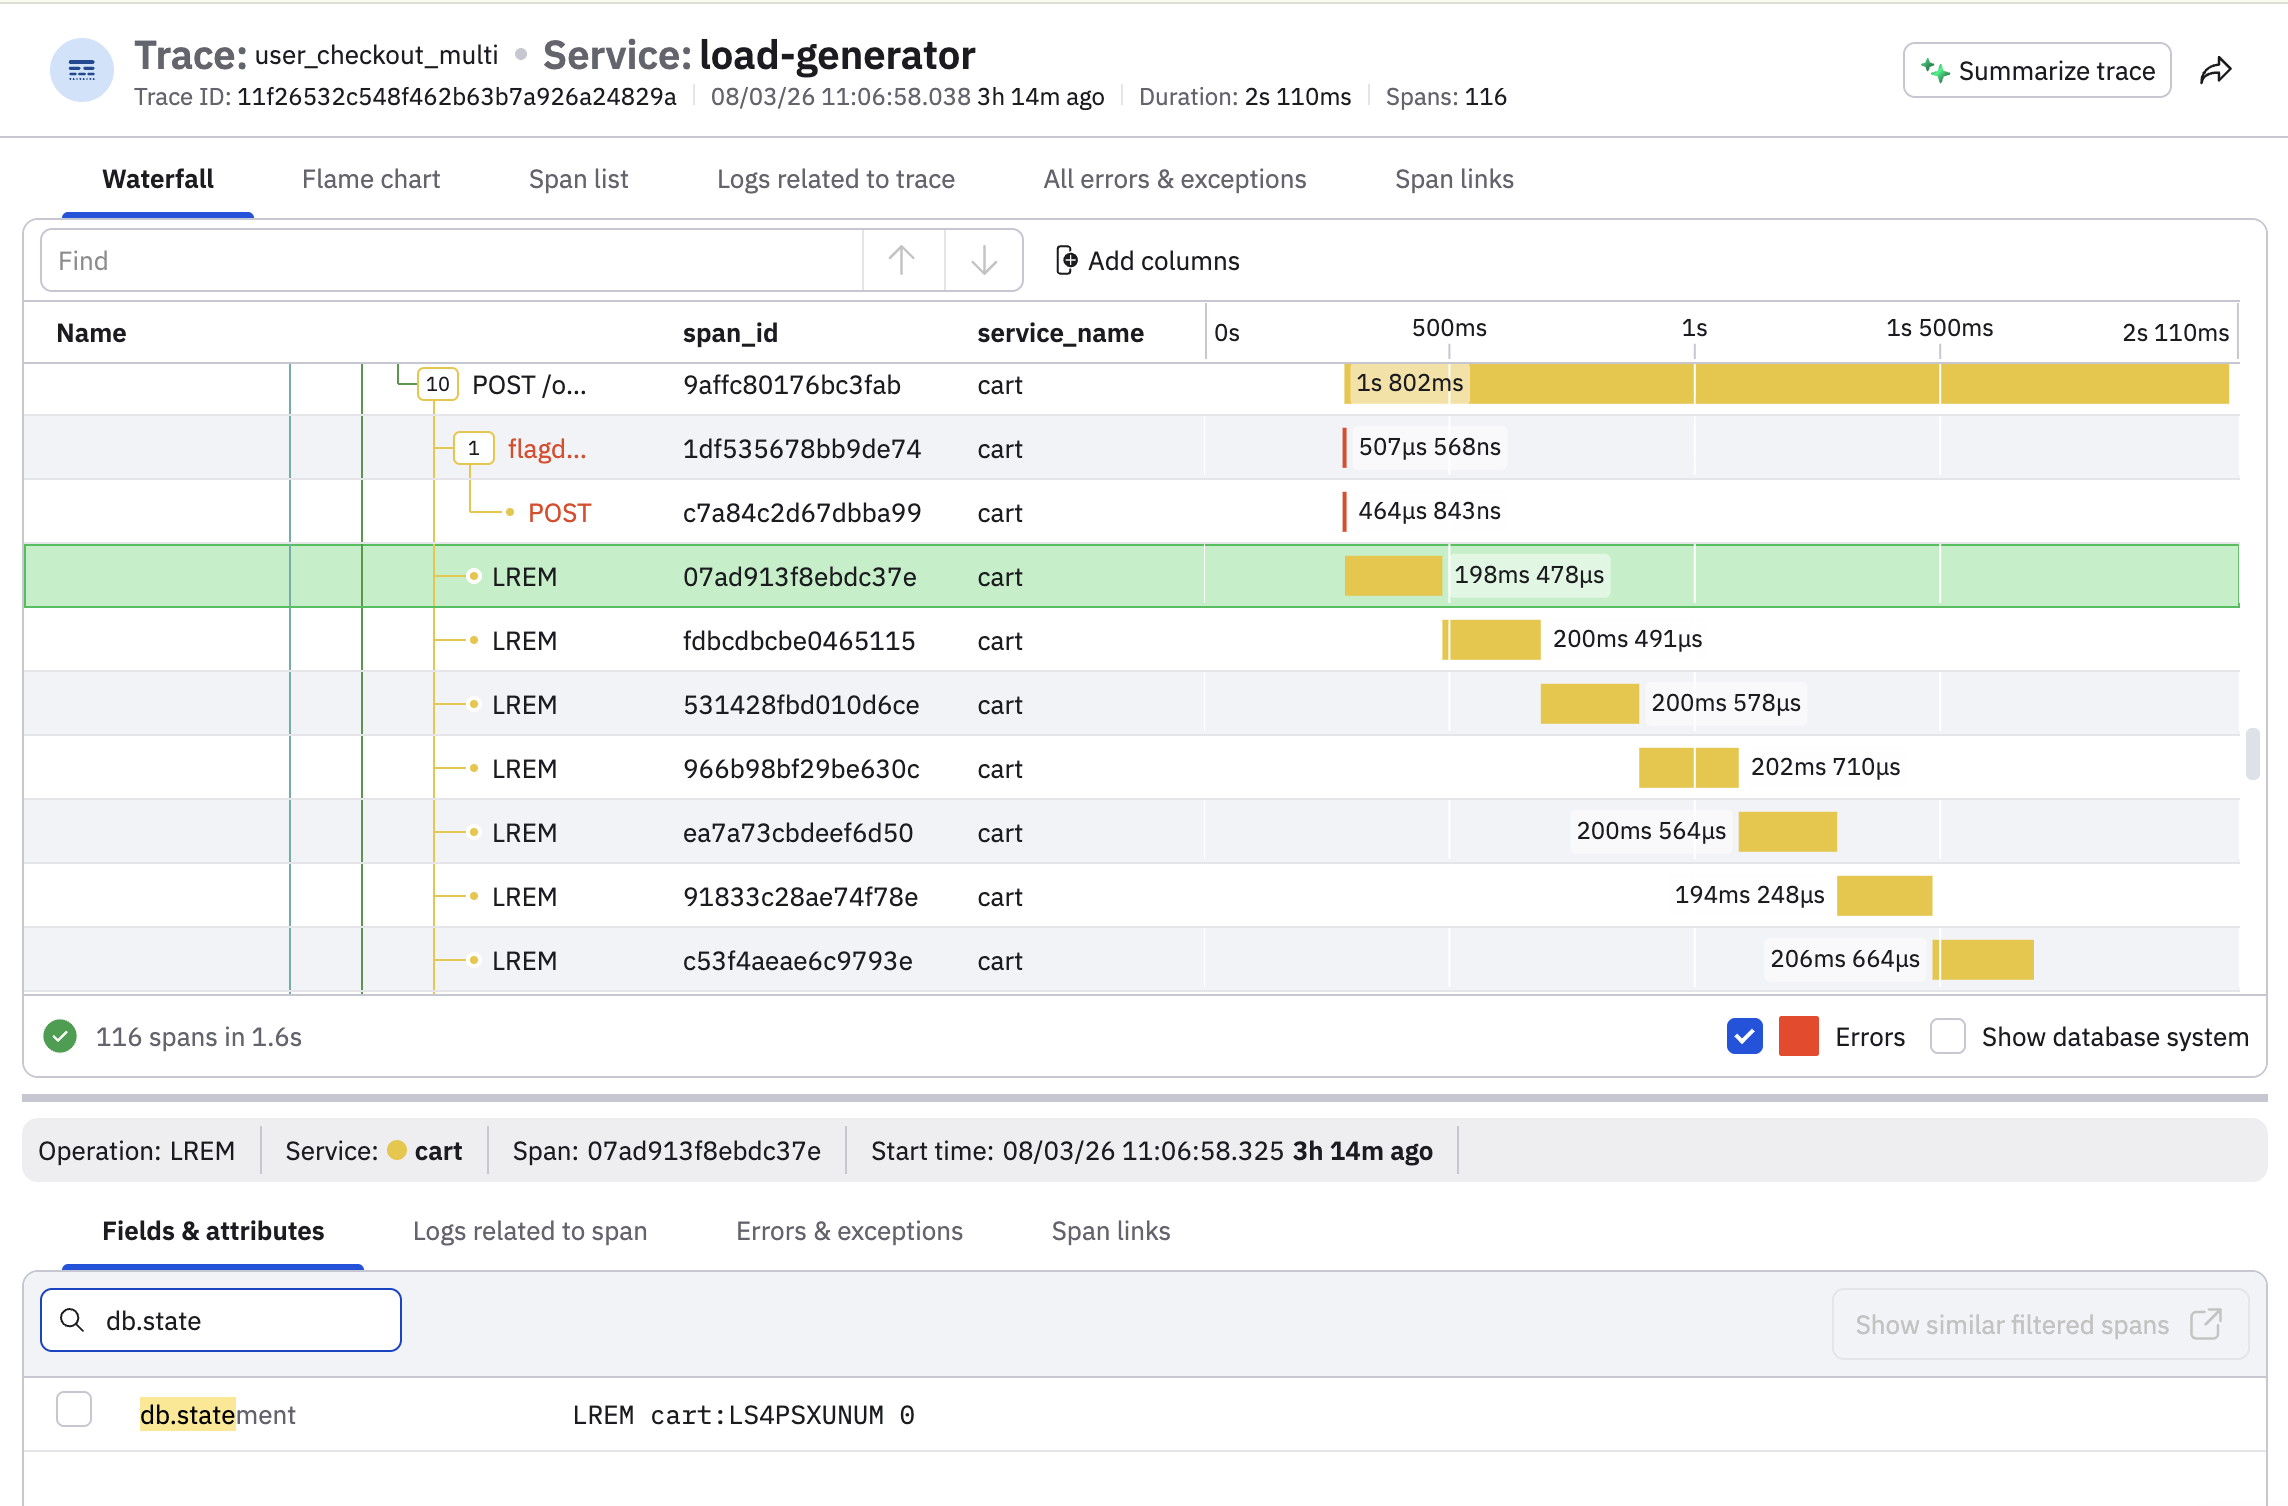
Now we have enough information to conclude what caused the latency spike in the checkout service: when users empty their cart, the frontend calls the checkout service, which calls the EmptyCart endpoint in the cart service, which runs a database query for each individual cart item, a classic n+1 scenario. The fix is simple: update the logic in this endpoint so it removes all the cart items in a single query.
Updated about 1 month ago