Track user activity with audit trails
This page describes Observe audit logs for CRUD operations.
As an administrator, you can use enable the audit trail to understand who is using Observe within your organization and what actions they are performing. See What is audited? for a summary of the objects and actions audited by Observe.
Using audit logs, you can understand changes in your Observe tenant, such as:
- A dashboard or Monitor is now broken and needs to be fixed, due to a change in the input Dataset. Who modified the input Dataset, and when?
- An alert never went out during my on-call shift, because a Monitor was disabled. Who disabled the Monitor, and when?
For security teams, audit trail events help with compliance checks and maintaining audit trails of who did what, and when, for your Observe resources. For example, maintaining an audit trail:
- When someone changes the access controls on a Dataset, providing too much access.
- For user logins, account, or role changes in your organization.
This audit trail can be exported to cloud object storage via the Observe Data Export feature, where your compliance requirements for retention are beyond your Observe retention, or for analysis by your SIEM.
What is audited?
The following table shows the Observe objects that are audited, and specifically the actions audited for each object:
| Object Type | Create | Read | Update | Delete | Disable | Enable |
|---|---|---|---|---|---|---|
| Dataset | ✓ | ✓ | ✓ | ✓ | ||
| Dataset query filters | ✓ | ✓ | ✓ | ✓ | ✓ | ✓ |
| Monitor | ✓ | ✓ | ✓ | ✓ | ✓ | ✓ |
| Worksheet | ✓ | ✓ | ✓ | ✓ | ||
| Dashboard | ✓ | ✓ | ✓ | ✓ | ||
| Datastream | ✓ | ✓ | ✓ | ✓ | ||
| Reference table | ✓ | ✓ | ✓ | ✓ | ||
| Datastream token | ✓ | ✓ | ✓ | ✓ | ✓ | ✓ |
| API token | ✓ | ✓ | ✓ | ✓ | ✓ | |
| User | ✓ | ✓ | ✓ | ✓ | ✓ | ✓ |
| Service account | ✓ | ✓ | ✓ | ✓ | ✓ | ✓ |
| Report | ✓ | ✓ | ✓ | ✓ | ✓ | ✓ |
| RBAC statement | ✓ | ✓ | ✓ | |||
| RBAC group | ✓ | ✓ | ✓ | |||
| RBAC group member | ✓ | ✓ | ||||
| Drop filter | ✓ | ✓ | ✓ | ✓ | ✓ | ✓ |
| Document | ✓ | ✓ | ✓ | ✓ | ||
| Data export job | ✓ | ✓ | ✓ |
In addition, login and logout logs are also audited, including the login type, such as SAML or local, and whether the login attempt was successful or not. These logs are not associated with any Observe objects.
Enable audit logging
You can enable audit logging in your Observe instance settings. See Instance settings.
Configuration
Observe Usage Reporting app
Observe bundles the usage/Audit Events Dataset with the Observe Usage Reporting app focused on capturing audit trail data. You can also control access to the audit trail by adding access controls to the System datastream/root Dataset as well as the usage/Audit Events Dataset. You must be on version 0.22.0 or higher of the Observe Usage Reporting app to take advantage of this content.
Archive your audit trail
Archiving is an optional feature for the audit trail. You can use archiving to write to Amazon S3 and have your SIEM system read events from it, or store them for compliance reasons. Note that Data Export is currently in public preview.
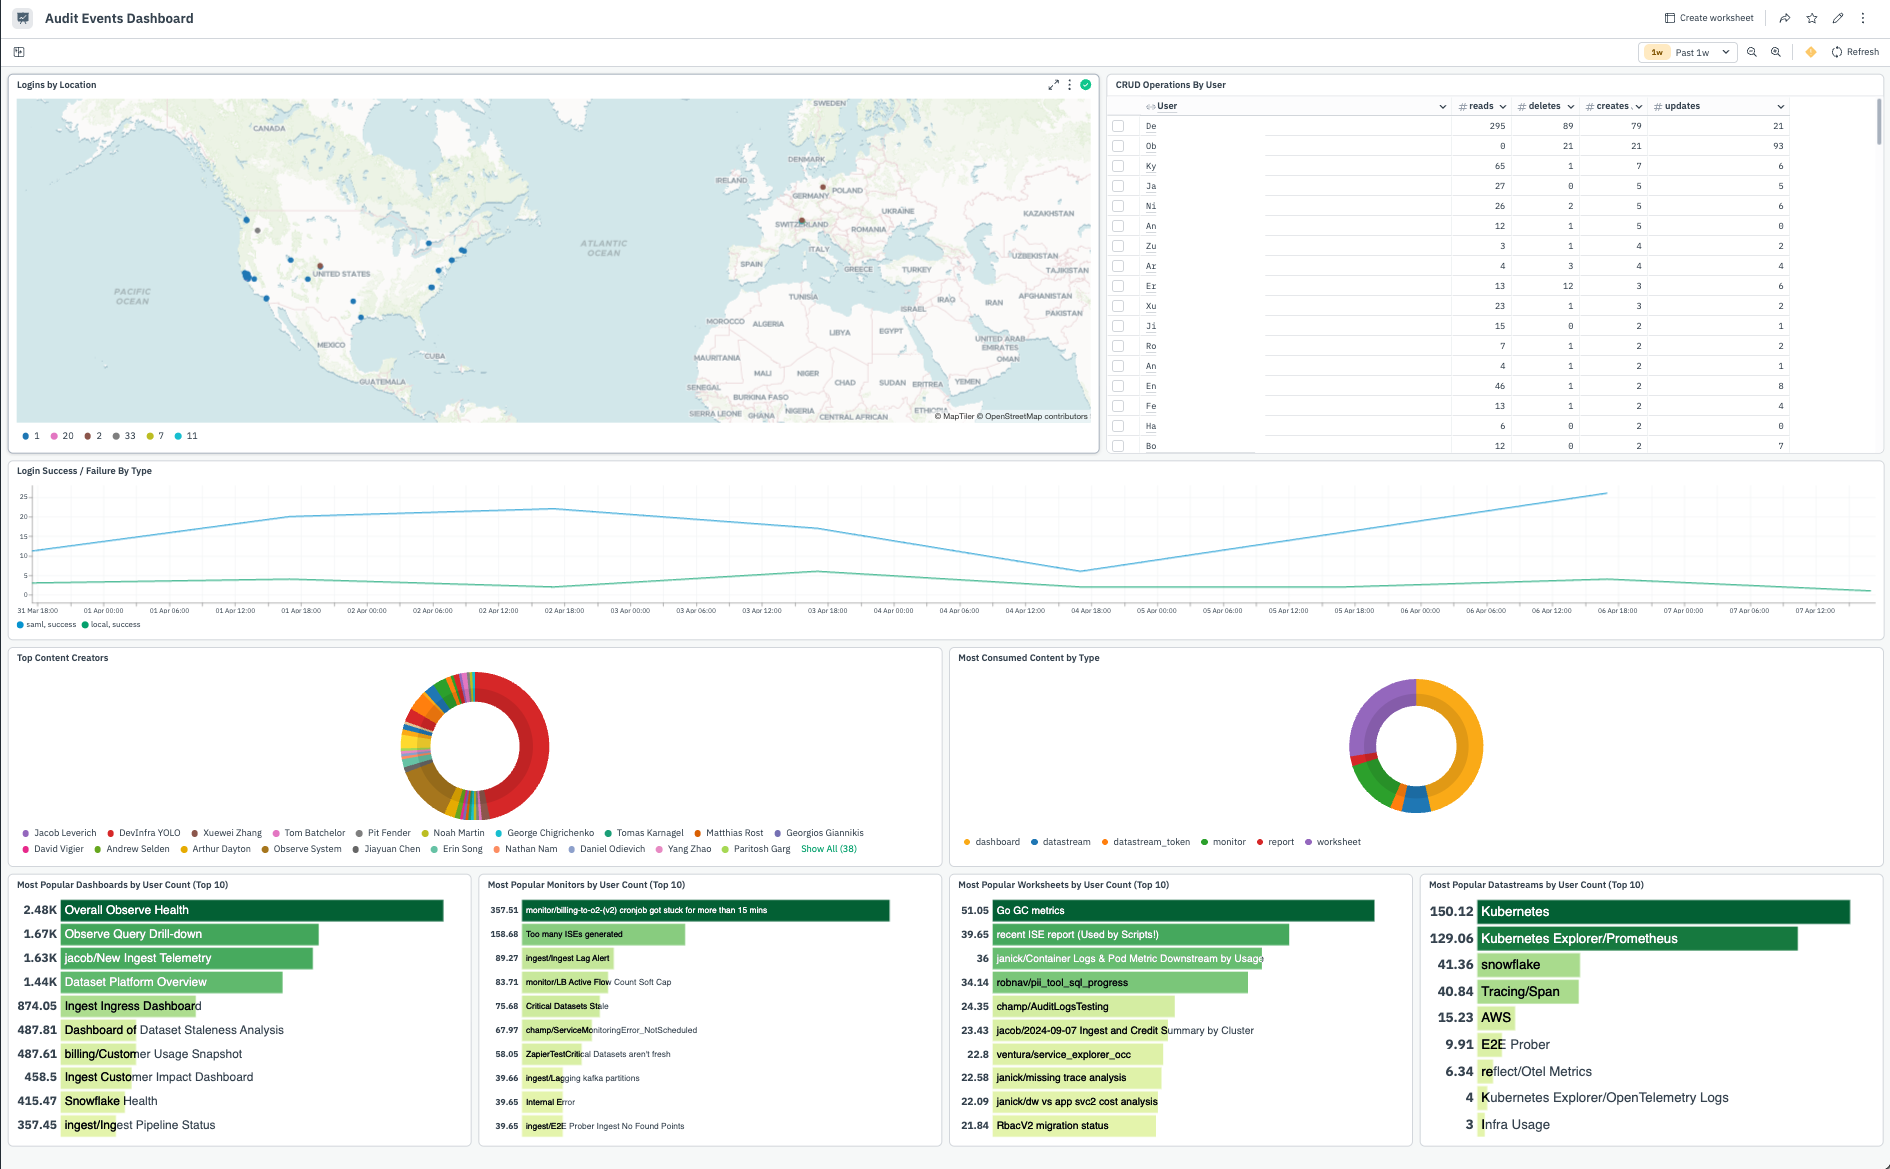
Explore audit events
The Observe Usage Reporting app now bundles audit trail content.
Audit Events dashboard: This dashboard provides examples for monitoring authentication events, overall CRUD operations per user, as well as content popularity.
usage/Audit Events Dataset: This Dataset enriches the raw audit data in the System Datastream with user information.
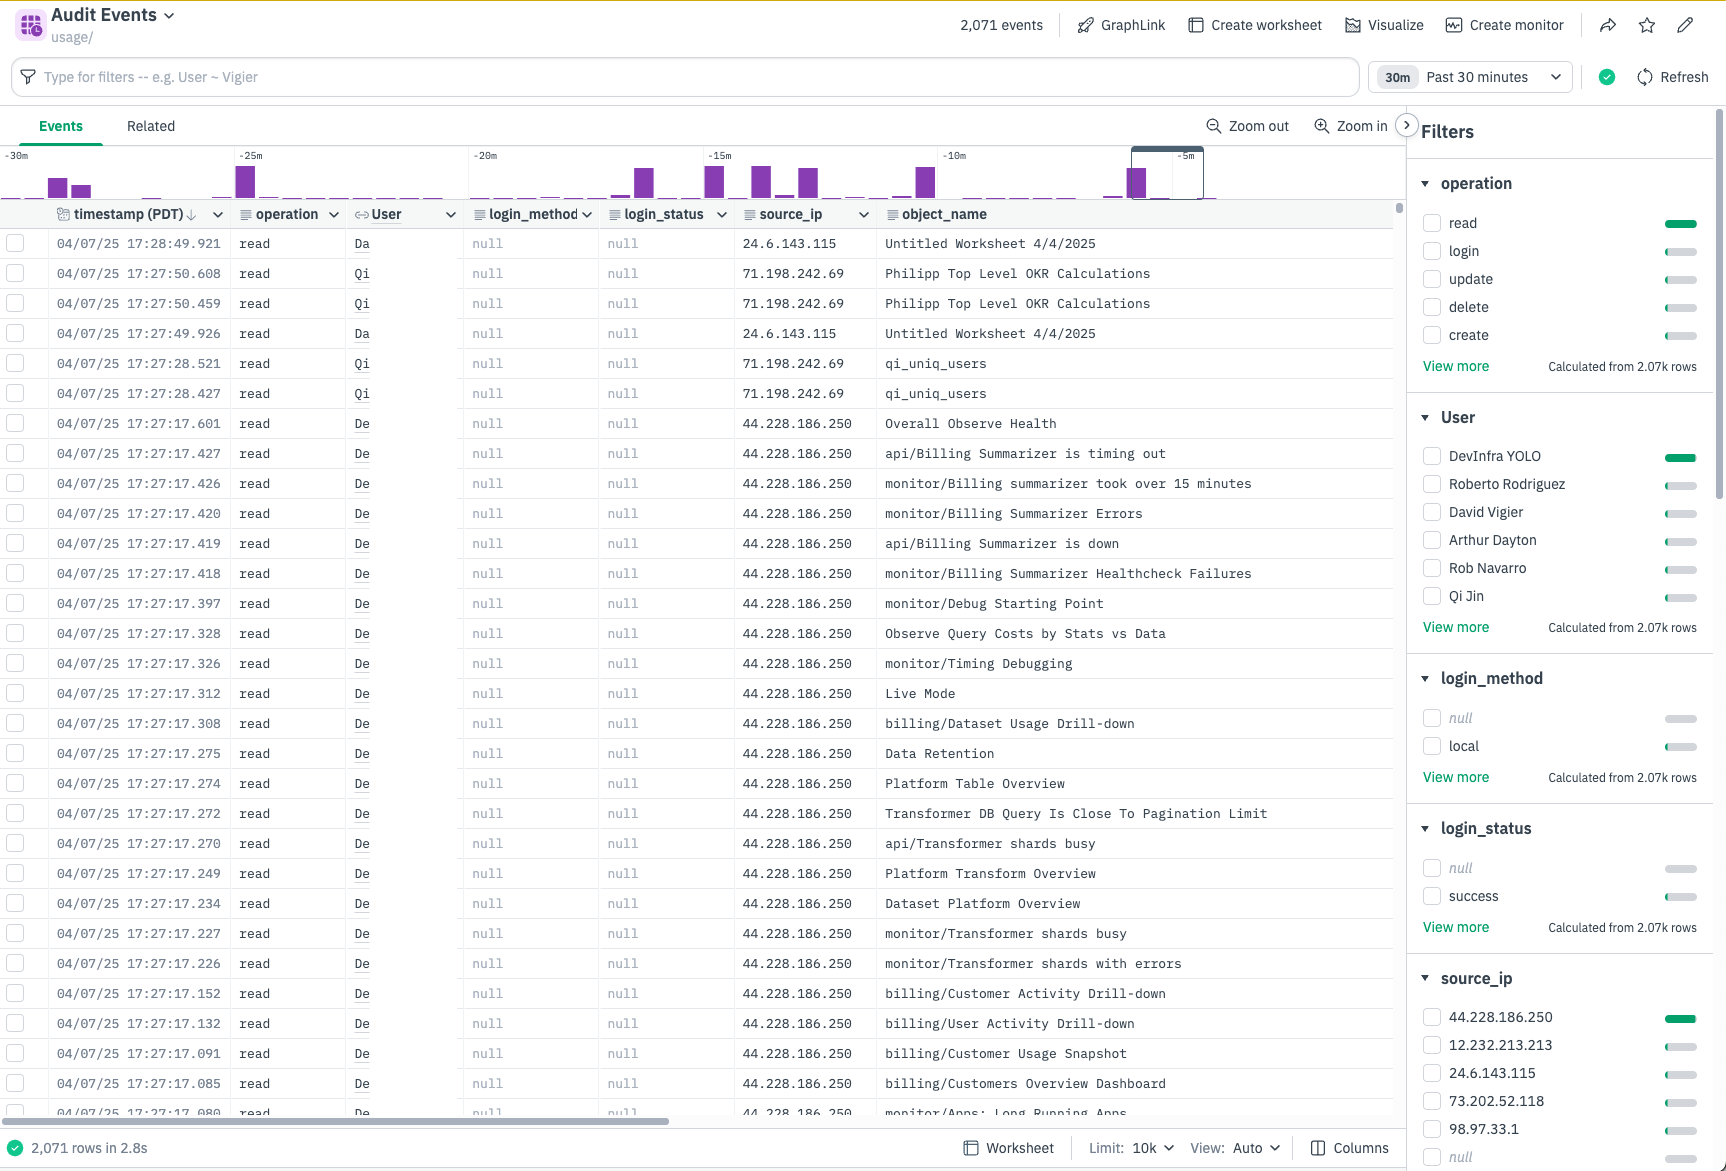
If you want to just view the raw events, you can open the System Datastream and run the following OPAL query, which shows all the audit events by their operation and object type. The example_events column will contain newline separated samples of your audit events.
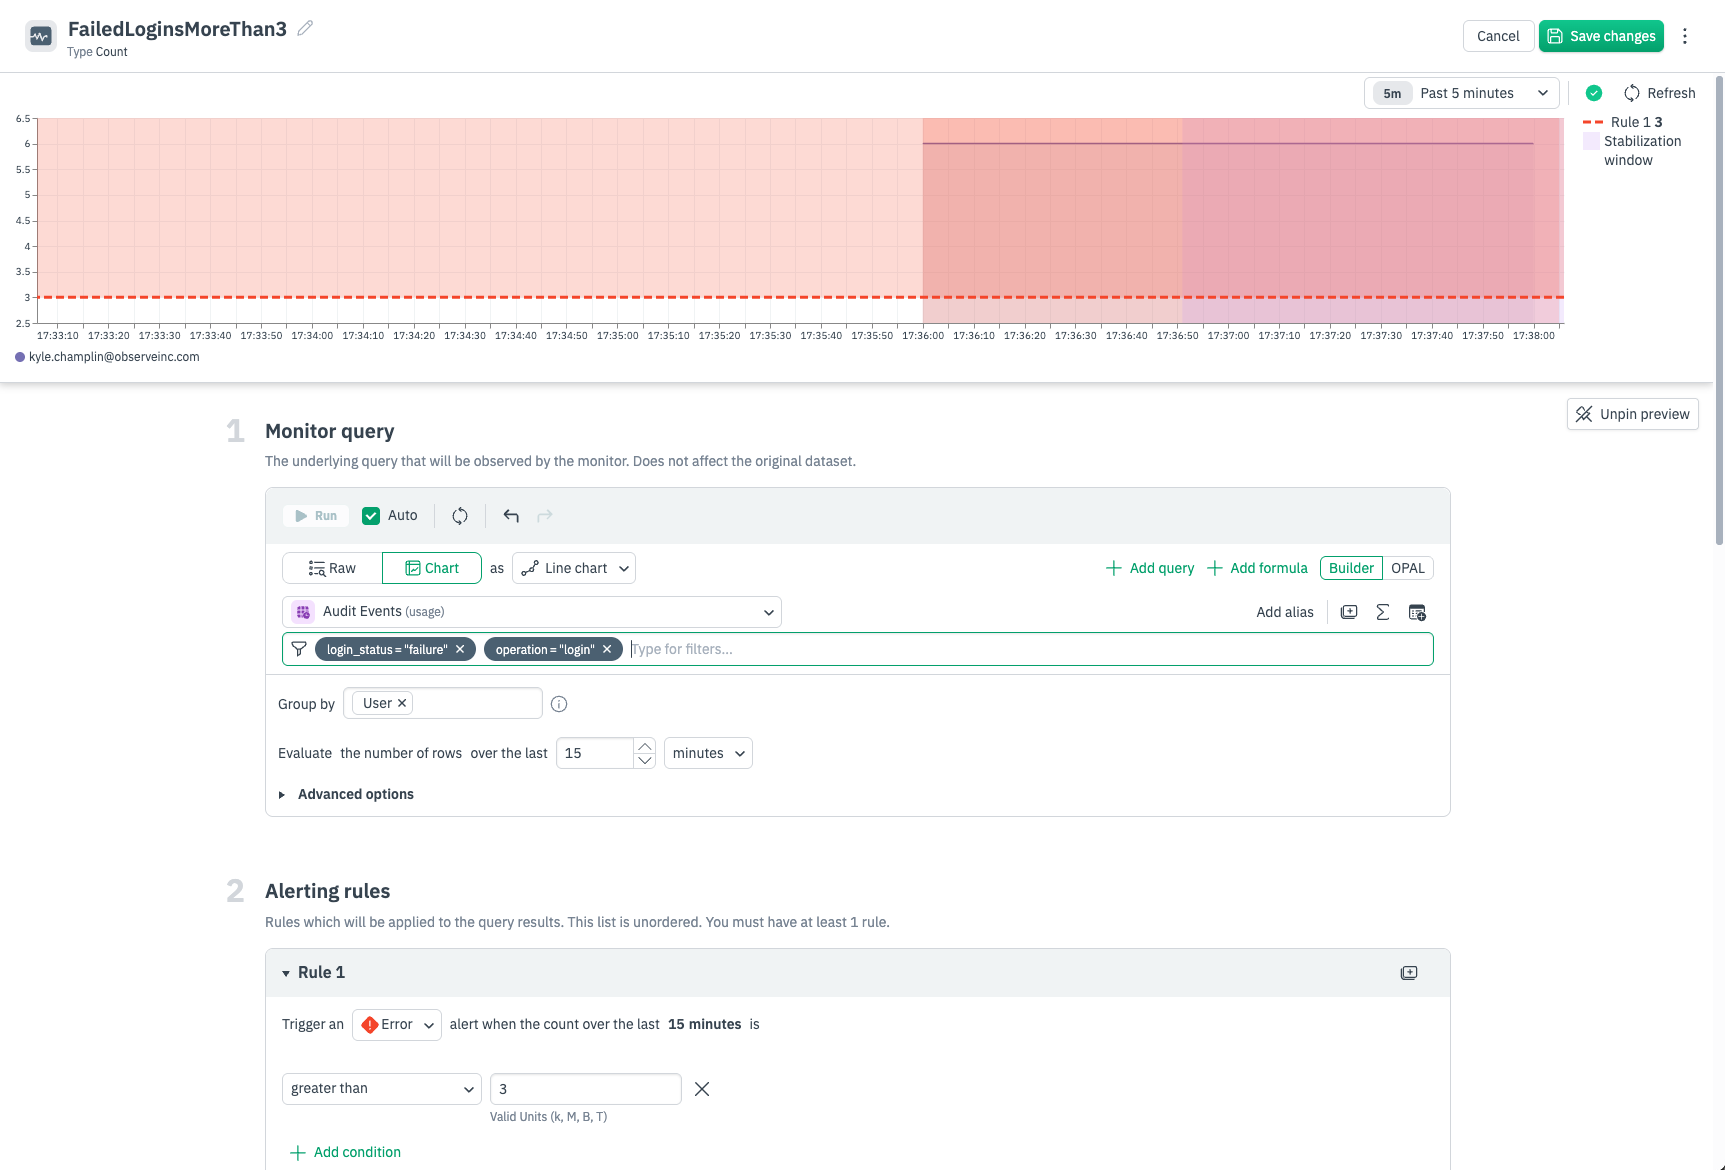
Create a monitor
Because the underlying raw data is exposed it is very simple to create monitors for specific audit events. For example, set a monitor that triggers when a specific user logs in, or set a monitor for anytime a dashboard is deleted. In the below example you can filter to failed login events by user, and alert when the number of failed logins per user surpasses a count over a specific timerange.
Create a scheduled report
You can use Observe dashboard reports to create scheduled report of the Audit Events dashboard. See Generate dashboard reports.
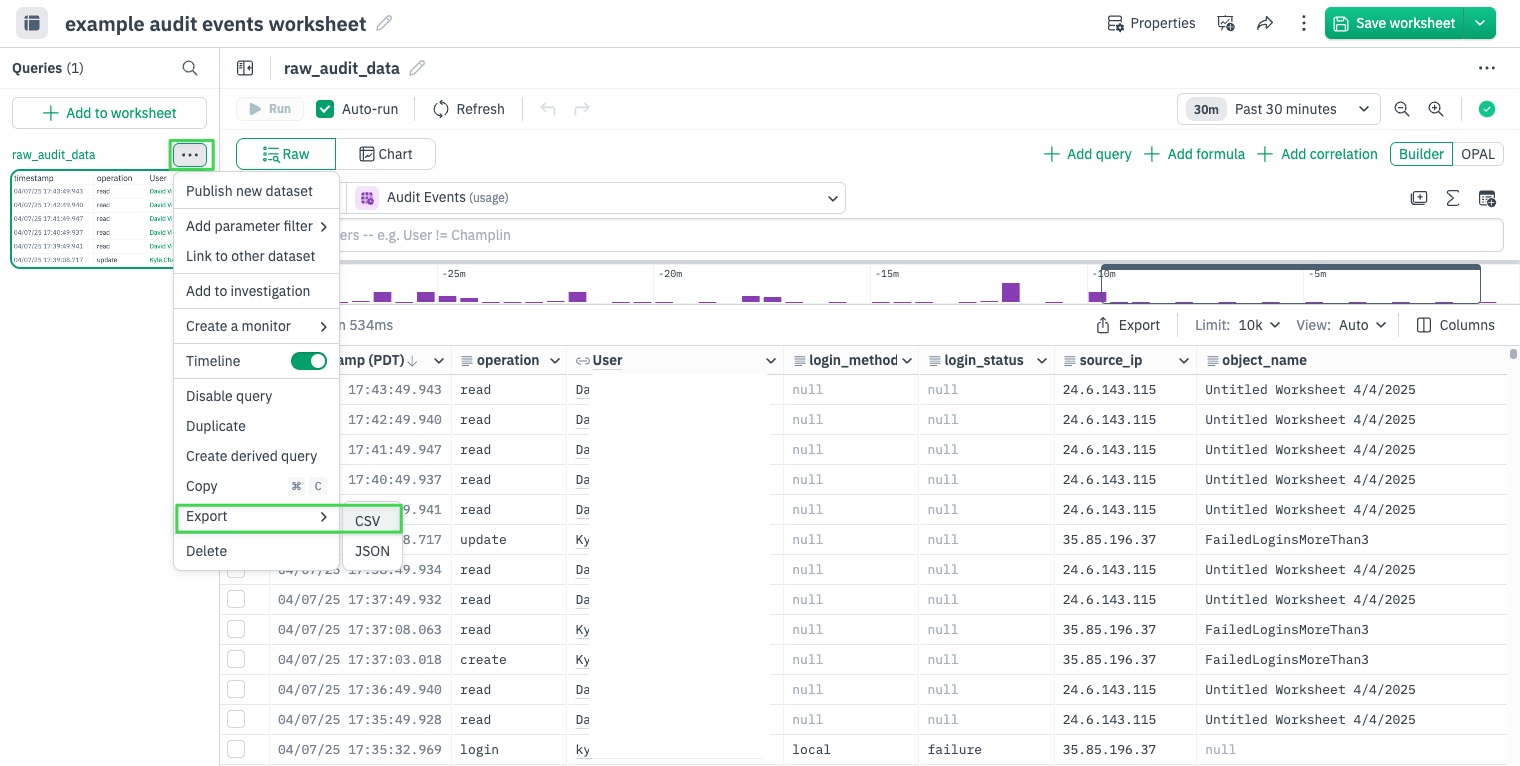
Download audit events as a CSV file
Observe Audit Trail allows you to download audit events as a CSV or JSON file locally. These events can then be analyzed locally, uploaded to a different tool for further analytics, or shared with appropriate team members as part of a security and compliance exercise.
To export audit events as CSV:
- Open the usage/Audit_Trail Dataset in a Worksheet.
- Filter the worksheet to just the audit events you want. For example, to view just the LLM audit logs:
<OpalCodeBlock
code={
`filter EXTRA.schema = "audit_log" and FIELDS.operation = "llm_invocation" - Click Export, then select CSV or JSON as the format.
- Select the number of events to export.
JSON examples
This section contains some examples of LLM audit logs.
o11y.ai Help
{
  "ai_feature": "o11y_help",
  "ai_model": "gpt-4.1-2025-04-14",
  "ai_provider": "openai",
  "input_prompt": "what is the opal verb for getting the topk aggregate",
  "operation": "llm_invocation",
  "time": "2026-02-06T16:24:56.86286968Z",
  "user_id": 1952
}
Explain a log message
{
  "ai_feature": "explain_log_message",
  "ai_provider": "openai",
  "input_prompt": "Can you explain this log message? E20260202 07:43:56.026131    189 scanner/src/tags.cpp:742] msg=\\"Metric name contains colon, ignoring\\" metric_name=workload:istio_tcp_connections_closed_total",
  "operation": "llm_invocation",
  "time": "2026-02-02T07:47:03.372435965Z",
  "user_id": 1792
}
OPAL co-pilot
{
  "ai_feature": "opal_copilot",
  "ai_model": "Qwen2.5-7B",
  "ai_provider": "self_hosted",
  "input_prompt": "# Parameters\\n\\n# Linkable Datasets\\n\\n# Input Datasets\\nName: \\"Tracing/Span\\", Label:  \\"Tracing/Span\\", Role: Data\\nKind: Interval\\nIndexes: \\nPrimary Keys: trace_id, span_id\\nForeign Keys:\\nColumns:\\n    start_time: timestamp\\n    end_time: timestamp\\n    duration: duration\\n    response_status: string\\n    service_name: string\\n    span_name: string\\n    status_code: int64\\n    error: bool\\n    status_message: string\\n    span_type: string\\n    service_namespace: string\\n    service_instance_id: string\\n    environment: string\\n    service_version: string\\n    attributes: object\\n    resource_attributes: object\\n    instrumentation_library: object\\n    parent_span_id: string\\n    span_id: string\\n    trace_id: string\\n    customer_id: int64\\n    user_id: int64\\n    k8s_cluster_uid: string\\n    k8s_namespace_name: string\\n    k8s_pod_name: string\\n    fields: object\\n    meta: object\\n\\n\\nName: \\"Tracing/Span_s3ji7\\", Label:  \\"Tracing/Span\\", Role: Data\\nKind: Interval\\nIndexes: \\nPrimary Keys: trace_id, span_id\\nForeign Keys:\\nColumns:\\n    start_time: timestamp\\n    end_time: timestamp\\n    duration: duration\\n    response_status: string\\n    service_name: string\\n    span_name: string\\n    status_code: int64\\n    error: bool\\n    status_message: string\\n    span_type: string\\n    service_namespace: string\\n    service_instance_id: string\\n    environment: string\\n    service_version: string\\n    attributes: object\\n    resource_attributes: object\\n    instrumentation_library: object\\n    parent_span_id: string\\n    span_id: string\\n    trace_id: string\\n    customer_id: int64\\n    user_id: int64\\n    k8s_cluster_uid: string\\n    k8s_namespace_name: string\\n    k8s_pod_name: string\\n    fields: object\\n    meta: object\\n\\n\\n# Additional Context\\nObject Kind: Worksheet\\n\\n# OPAL Query\\n// get the name of the parent_service on the same row as the spans service_name\\n",
  "operation": "llm_invocation",
  "source_ip": "73.61.69.6",
  "time": "2026-02-06T16:15:43.868735451Z",
  "user_id": 1921
}
Extract regex
{
  "ai_feature": "regex_extract",
  "ai_model": "gpt-4.1-2025-04-14",
  "ai_provider": "openai",
  "input_prompt": "I0206 18:00:26.428699                  745 tempo/bind.go:583] msg=\"calculate effective window\" query_id=b7311624-0385-11f1-85d4-c5073a492ced op_index=0 policy=BestEffortFinalSlice best_effort_materialized_windows=",
  "operation": "llm_invocation",
  "time": "2026-02-06T18:01:53.635177705Z",
  "user_id": 1792
}
Trace AI analysis
{
  "ai_feature": "trace_analysis",
  "ai_model": "claude-sonnet-4-5-20250929",
  "ai_provider": "anthropic",
  "input_prompt": "This trace contains 6 spans.\n[\n  {\n    \"start_time\": 1771259929999,\n    \"end_time\": 1771259930013.624,\n    \"span_name\": \"missing\",\n    \"service_name\": \"\",\n    \"duration\": 14.6240234375,\n    \"span_id\": \"bf2bb2155abdc669\",\n    \"parent_span_id\": \"\"\n  },\n  {\n    \"start_time\": 1771259929999,\n    \"end_time\": 1771259930013.624,\n    \"span_name\": \"GET\",\n    \"service_name\": \"frontend\",\n    \"duration\": 14.6240234375,\n    \"span_id\": \"f68ade4db510ee6e\",\n    \"parent_span_id\": \"bf2bb2155abdc669\",\n    \"response_status\": \"Ok\",\n    \"span_type\": \"Service entry point\"\n  },\n  {\n    \"start_time\": 1771259929999,\n    \"end_time\": 1771259930013.2908,\n    \"span_name\": \"GET /api/currency?\",\n    \"service_name\": \"frontend\",\n    \"duration\": 14.290771484375,\n    \"span_id\": \"39786ef5c9294a8a\",\n    \"parent_span_id\": \"f68ade4db510ee6e\",\n    \"response_status\": \"Ok\",\n    \"span_type\": \"Service entry point\"\n  },\n  {\n    \"start_time\": 1771259930000,\n    \"end_time\": 1771259930013.281,\n    \"span_name\": \"executing api route (pages) /api/currency\",\n    \"service_name\": \"frontend\",\n    \"duration\": 13.281005859375,\n    \"span_id\": \"50a25f413b651b45\",\n    \"parent_span_id\": \"39786ef5c9294a8a\",\n    \"response_status\": \"Ok\",\n    \"span_type\": \"Internal operation\"\n  },\n  {\n    \"start_time\": 1771259930000,\n    \"end_time\": 1771259930012.7803,\n    \"span_name\": \"grpc.oteldemo.CurrencyService/GetSupportedCurrencies\",\n    \"service_name\": \"frontend\",\n    \"duration\": 12.7802734375,\n    \"span_id\": \"bded29ac89462e1f\",\n    \"parent_span_id\": \"50a25f413b651b45\",\n    \"response_status\": \"Ok\",\n    \"span_type\": \"Remote call\"\n  },\n  {\n    \"start_time\": 1771259930001.879,\n    \"end_time\": 1771259930010.248,\n    \"span_name\": \"Currency/GetSupportedCurrencies\",\n    \"service_name\": \"currency\",\n    \"duration\": 8.369140625,\n    \"span_id\": \"cef654fcb9824a4d\",\n    \"parent_span_id\": \"bded29ac89462e1f\",\n    \"response_status\": \"Ok\",\n    \"span_type\": \"Service entry point\"\n  }\n]",
  "model_output": "## Trace Overview\n\n- **Total Duration**: 14.62ms\n- **Services Involved**: 3 (frontend, currency, and 1 unnamed service)\n- **Total Span Count**: 6 spans\n- **Trace Endpoint**: [missing](#span-id-bf2bb2155abdc669) (root span with empty service name)\n- **Status**: All spans completed successfully with \"Ok\" status\n- **No Errors Detected**: All spans show successful completion\n\n## Service Relationships\n\n| Caller | Callee | Request Count | Error Count | Avg Duration |\n|--------|--------|---------------|-------------|--------------|\n| frontend | currency | 1 | 0 | 8.37ms |\n\nThe service relationship is established between:\n- **Caller**: [grpc.oteldemo.CurrencyService/GetSupportedCurrencies](#span-id-bded29ac89462e1f) (frontend)\n- **Callee**: [Currency/GetSupportedCurrencies](#span-id-cef654fcb9824a4d) (currency)\n\n## Critical Path Analysis\n\nThe critical path follows this sequence:\n\n1. [missing](#span-id-bf2bb2155abdc669) - **14.62ms** (root span)\n2. [GET](#span-id-f68ade4db510ee6e) - **14.62ms** (frontend entry point)\n3. [GET /api/currency?](#span-id-39786ef5c9294a8a) - **14.29ms** (API route handler)\n4. [executing api route (pages) /api/currency](#span-id-50a25f413b651b45) - **13.28ms** (route execution)\n5. [grpc.oteldemo.CurrencyService/GetSupportedCurrencies](#span-id-bded29ac89462e1f) - **12.78ms** (gRPC call)\n6. [Currency/GetSupportedCurrencies](#span-id-cef654fcb9824a4d) - **8.37ms** (currency service processing)\n\n**Bottleneck**: The gRPC call to the currency service accounts for **96.2%** of the total API route execution time (12.78ms out of 13.28ms), indicating this external call is the dominant factor in request latency.\n\n## Errors/Warnings\n\n### Missing Service Name\n- **Issue**: The root span [missing](#span-id-bf2bb2155abdc669) has an empty `service_name` field\n- **Impact**: This makes it difficult to identify which service initiated the trace\n- **Recommendation**: Ensure proper service identification is configured in the instrumentation\n\n### Unusual Span Hierarchy\n- **Issue**: The root span [missing](#span-id-bf2bb2155abdc669) and its child [GET](#span-id-f68ade4db510ee6e) have identical start/end times and durations (14.62ms)\n- **Observation**: This suggests potential duplicate instrumentation or a wrapper span that adds no overhead\n- **Recommendation**: Review instrumentation configuration to eliminate redundant spans\n\n### Parent-Child Duration Mismatch\n- **Issue**: [GET /api/currency?](#span-id-39786ef5c9294a8a) (14.29ms) has a child span [executing api route (pages) /api/currency](#span-id-50a25f413b651b45) (13.28ms), leaving only **1.01ms** unaccounted\n- **Impact**: This minimal gap suggests good instrumentation coverage with minimal overhead\n\n## Performance Analysis\n\n### Network Latency\nThe gRPC call from frontend to currency service shows:\n- **Frontend gRPC span duration**: 12.78ms\n- **Currency service processing**: 8.37ms\n- **Network + serialization overhead**: ~4.41ms (34.5% of the remote call duration)\n\nThis overhead includes network round-trip time, serialization/deserialization, and gRPC framework overhead.\n\n### No N+1 Query Patterns Detected\nThere is only a single remote call to the currency service, with no evidence of repeated calls that could indicate an N+1 query problem.\n\n## Recommendations\n\n1. **Fix Missing Service Name**: Investigate why the root span has no service name. This could indicate a missing configuration in an API gateway, load balancer, or frontend router.\n\n2. **Eliminate Redundant Spans**: The duplicate root span ([missing](#span-id-bf2bb2155abdc669) and [GET](#span-id-f68ade4db510ee6e)) should be investigated. If both are intentional, add distinguishing attributes to clarify their purpose.\n\n3. **Monitor Currency Service Performance**: With the currency service call consuming 96% of the request time, any optimization here will directly improve overall latency. Consider:\n   - Caching supported currencies if they rarely change\n   - Implementing response compression\n   - Connection pooling optimization\n\n4. **Add Business Context**: Consider adding custom attributes like currency codes requested, cache hit/miss status, or feature flags to provide more operational insight.",
  "operation": "llm_invocation",
  "time": "2026-02-16T16:40:06.125Z",
  "user_id": 2896
}
Updated 17 days ago