Configure the Observe Agent on Linux, Windows, and macOS
This page is relevant only for configuring the Observe Agent on Linux, Windows, macOS. See Install in Kubernetes environment for Kubernetes configuration.
All user-provided configuration is in the observe-agent.yaml file. The agent will process this file when it starts and produce a final otel-collector configuration. The default configuration fragments for otel-collector are organized by connection type in the connections folder.
Configure via environment variable
In addition to the observe-agent.yaml file, you can also configure the agent using environment variables. You can override any field in the observe-agent.yaml by setting an environment variable with the field in all uppercase and substituting :: for . as the delimiter for nested fields. For example:
| Field in observe-agent.yaml | Corresponding environment variable |
|---|---|
token | TOKEN=newtoken |
host_monitoring.enabled | HOST_MONITORING::ENABLED=true |
Environment variables set this way take precedence over the values in the observe-agent.yaml.
Enable or disable connections
These configuration fragments are tied to a specific feature that can be enabled or disabled. For example, in the host_monitoring connection type we have the fragments logs.yaml and metrics.yaml. Each of these is tied to a boolean field in the observe-agent.yaml file and will be included or omitted based on the value there.
NoteSince there's no guarantee that any given feature will be enabled or disabled, these fragments must be independent of each other and cannot reference anything defined in other fragments. Referencing configuration between fragments could produce a broken
otel-collectorconfiguration.
Override existing OTEL collector configuration
You can also override existing components that are defined in the default fragments. To do so, find the name of the component you want to override and redefine it in the otel_config_overrides section of observe-agent.yaml. This section will override any prior definitions of components with the same name.
otel_config_overrides:
  exporters:
    debug:
      verbosity: detailed
      sampling_initial: 5
      sampling_thereafter: 200
  service:
    pipelines:
      # This will override the existing metrics/host_monitoring pipeline and output to stdout debug instead
      metrics/host_monitoring:
        receivers: [hostmetrics/host-monitoring-host]
        processors: [memory_limiter]
        exporters: [debug]
observe-agent.yaml Schema
observe-agent.yaml SchemaThe following table defines the schema for the observe-agent.yaml configuration file.
| Field | Default | Description |
|---|---|---|
| token | Observe authentication token | |
| observe_url | Observe data collection endpoint | |
| false | DEPRECATED, use internal_telemetry.logs.level instead. Sets log level of agent to "DEBUG" | |
| attributes | Key value pairs to add as attributes to all data | |
| resource_attributes | Key value pairs to add as resource attributes to all data | |
| cloud_resource_detectors | List of cloud providers to use for resource detection. See the Resource Detection processor docs for a full list of options | |
| agent_local_file_path | Override file path for where the agent instance ID is stored (used by fleet explorer). Changing this is not recommended. | |
| health_check | Specifies options for the Health Check Connection | |
| health_check.enabled | true | Enables the otel Health Check extension |
| health_check.endpoint | localhost:13133 | Specifies the endpoint for the Health Check extension |
| health_check.path | /status | Specifies the path for the Health Check extension |
| internal_telemetry | Specifies options for observe-agent internal telemetry | |
| internal_telemetry.enabled | true | Enables observe-agent internal telemetry |
| internal_telemetry.logs | Specifies options for the internal logs | |
| internal_telemetry.logs.enabled | true | Enables internal logging |
| internal_telemetry.logs.encoding | console | Sets the logger’s encoding. Valid options are console and json |
| internal_telemetry.logs.level | ${env:OTEL_LOG_LEVEL} | Sets the log level for internal logs |
| internal_telemetry.metrics | Specifies options for the internal metrics | |
| internal_telemetry.metrics.enabled | true | Enables internal metrics exposed via Prometheus |
| internal_telemetry.metrics.host | localhost | Specifies the host for the Prometheus metrics endpoint |
| internal_telemetry.metrics.port | 8888 | Specifies the port for the Prometheus metrics endpoint |
| internal_telemetry.metrics.level | detailed | Sets the level for internal metrics |
| forwarding | Specifies options for the Forwarding Connection | |
| forwarding.enabled | true | Enables Forwarding Connection |
| forwarding.endpoints | - | |
| forwarding.endpoints.grpc | localhost:4317 | Sets the endpoint on which to listen for OTLP data over gRPC |
| forwarding.endpoints.http | localhost:4318 | Sets the endpoint on which to listen for OTLP data over http |
| forwarding.metrics | - | |
| forwarding.metrics.output_format | prometheus | Sets the output format for forwarded metrics. Valid values are prometheus and otel |
| forwarding.metrics.convert_cumulative_to_delta | false | If true, will automatically convert all forwarded OTLP metrics to delta temporality. |
| forwarding.traces | - | |
| forwarding.traces.max_span_duration | 1h | The maximum allowed duration for a given span; longer spans are dropped. Valid values are either a time duration string or "none" to allow any span duration |
| host_monitoring | Specifies options for the Host Monitoring Connection | |
| host_monitoring.enabled | true | Enables Host Monitoring Connection |
| host_monitoring.logs | Specifies options for the logs component within Host Monitoring | |
| host_monitoring.logs.auto_multiline_detection | false | Enables automatic multiline detection for host logs. See Handle multiline log records for more |
| host_monitoring.logs.enabled | true | Enables the logs component within Host Monitoring |
| host_monitoring.logs.include | [] | Specify file paths from which to pull host logs |
| host_monitoring.logs.exclude | [] | Specify file paths to exclude when reading host logs |
| host_monitoring.metrics | Specifies options for the metrics component within Host Monitoring | |
| host_monitoring.metrics.host | - | |
| host_monitoring.metrics.host.enabled | true | Enables host level metrics within Host Monitoring |
| host_monitoring.metrics.process | - | |
| host_monitoring.metrics.process.enabled | false | Enables process level metrics within Host Monitoring |
| self_monitoring | Specifies options for the Self Monitoring Connection | |
| self_monitoring.enabled | false | Enables Self Monitoring Connection |
| self_monitoring.fleet | - | |
| self_monitoring.fleet.enabled | false | Enables the heartbeats necessary for Observe Fleet explorer. |
| self_monitoring.fleet.interval | 10m | Frequency at which to send the heartbeats. |
| self_monitoring.fleet.config_interval | 24h | Frequency at which to send the agent config alongside the heartbeat. |
| application | Specifies options for other application specific features | |
| application.RED_metrics | - | |
| application.RED_metrics.enabled | false | Generate RED metrics from trace data |
| application.RED_metrics.only_generate_for_service_entrypoint_spans | false | If true, RED metrics will only be generated for service entrypoint spans (ie those used in the APM service list). |
| application.RED_metrics.resource_dimensions | [service.namespace, service.version, deployment.environment] | The span resource attributes to group by when generating RED metrics. |
| application.RED_metrics.span_dimensions | [peer.db.name, peer.messaging.system, otel.status_description, observe.status_code] | The span attributes to group by when generating RED metrics |
| omit_base_components | false | Omit all base components from the bundled config. This should only be used when the observe-agent is run with a fully custom OTel config. |
| otel_config_overrides | Defines overrides to be added to the OTEL Collector configuration |
The observe_url value is composed from https://${OBSERVE_CUSTOMER_ID}.collect.${OBSERVE_INSTANCE}. For example, if you typically login to https://123456789012.observeinc.com, your ${OBSERVE_COLLECTION_ENDPOINT} is https://123456789012.collect.observeinc.com.
Some Observe instances may optionally use a name instead of Customer ID; if this is the case for your instance, contact your Observe data engineer to discuss implementation. A stem name will work as is, but a DNS redirect name may require client configuration.
Add custom OTEL collector configuration
The top level observe-agent.yaml includes a section for providing additional OTEL collector configuration, otel_config_overrides. For example, to add a new exporter and a new pipeline to use it, you could define both in this section as follows:
otel_config_overrides:
  exporters:
    debug:
      verbosity: detailed
      sampling_initial: 5
      sampling_thereafter: 200
  service:
    pipelines:
      metrics/debug:
        receivers: [hostmetrics/host-monitoring-host]
        processors: [memory_limiter]
        exporters: [debug]
When the agent starts, it adds this section to the otel-collector configuration and loads it.
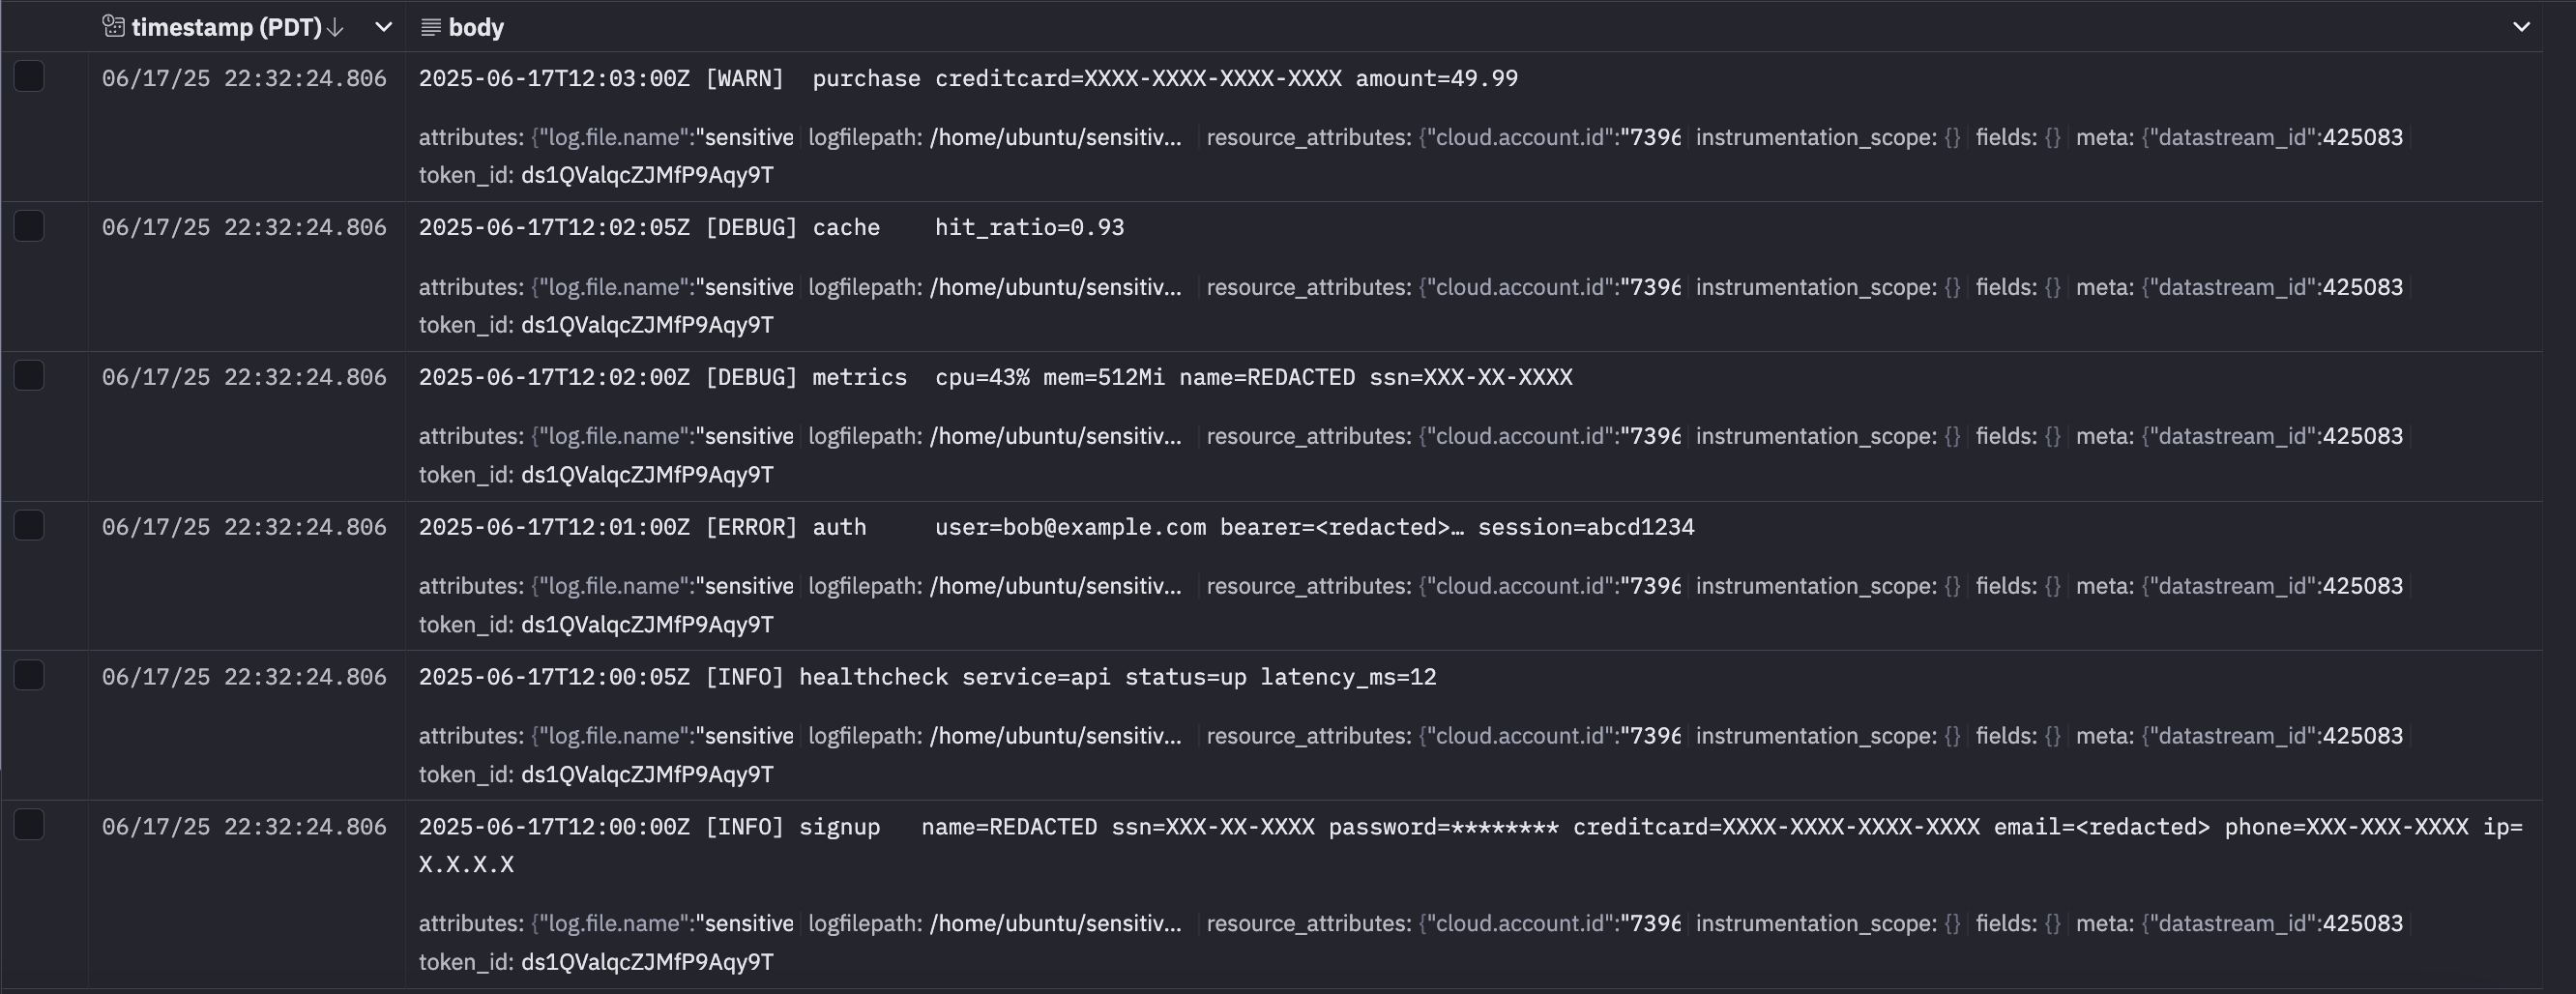
Mask sensitive data
Transform Processor can scrub personally identifiable information (PII) from your logs before they leave the host.
Let's suppose you have the following sensitive data in your logs.
2025-06-17T12:00:00Z [INFO] signup   name=Alice Johnson ssn=123-45-6789 password=Pa$$w0rd creditcard=4111-1111-1111-1111 [email protected] phone=415-555-1234 ip=192.168.0.23
2025-06-17T12:00:05Z [INFO] healthcheck service=api status=up latency_ms=12
2025-06-17T12:01:00Z [ERROR] auth     [email protected] bearer=eyJhbGciOiJIUzI1NiIsInR5cCI6IkpXVCJ9… session=abcd1234
2025-06-17T12:02:00Z [DEBUG] metrics  cpu=43% mem=512Mi name=Bob Smith ssn=987-65-4321
2025-06-17T12:02:05Z [DEBUG] cache    hit_ratio=0.93
2025-06-17T12:03:00Z [WARN]  purchase creditcard=5500-0000-0000-0004 amount=49.99
Add the following section to your existing observe-agent.yaml to replace passwords, credit-card numbers, SSNs, bearer tokens, email addresses, phone numbers, IPv4 addresses, and full names with masked values.
# this should be added to the existing observe-agent.yaml
otel_config_overrides:
  processors:
    transform/pii_mask:
      error_mode: ignore
      log_statements:
        - context: log
          statements:
            # Passwords (single-quoted YAML, double-quoted regex)
            - 'replace_pattern(body, "password=\\S+", "password=********")'

            # Credit-card numbers
            - 'replace_pattern(body, "creditcard=\\d{4}-\\d{4}-\\d{4}-\\d{4}", "creditcard=XXXX-XXXX-XXXX-XXXX")'

            # U.S. SSNs
            - 'replace_pattern(body, "ssn=\\d{3}-\\d{2}-\\d{4}", "ssn=XXX-XX-XXXX")'

            # Bearer / JWT tokens
            - 'replace_pattern(body, "bearer=[A-Za-z0-9\\-_.]+", "bearer=<redacted>")'

            # Email addresses
            - 'replace_pattern(body, "email=[A-Za-z0-9._%+-]+@[A-Za-z0-9.-]+\\.[A-Za-z]{2,}", "email=<redacted>")'

            # U.S. phone numbers
            - 'replace_pattern(body, "phone=\\d{3}-\\d{3}-\\d{4}", "phone=XXX-XXX-XXXX")'

            # IPv4 addresses
            - 'replace_pattern(body, "ip=\\d{1,3}\\.\\d{1,3}\\.\\d{1,3}\\.\\d{1,3}", "ip=X.X.X.X")'

            # Simple “First Last” token
            - 'replace_pattern(body, "name=[A-Za-z]+\\s[A-Za-z]+", "name=REDACTED")'
  service:
    pipelines:
      logs/forward:
        processors: [memory_limiter, transform/truncate, resourcedetection, resourcedetection/cloud, transform/pii_mask, batch]
      logs/host_monitoring-file:
        processors: [memory_limiter, transform/truncate, resourcedetection, resourcedetection/cloud, transform/pii_mask, batch]
      # Comment to disable Journald ingestion when the Observe Agent runs on Windows
      logs/host_monitoring-journald:
        processors: [memory_limiter, transform/truncate, resourcedetection, resourcedetection/cloud, transform/pii_mask, batch]
      # # Uncomment to enable Windows Event Log ingestion when the Observe Agent runs on Windows
      # logs/host_monitoring-windowsevents:
      #   processors: [memory_limiter, transform/truncate, resourcedetection, resourcedetection/cloud, transform/pii_mask, batch]
Start or reload the Observe Agent with this override and any sensitive fields will appear masked in Observe.
Fetch EC2 instance tags
Resource Detection Processor can optionally gather tags for the EC2 instance that the collector is running on.
NoteIn order to fetch EC2 tags, the IAM role assigned to the EC2 instance must have a policy that includes the
ec2:DescribeTagspermission.
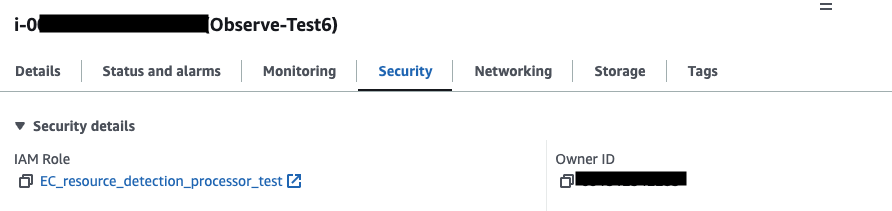
Let's suppose you want to fetch 3 tags from an EC2 instance the Observe Agent is running on.
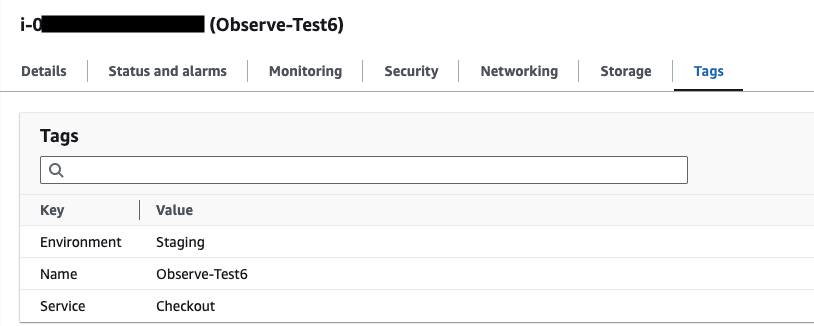
This otel_config_overrides section will fetch these 3 tags for the EC2 instance above:
# this should be added to the existing observe-agent.yaml
otel_config_overrides:
  processors:
    resourcedetection/cloud:
      detectors: ["ec2"]
      timeout: 2s
      override: false
      ec2:
        # A list of regex's to match tag keys to add as resource attributes can be specified
        tags:
          - ^Service$
          - ^Name$
          - ^Environment$
Once the Observe Agent is running with this otel_config_overrides section, you will see the following additional fields under resource.attributes.
"resource": {
"attributes": {
...
"ec2.tag.Environment": "Staging",
"ec2.tag.Name": "Observe-Test6",
"ec2.tag.Service": "Checkout",
...
}
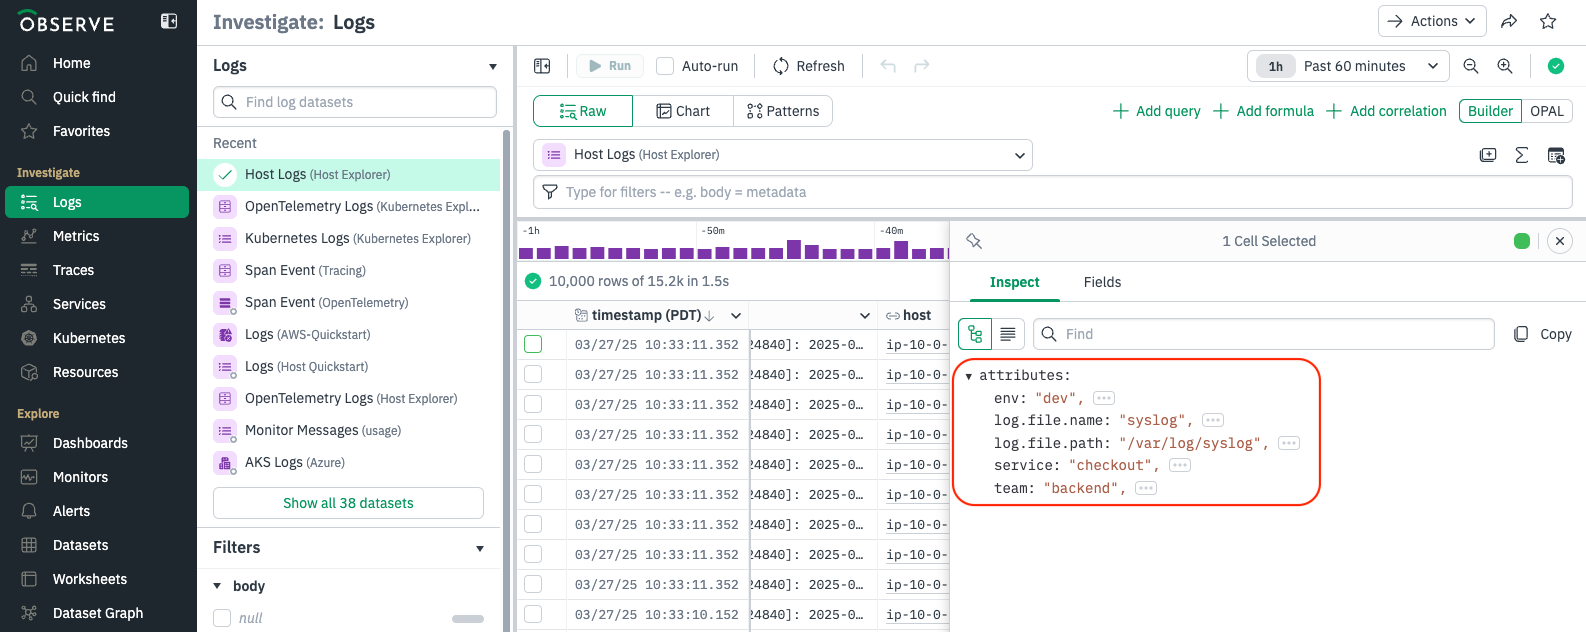
}Add attributes or tags
If you want to add the same attributes to every observe-agent pipeline, the simplest way is to set the attributes config value in the agent config. For example:
attributes:
  deployment.environment.name: dev
  service.name: checkout
  team.name: backend
If you want to selectively add attributes to only some pipeline, the Attributes Processor can do this.
Suppose you need to add three attributes or tags to the Observe Agent configuration. First, define an attributes processor (attributes/custom). Next, reference this processor within the pipelines. You can run observe-agent config to see the current pipeline configuration and determine exactly where to include the reference.
otel_config_overrides:
  processors:
    attributes/custom:
      actions:
        - key: env
          value: dev
          action: upsert
        - key: service
          value: checkout
          action: upsert
        - key: team
          value: backend
          action: upsert
  service:
    pipelines:
      metrics/forward:
        processors: [memory_limiter, resourcedetection, resourcedetection/cloud, attributes/custom, batch]
      logs/forward:
        processors: [memory_limiter, transform/truncate, resourcedetection, resourcedetection/cloud, attributes/custom, batch]
      traces/forward:
         processors: [memory_limiter, transform/truncate, resourcedetection, resourcedetection/cloud, attributes/custom, batch]
      metrics/agent-filestats:
        processors: [memory_limiter, resourcedetection, resourcedetection/cloud, attributes/custom, batch]
      metrics/host_monitoring_host:
        processors: [memory_limiter, resourcedetection, resourcedetection/cloud, attributes/custom, batch]
      logs/host_monitoring-file:
        processors: [memory_limiter, transform/truncate, resourcedetection, resourcedetection/cloud, attributes/custom, batch]
      logs/host_monitoring-journald:
        processors: [memory_limiter, transform/truncate, resourcedetection, resourcedetection/cloud, attributes/custom, batch]
      metrics/agent-internal:
        processors: [memory_limiter, transform/truncate, resourcedetection, resourcedetection/cloud, attributes/custom, deltatocumulative, batch]
      logs/agent-journald:
        processors: [memory_limiter, transform/truncate, resourcedetection, resourcedetection/cloud, attributes/custom, batch]
      logs/agent-config:
        processors: [memory_limiter, transform/truncate, resourcedetection, resourcedetection/cloud, attributes/custom, batch]
      # # Uncomment if you set host_monitoring.metrics.process.enabled to true
      # metrics/host_monitoring_process:
      #   processors: [memory_limiter, resourcedetection, resourcedetection/cloud, attributes/custom, batch]
Once the Observe Agent is running with this otel_config_overrides section, you will see the following additional fields under attributes.
Detect a host.id
host.idResource Detection Processor is used to detect a host.id.
By default, the Observe Agent is configured as follows to detect resource attributes:
...
  resourcedetection:
    detectors: [env, system]
    system:
      hostname_sources: ["dns", "os"]
      resource_attributes:
        host.id:
          enabled: false
  ...
  resourcedetection/cloud:
    detectors: ["gcp", "ecs", "ec2", "azure"]
    timeout: 2s
    override: false
  ...
This configuration maps the instance id for AWS and GCP or the virtual machine id for Azure to the host.id. It is generally effective for cloud providers. However, if the host.id is not detected correctly, you can enable additional settings by updating the configuration as shown below:
# this should be added to the existing observe-agent.yaml
otel_config_overrides:
  processors:
    resourcedetection:
      detectors: [env, system]
      system:
        hostname_sources: ["dns", "os"]
        resource_attributes:
          host.id:
            enabled: true
This adjustment ensures that the host.id is properly detected when the default configuration does not suffice.
Tail a log file
For example, this otel_config_overrides section will tail a log file:
# this should be added to the existing observe-agent.yaml
otel_config_overrides:
receivers:
filelog/custom-name:
# Define directories or files to include here
  include: [/opt/ProductionApp/RiskLogs/**/*.log]
  include_file_path: true
  storage: file_storage
  retry_on_failure:
    enabled: true
  max_log_size: 4MiB
service:
pipelines:
  logs/custom-logs:
    receivers: [filelog/custom-name]
    processors: [memory_limiter, transform/truncate, resourcedetection, batch]
exporters: [otlphttp/observe, count]# this should be added to the existing observe-agent.yaml
otel_config_overrides:
receivers:
filelog/custom-name:
# Define directories or files to include here
include: [D:\\Production\ App\\Risk\ Logs\\**\\*.log]
include_file_path: true
storage: file_storage
retry_on_failure:
enabled: true
max_log_size: 4MiB
service:
pipelines:
logs/custom-logs:
receivers: [filelog/custom-name]
processors: [memory_limiter, transform/truncate, resourcedetection, batch]
exporters: [otlphttp/observe, count]Handle multiline log records
Enable either auto_multiline_detection or a Recombine operator using is_first_entry—never both at the same time.The [File Log Receiver](https://github.com/open-telemetry/opentelemetry-collector-contrib/tree/main/receiver/filelogreceiver) flushes every 5 seconds by default. The 5 seconds is measured from when a log line matching either the default auto-detection regex or the provided is_first_entry regex is detected. Lines emitted outside that window are stored as separate records.Automatic detection
When auto_multiline_detection is enabled, the agent groups related log lines into a single entry whenever the first line starts with one of these timestamp formats:
- YYYY-MM-DD HH:MM:SS → 2025-06-16 13:45:30
- YYYY-MM-DDTHH:MM:SS.sssZ → 2025-06-16T14:33:53.123456Z
- Mon DD HH:MM:SS → Jun 16 20:16:01
- YYYY/MM/DD HH:MM:SS → 2025/06/16 20:46:15
...
host_monitoring:
    enabled: true
    logs:
        enabled: true
        auto_multiline_detection: true
...
Custom pattern with the Recombine operator
auto_multiline_detection covers the most common timestamp formats, but some applications use different markers to signal the start of a log entry.
When that happens, you can switch to the Recombine Operator and define your own rule with the is_first_entry setting. The operator tells the Observe Agent to begin a new record whenever a line matches the pattern you provide.
Suppose your logs lines that start with [
[2025-06-18T18:52:24.089689Z] INFO: User login successful. User ID: 92065
[2025-06-18T18:52:24.561449Z] INFO: User login successful. User ID: 65749
[2025-06-18T18:52:25.309899Z] DEBUG: Starting backup process.
Directory: /data/backup
Estimated files: 556
[2025-06-18T18:52:26.226822Z] DEBUG: Starting backup process.
Directory: /data/backup
Estimated files: 446
[2025-06-18T18:52:27.538841Z] ERROR: Failed to load configuration file.
File path: /etc/app/config.yaml
Cause: FileNotFoundError
Stack trace:
    File "/app/main.py", line 23, in load_config
    config = open(config_path, 'r')
FileNotFoundError: [Errno 2] No such file or directory: '/etc/app/config.yaml'
[2025-06-18T18:52:29.004533Z] ERROR: Failed to load configuration file.
File path: /etc/app/config.yaml
Cause: FileNotFoundError
Stack trace:
    File "/app/main.py", line 23, in load_config
    config = open(config_path, 'r')
FileNotFoundError: [Errno 2] No such file or directory: '/etc/app/config.yaml'
[2025-06-18T18:52:30.190177Z] INFO: User login successful. User ID: 30051
The pattern below tells the agent to open a new record whenever a line begins with [—for example, the bracket at the start of [2025-06-18T18:52:24.089689Z].
...
host_monitoring:
    enabled: true
    logs:
        enabled: true
        auto_multiline_detection: false
...

otel_config_overrides:
  receivers:
    filelog/host_monitoring:
        operators:
        - type: filter
          expr: 'body matches "otel-contrib"'
        # Recombine lines until the next one that starts with "["
        - id: multiline-recombine
          type: recombine
          combine_field: body
          is_first_entry: body matches "^\\["
Multiline configuration in File Log Receiver can be configured to split log entries on a pattern other than newlines.
Let's suppose you have the following log records, and need to treat multiline log records as one record or one observation.
[2024-11-09T05:47:56.722293Z] INFO: User login successful. User ID: 12345
[2024-11-09T06:00:23.982100Z] WARNING: API request failed.
Error: ConnectionTimeout
Endpoint: /api/data/fetch
Retrying in 10 seconds...
[2024-11-09T06:01:13.742852Z] DEBUG: Starting backup process.
Directory: /data/backup
Estimated files: 543
[2024-11-09T06:02:45.123812Z] ERROR: Failed to load configuration file.
File path: /etc/app/config.yaml
Cause: FileNotFoundError
Stack trace:
    File "/app/main.py", line 23, in load_config
    config = open(config_path, 'r')
FileNotFoundError: [Errno 2] No such file or directory: '/etc/app/config.yaml'
The following line_start_pattern: \[\d{4}-\d{2}-\d{2}T\d{2}:\d{2}:\d{2}\.\d{6}Z\] matches a timestamp format like [2024-11-09T05:47:56.722293Z].
# this should be added to the existing observe-agent.yaml
otel_config_overrides:
  receivers:
    filelog/host_monitoring:
      include:
        - /var/log/**/*.log
        - /var/log/syslog
      include_file_path: true
      storage: file_storage
      retry_on_failure:
        enabled: true
      max_log_size: 4MiB
      operators:
        - type: filter
          expr: 'body matches "otel-contrib"'
      multiline:
        line_start_pattern: \[\d{4}-\d{2}-\d{2}T\d{2}:\d{2}:\d{2}\.\d{6}Z\]
Filter metrics
Filter Processor can be configured to filter metrics. Let's suppose you'd like to collect metrics with the following conditions only.
- starts with
process.and ends with.time - starts with
system.cpu. - ends with
.utilization
If you'd like to filter out metrics with the same conditions above, replace include: with exclude:.
# this should be added to the existing observe-agent.yaml
otel_config_overrides:
  processors:
    filter/metrics:
      metrics:
        include:
          match_type: regexp
          metric_names:
            - process\..*\.time
            - system\.cpu\..*
            - .*\.utilization
  service:
    pipelines:
      metrics/forward:
        receivers: [otlp]
        processors: [memory_limiter, resourcedetection, resourcedetection/cloud, filter/metrics, batch]
        exporters: [otlphttp/observemetrics]
      metrics/host_monitoring_host:
        receivers: [hostmetrics/host-monitoring-host]
        processors: [memory_limiter, resourcedetection, resourcedetection/cloud, filter/metrics, batch]
        exporters: [prometheusremotewrite/observe]
      # # Uncomment if you set host_monitoring.metrics.process.enabled to true
      # metrics/host_monitoring_process:
      #   receivers: [hostmetrics/host-monitoring-process]
      #   processors: [memory_limiter, resourcedetection, resourcedetection/cloud, filter/metrics, batch]
      #   exporters: [prometheusremotewrite/observe]
      metrics/agent-filestats:
        receivers: [filestats/agent]
        processors: [memory_limiter, resourcedetection, resourcedetection/cloud, filter/metrics, batch]
        exporters: [prometheusremotewrite/observe]
      metrics/agent-internal:
        receivers: [prometheus/agent, count]
        processors: [memory_limiter, transform/truncate, resourcedetection, resourcedetection/cloud, deltatocumulative, filter/metrics, batch]
        exporters: [prometheusremotewrite/observe]
Receive data from a Splunk forwarder
To use the Observe Agent to receive data from Splunk forwarders, you have a Splunk Enterprise or Cloud Instance alongside either a Splunk Universal Forwarder or a Splunk Heavy Forwarder routing data to your Splunk instance. The Observe Agent will receive data from the forwarder over TCP port 9997. This requires the following configurations for the Observe Agent and Splunk Forwarders.
# this should be added to the existing observe-agent.yaml
otel_config_overrides:
receivers:
tcplog/s2s:
    add_attributes: true
    listen_address: 0.0.0.0:9997
    operators:
        - field: attributes.log_type
          type: add
          value: splunk_tcp
service:
pipelines:
  logs/forward:
    receivers: [tcplog/s2s]
exporters: [otlphttp/observe] [tcpout]
defaultGroup = observeAgent
[tcpout:observeAgent]
server = hostname:9997
compressed = false
useACK = false
sendCookedData = falseSample spans or log records
Probabilistic Sampling Processor can be configured to sample spans or log.
# this should be added to the existing observe-agent.yaml
otel_config_overrides:
processors:
probabilistic_sampler:
  sampling_percentage: 50.0

service:
pipelines:
  traces/forward:
    receivers: [otlp]
    processors: [probabilistic_sampler]
    exporters: [debug]
# this should be added to the existing observe-agent.yaml
otel_config_overrides:
processors:
probabilistic_sampler:
  sampling_percentage: 15
service:
pipelines:
  logs/forward:
    receivers: [otlp]
    processors: [memory_limiter, transform/truncate, resourcedetection, resourcedetection/cloud, probabilistic_sampler, batch]
    exporters: [otlphttp/observe, count]
  logs/host_monitoring-file:
    receivers: [filelog/host_monitoring]
    processors: [memory_limiter, transform/truncate, resourcedetection, resourcedetection/cloud, probabilistic_sampler, batch]
    exporters: [otlphttp/observe, count]
  logs/host_monitoring-journald:
    receivers: [journald/host_monitoring]
    processors: [memory_limiter, transform/truncate, resourcedetection, resourcedetection/cloud, probabilistic_sampler, batch]
    exporters: [otlphttp/observe, count]
Collect metrics from a MongoDB instance
MongoDB Receiver can be configured to collect metrics from a MongoDB instance.
# this should be added to the existing observe-agent.yaml
otel_config_overrides:
  receivers:
    mongodb:
      hosts:
        - endpoint: localhost:27017
      username: otel
      password: ${env:MONGODB_PASSWORD}
      initial_delay: 1s
      tls:
        insecure: true
        insecure_skip_verify: true
  processors:
  resource/mongod:
    attributes:
      - key: host.name
        value: "my_host"
        action: upsert
  service:
    pipelines:
      metrics/mongo:
        receivers: [mongodb]
        processors:
          [memory_limiter, resourcedetection, resourcedetection/cloud,resource/mongod, batch]
        exporters: [otlphttp/observemetrics]
Collect logs from a MongoDB instance
File Log Receiver can be configured to collect logs from a MongoDB instance. Additionally, you can append metadata like host.name to the logs.
# this should be added to the existing observe-agent.yaml
otel_config_overrides:
  receivers:
    filelog/mongod:
      include:
        - /log/mongod.log

  processors:
    resource/mongod:
      attributes:
        - key: host.name
          value: "my_host"
          action: upsert

  service:
    pipelines:
      logs/new-pipeline:
        receivers: [filelog/mongod]
        processors: [memory_limiter, transform/truncate, resourcedetection, resourcedetection/cloud, resource/mongod, batch]
        exporters: [otlphttp/observe]
Updated 6 months ago