Log Explorer
Access the Log Explorer
To start using the Log Explorer, log into your Observe instance and click Logs on the left navigation rail.
The time range automatically adjusts for optimal display of the selected log Dataset. Use the time-range picker menu at the top right to adjust time range as needed.
Example using Kubernetes logs
Log into your Observe instance and use the following steps to view checkout container details in you Kubernetes logs:
- From the left navigation bar, click Logs.
- In the Find log datasets field, enter Kubernetes, and select Kubernetes Logs from the search results.
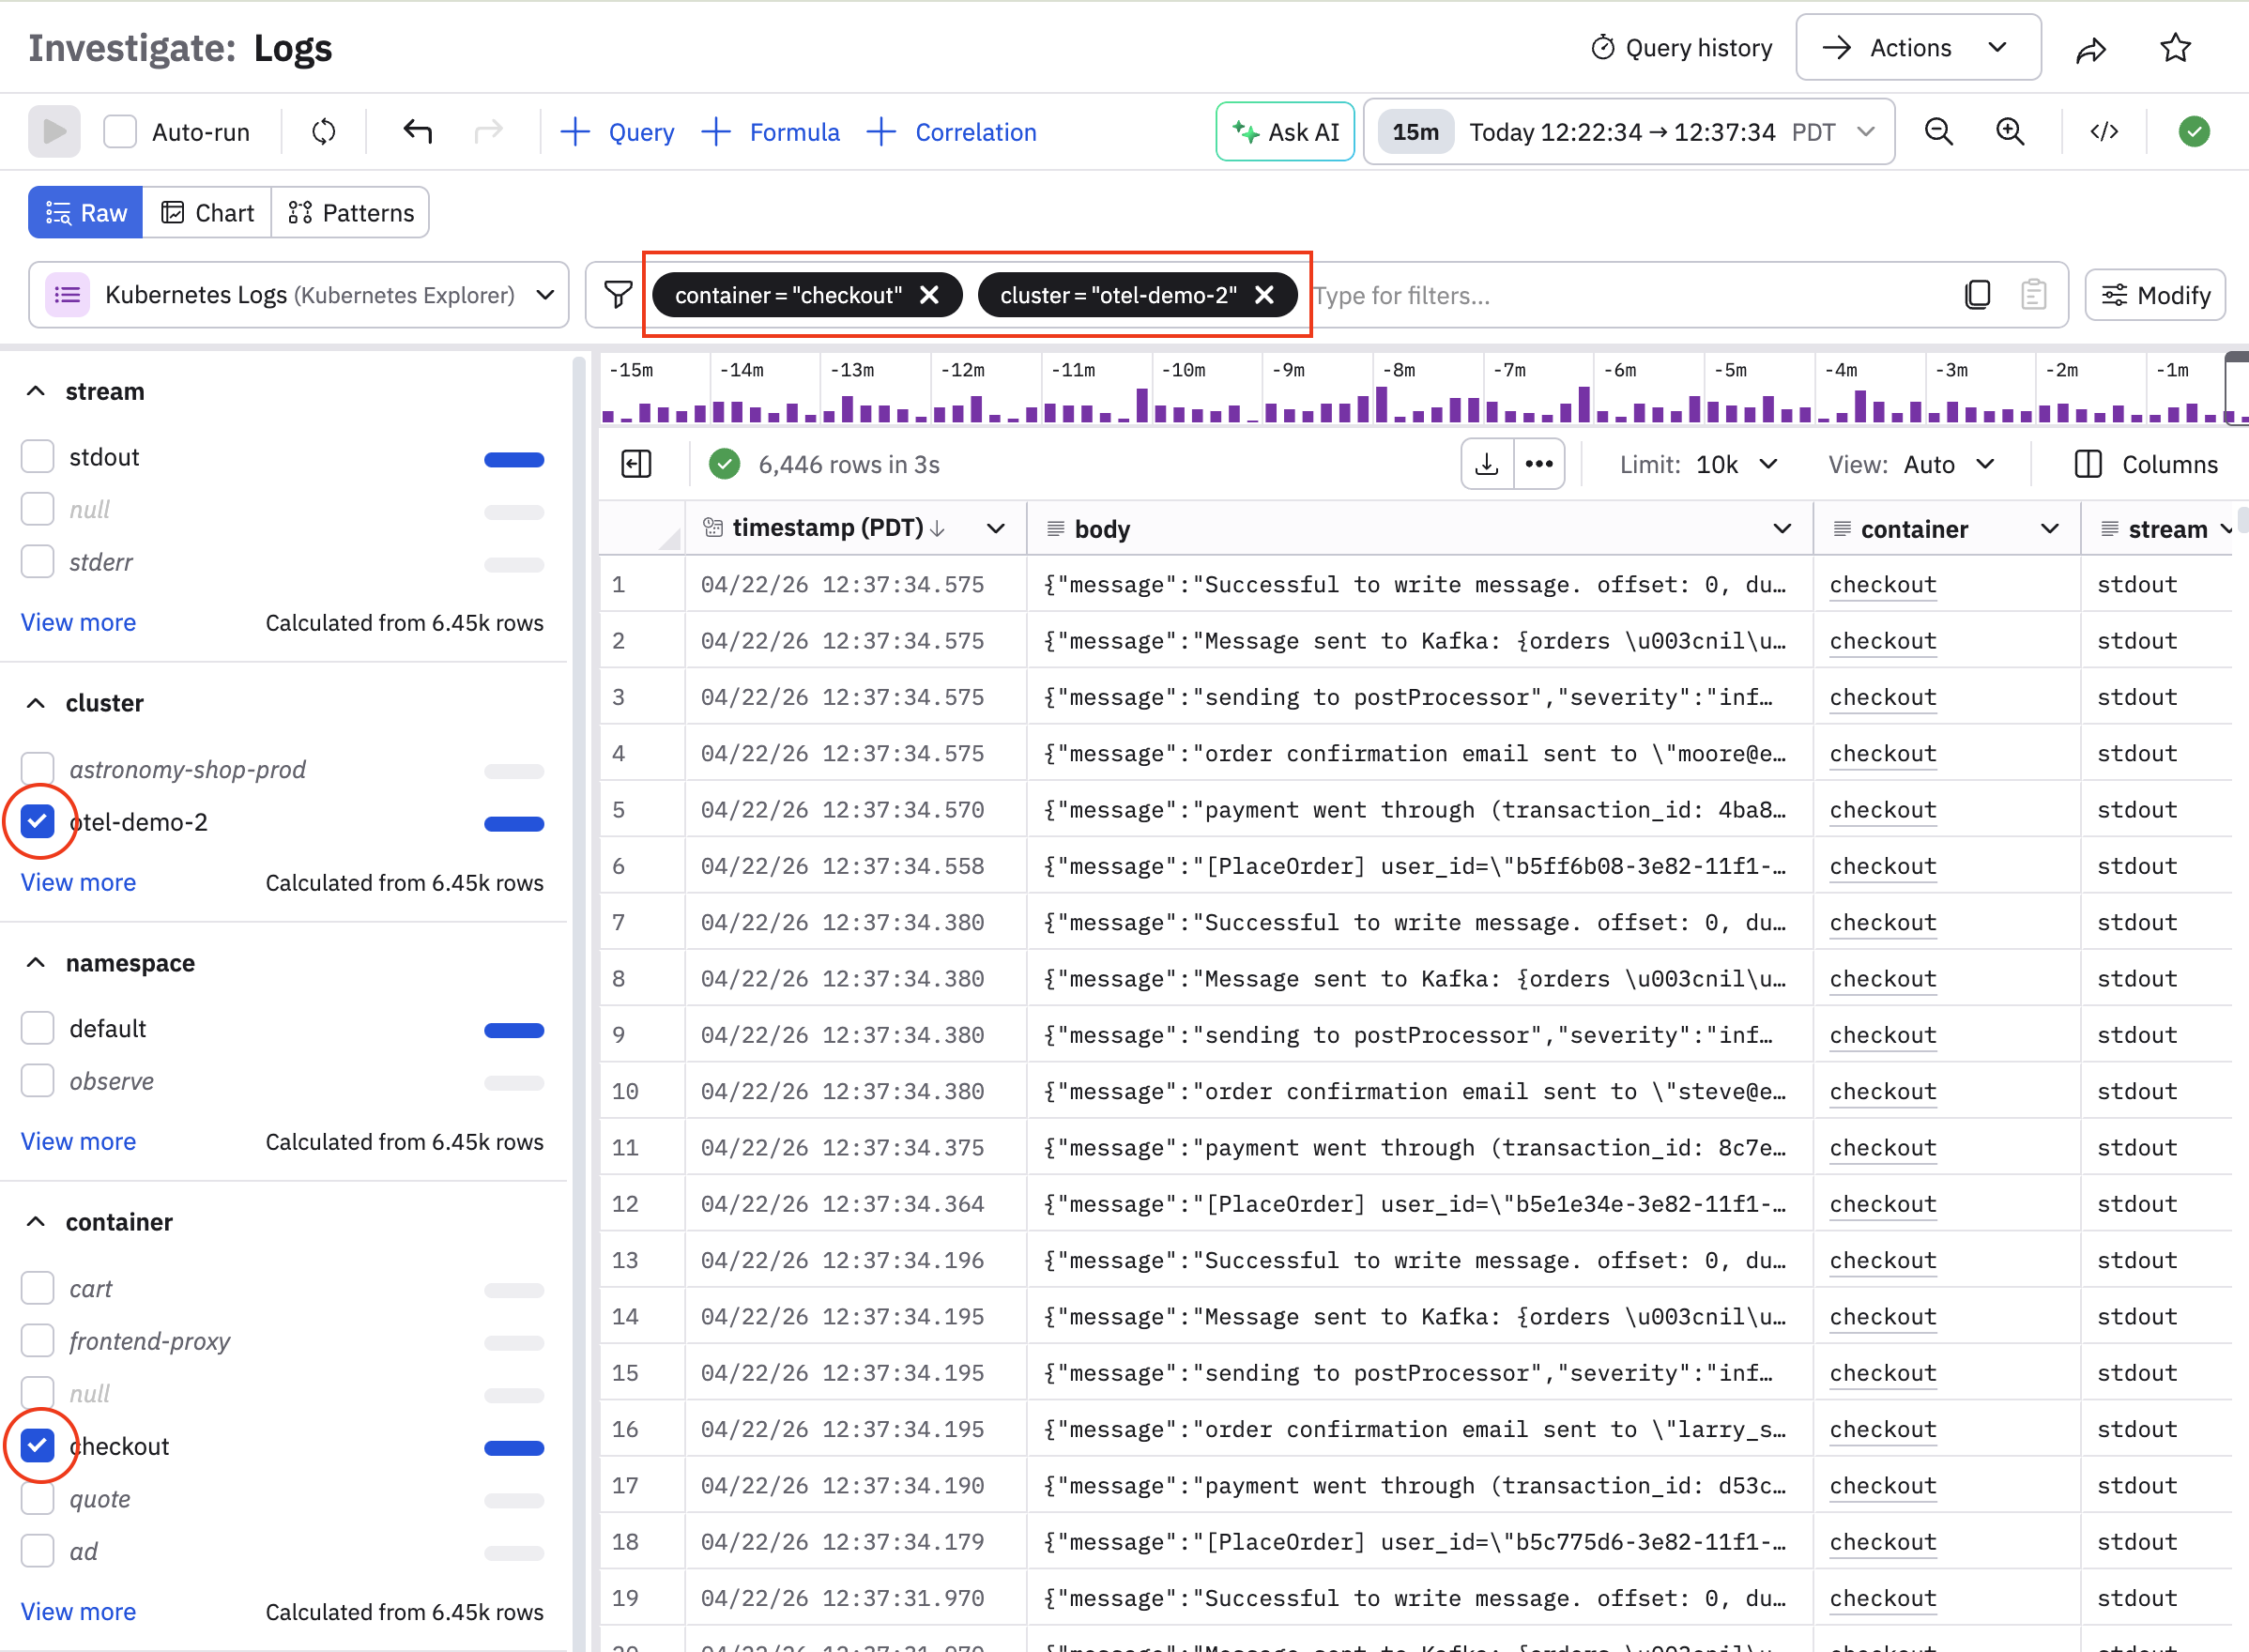
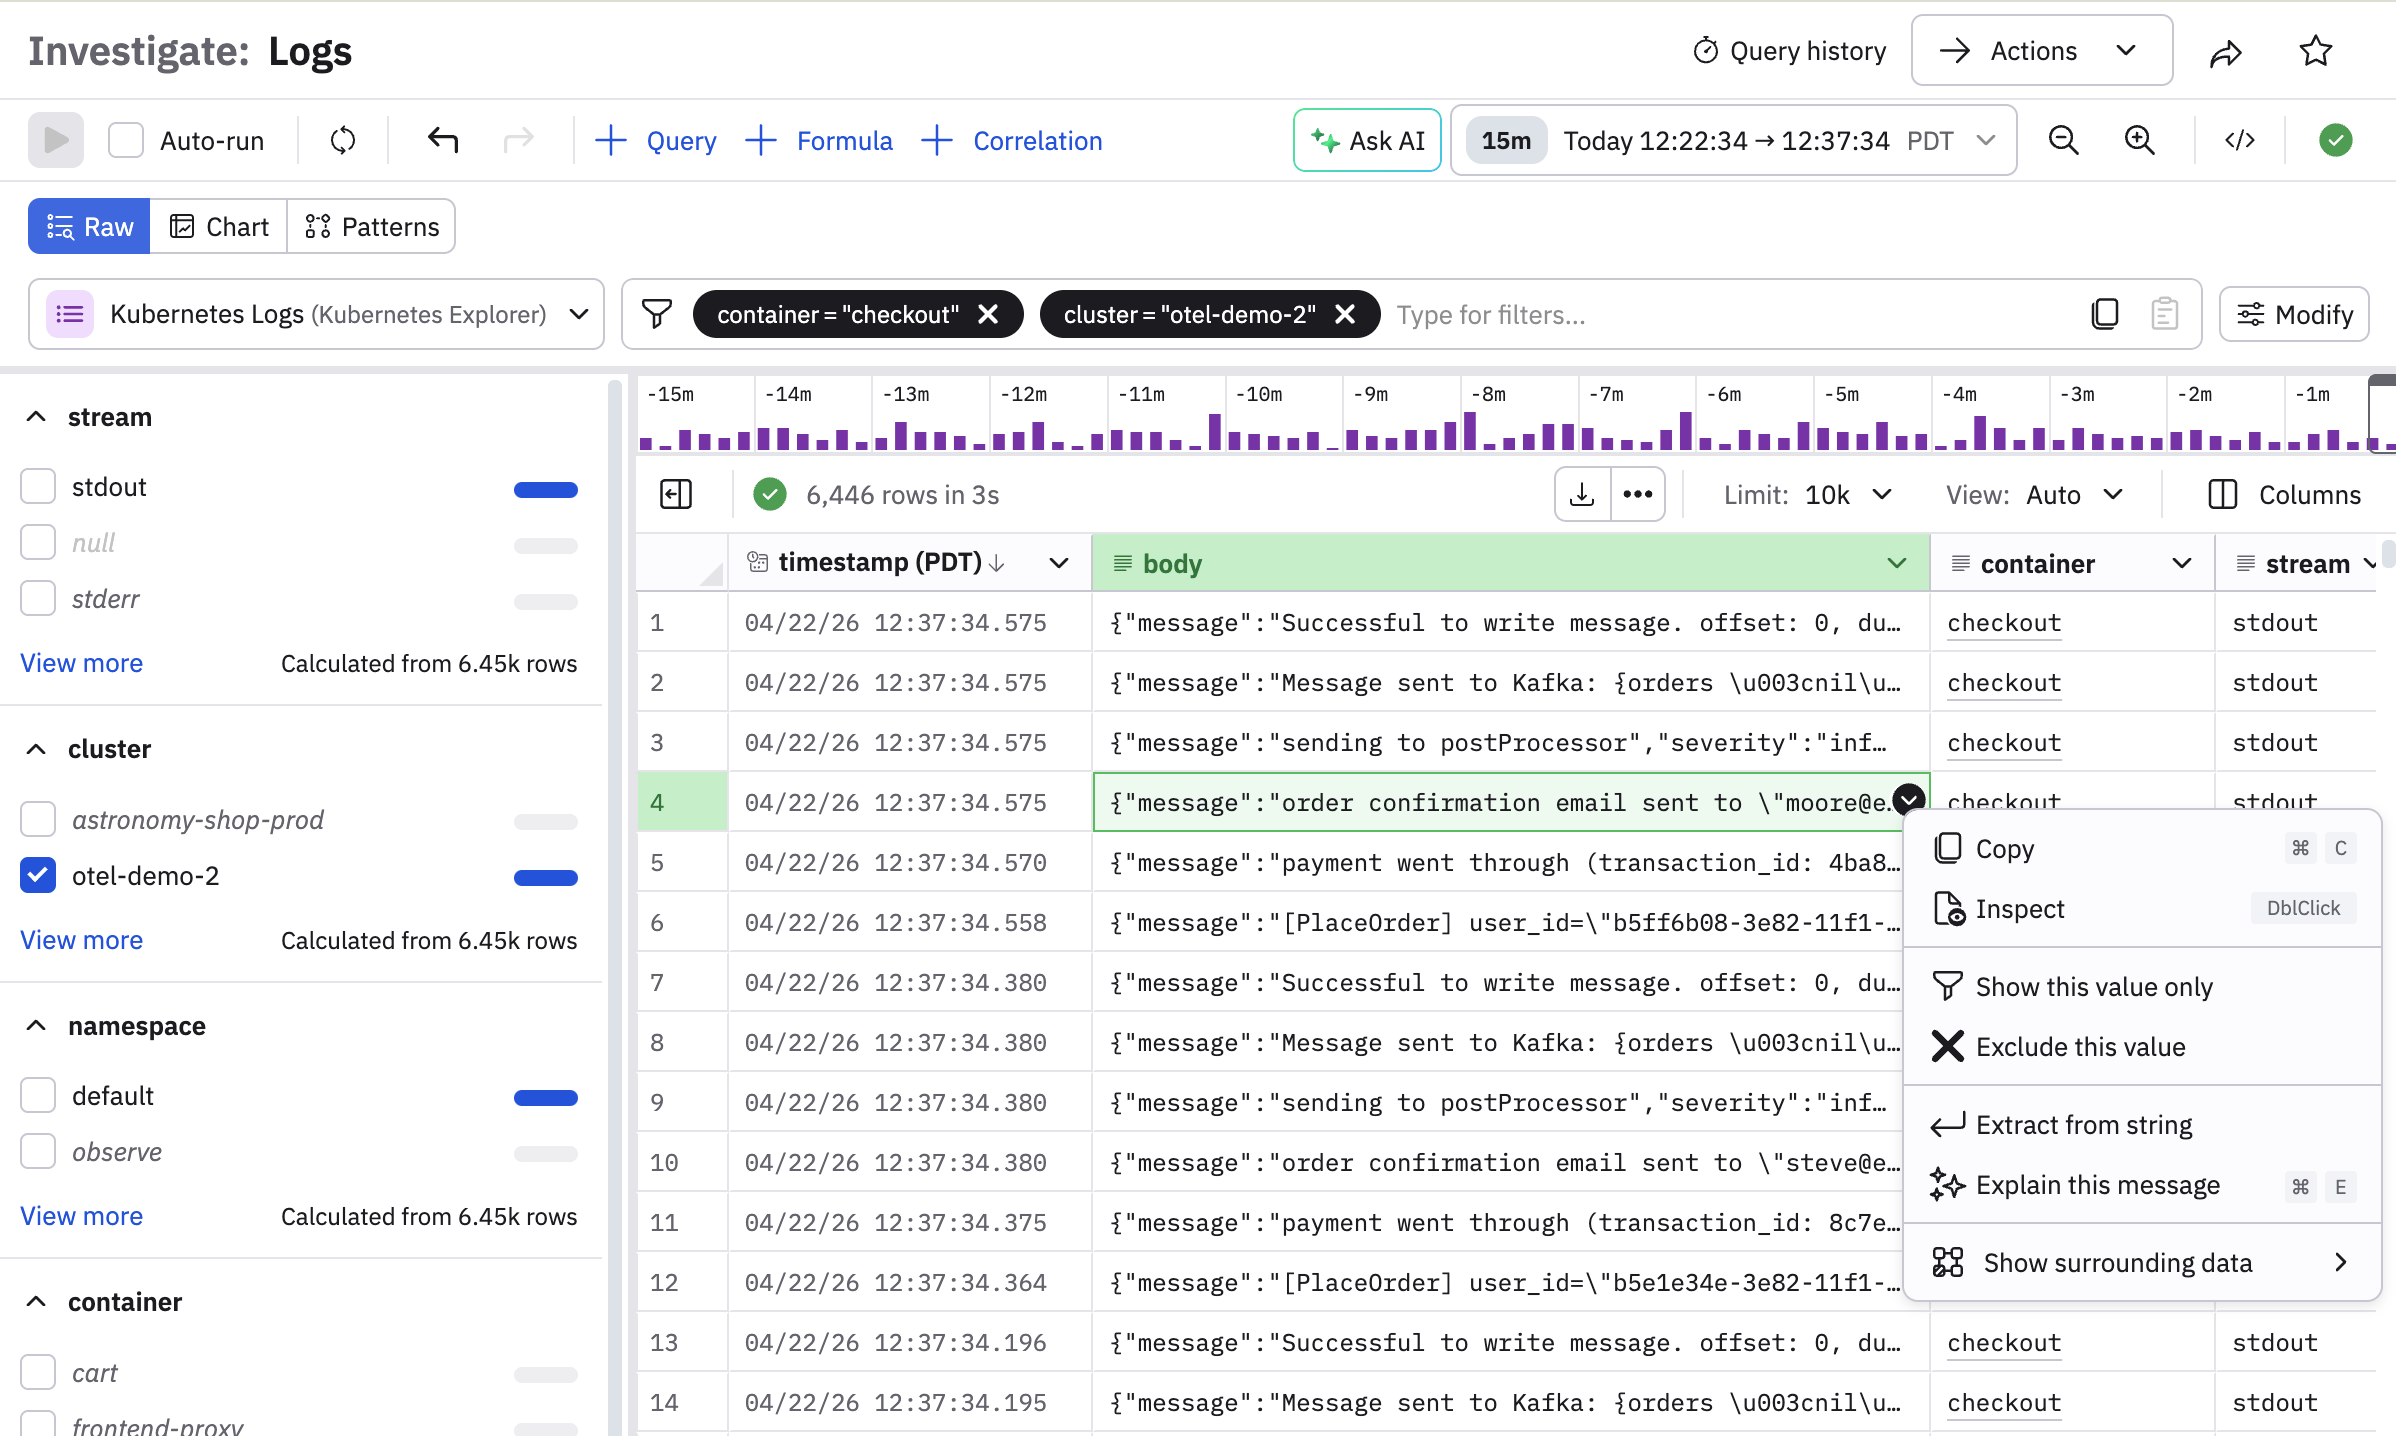
- In the Filter field, enter container ~ checkout. This filters entries in the Kubernetes Logs Dataset to only those with checkout in the container column.
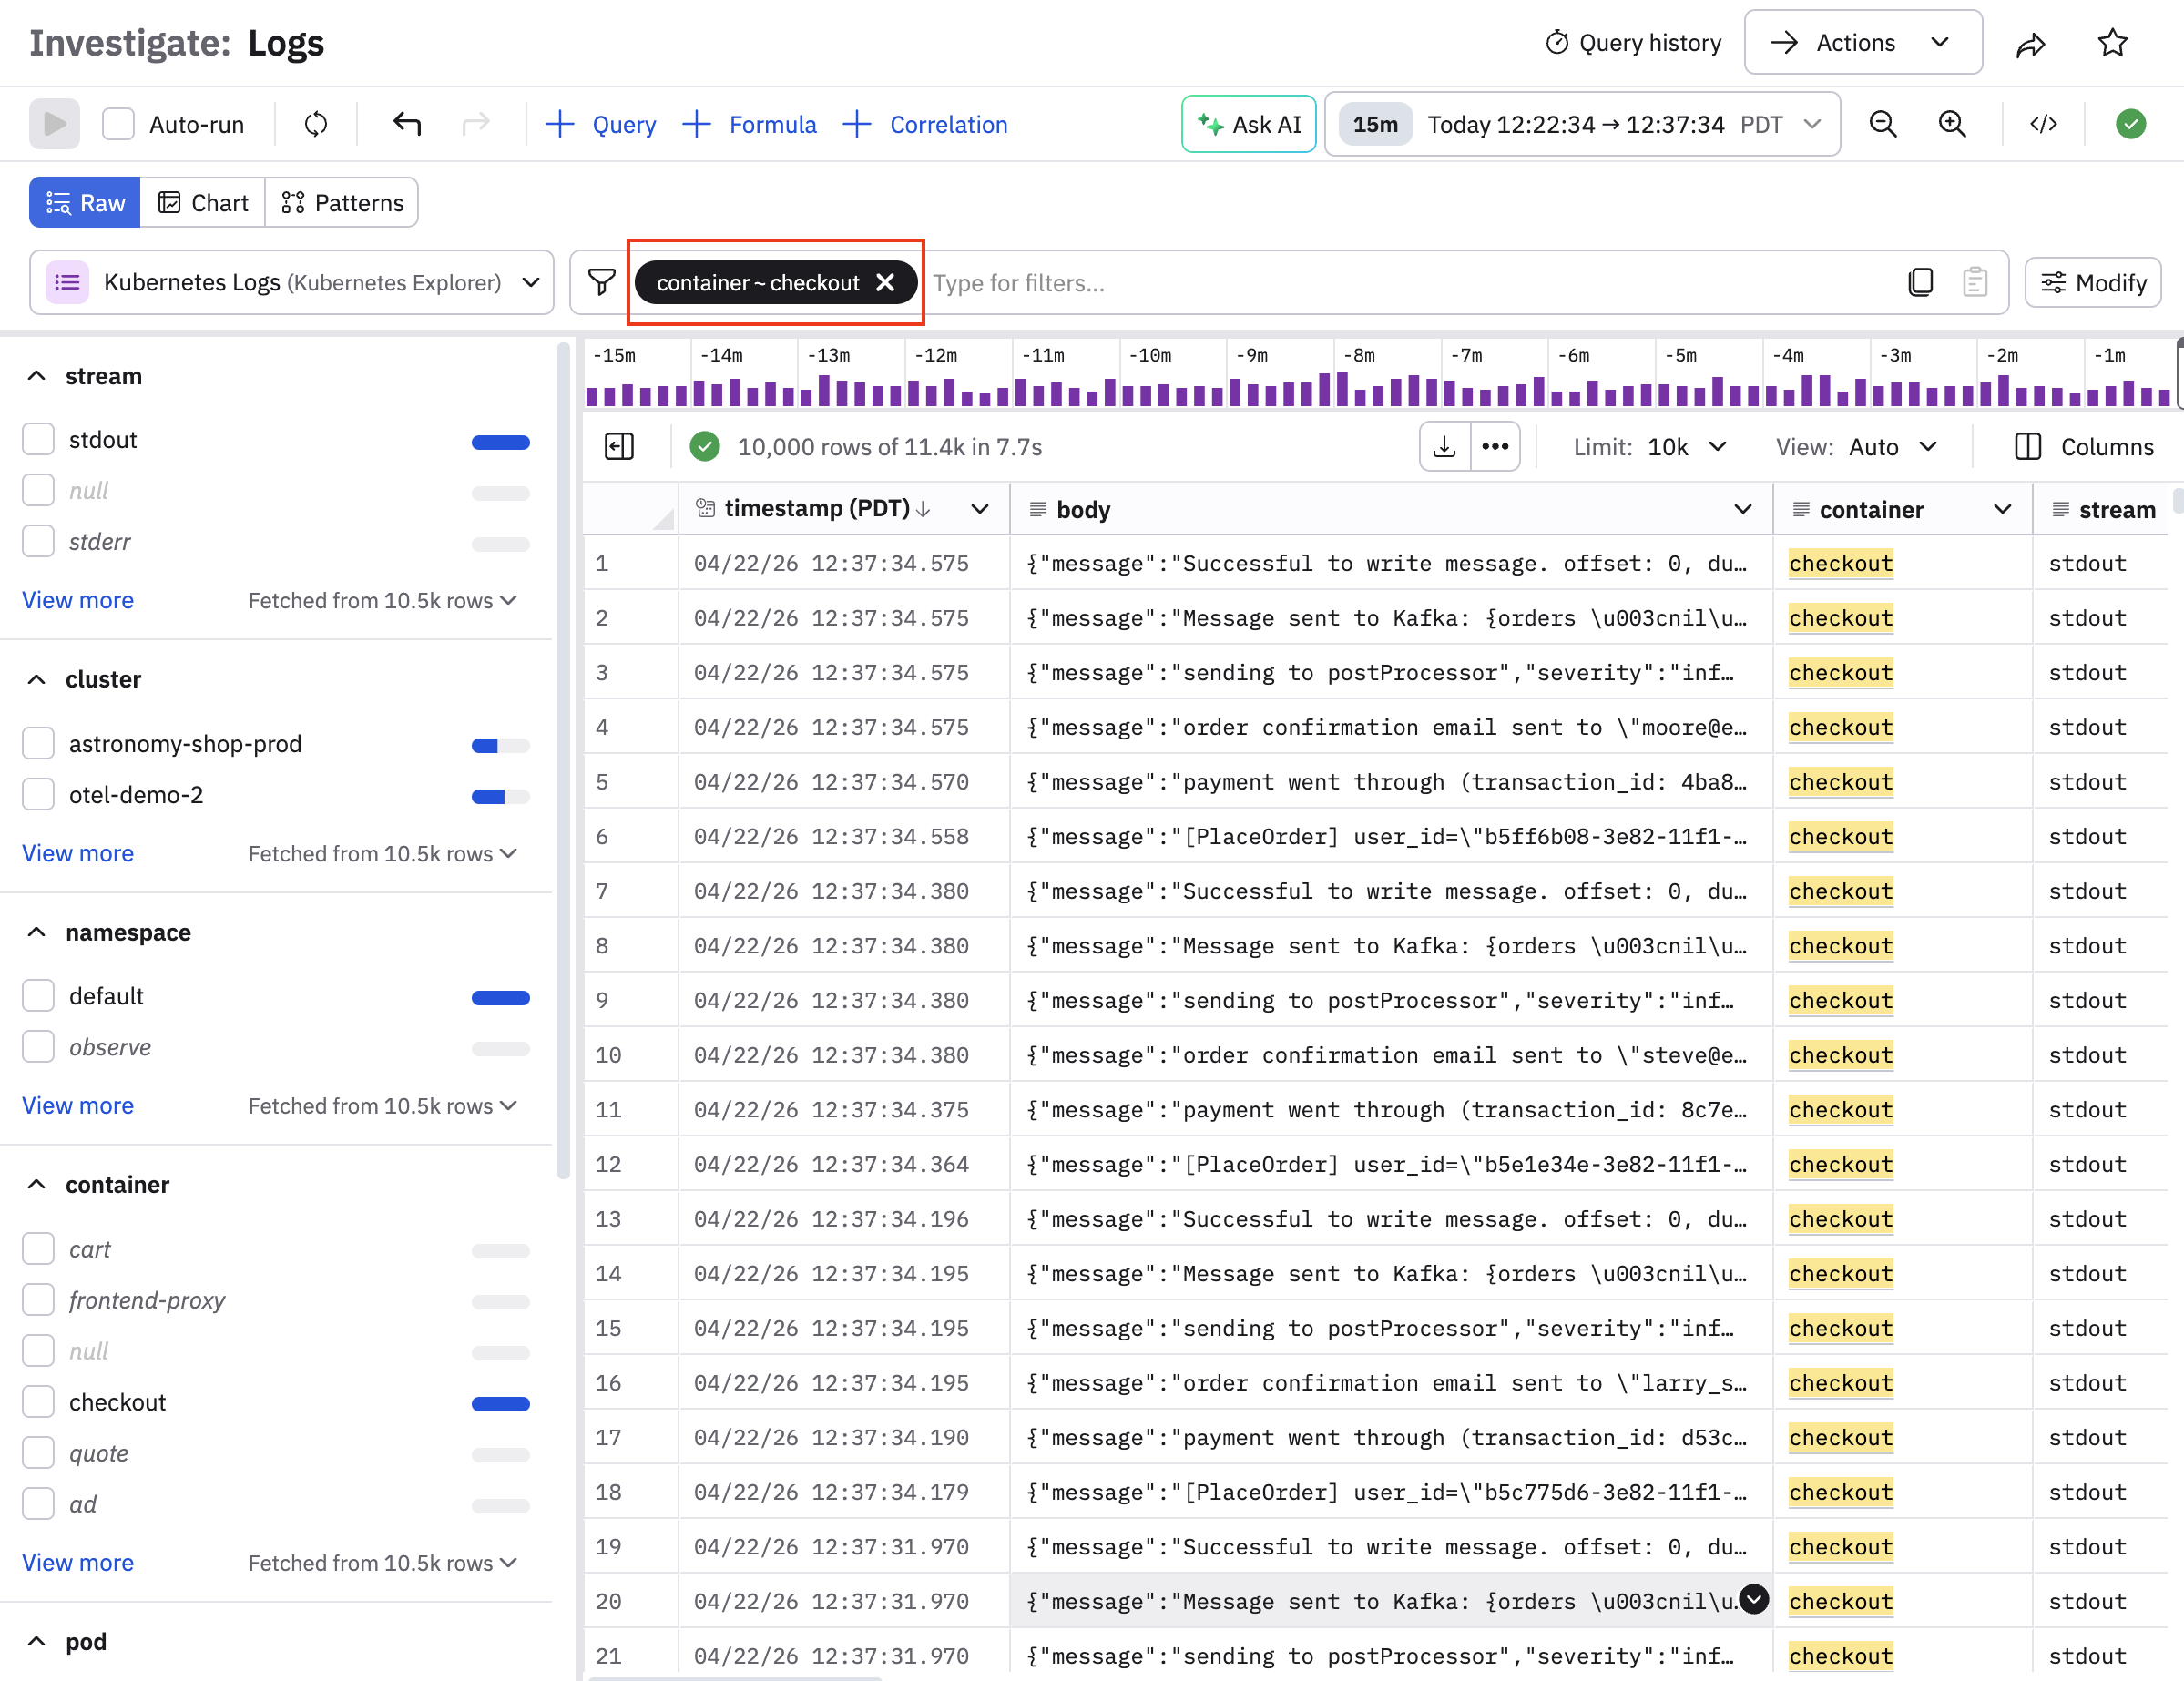
Click on any row number in the list of entries to open a side panel where you can inspect the entry's fields, links, and logs:
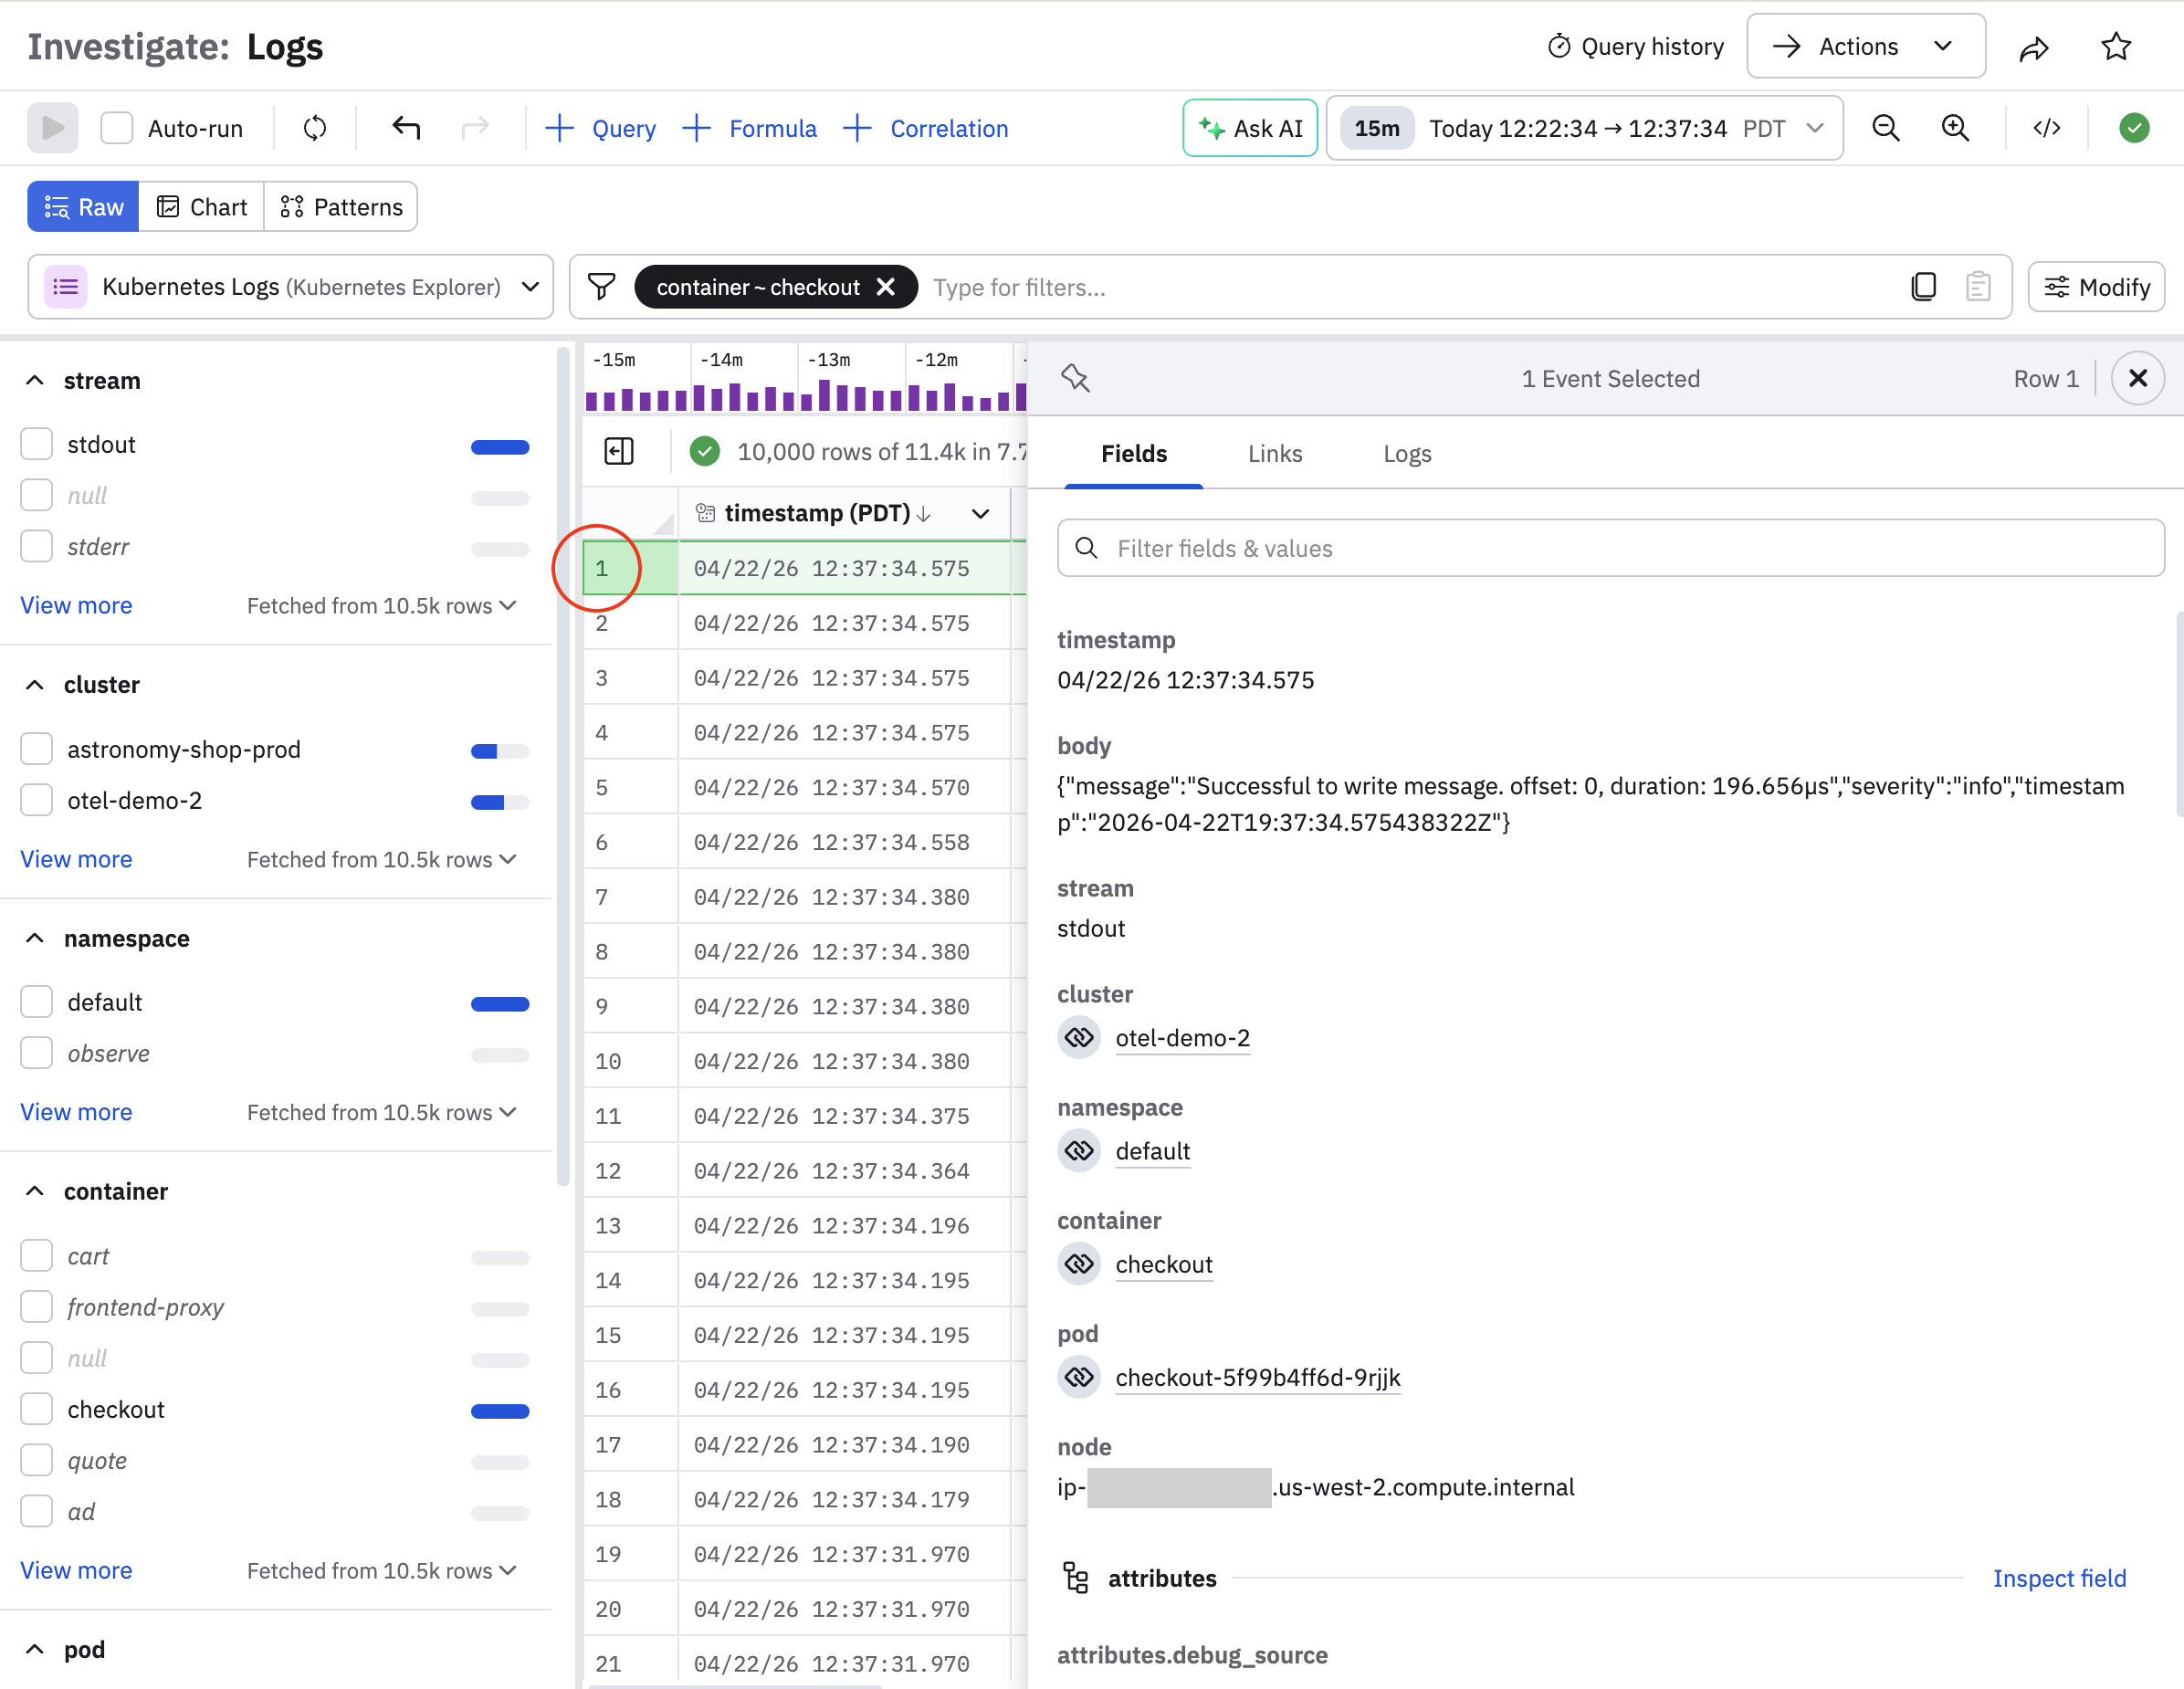
Scroll down the panel to display more information. Open the Links tab to open the Resource page of a given item.
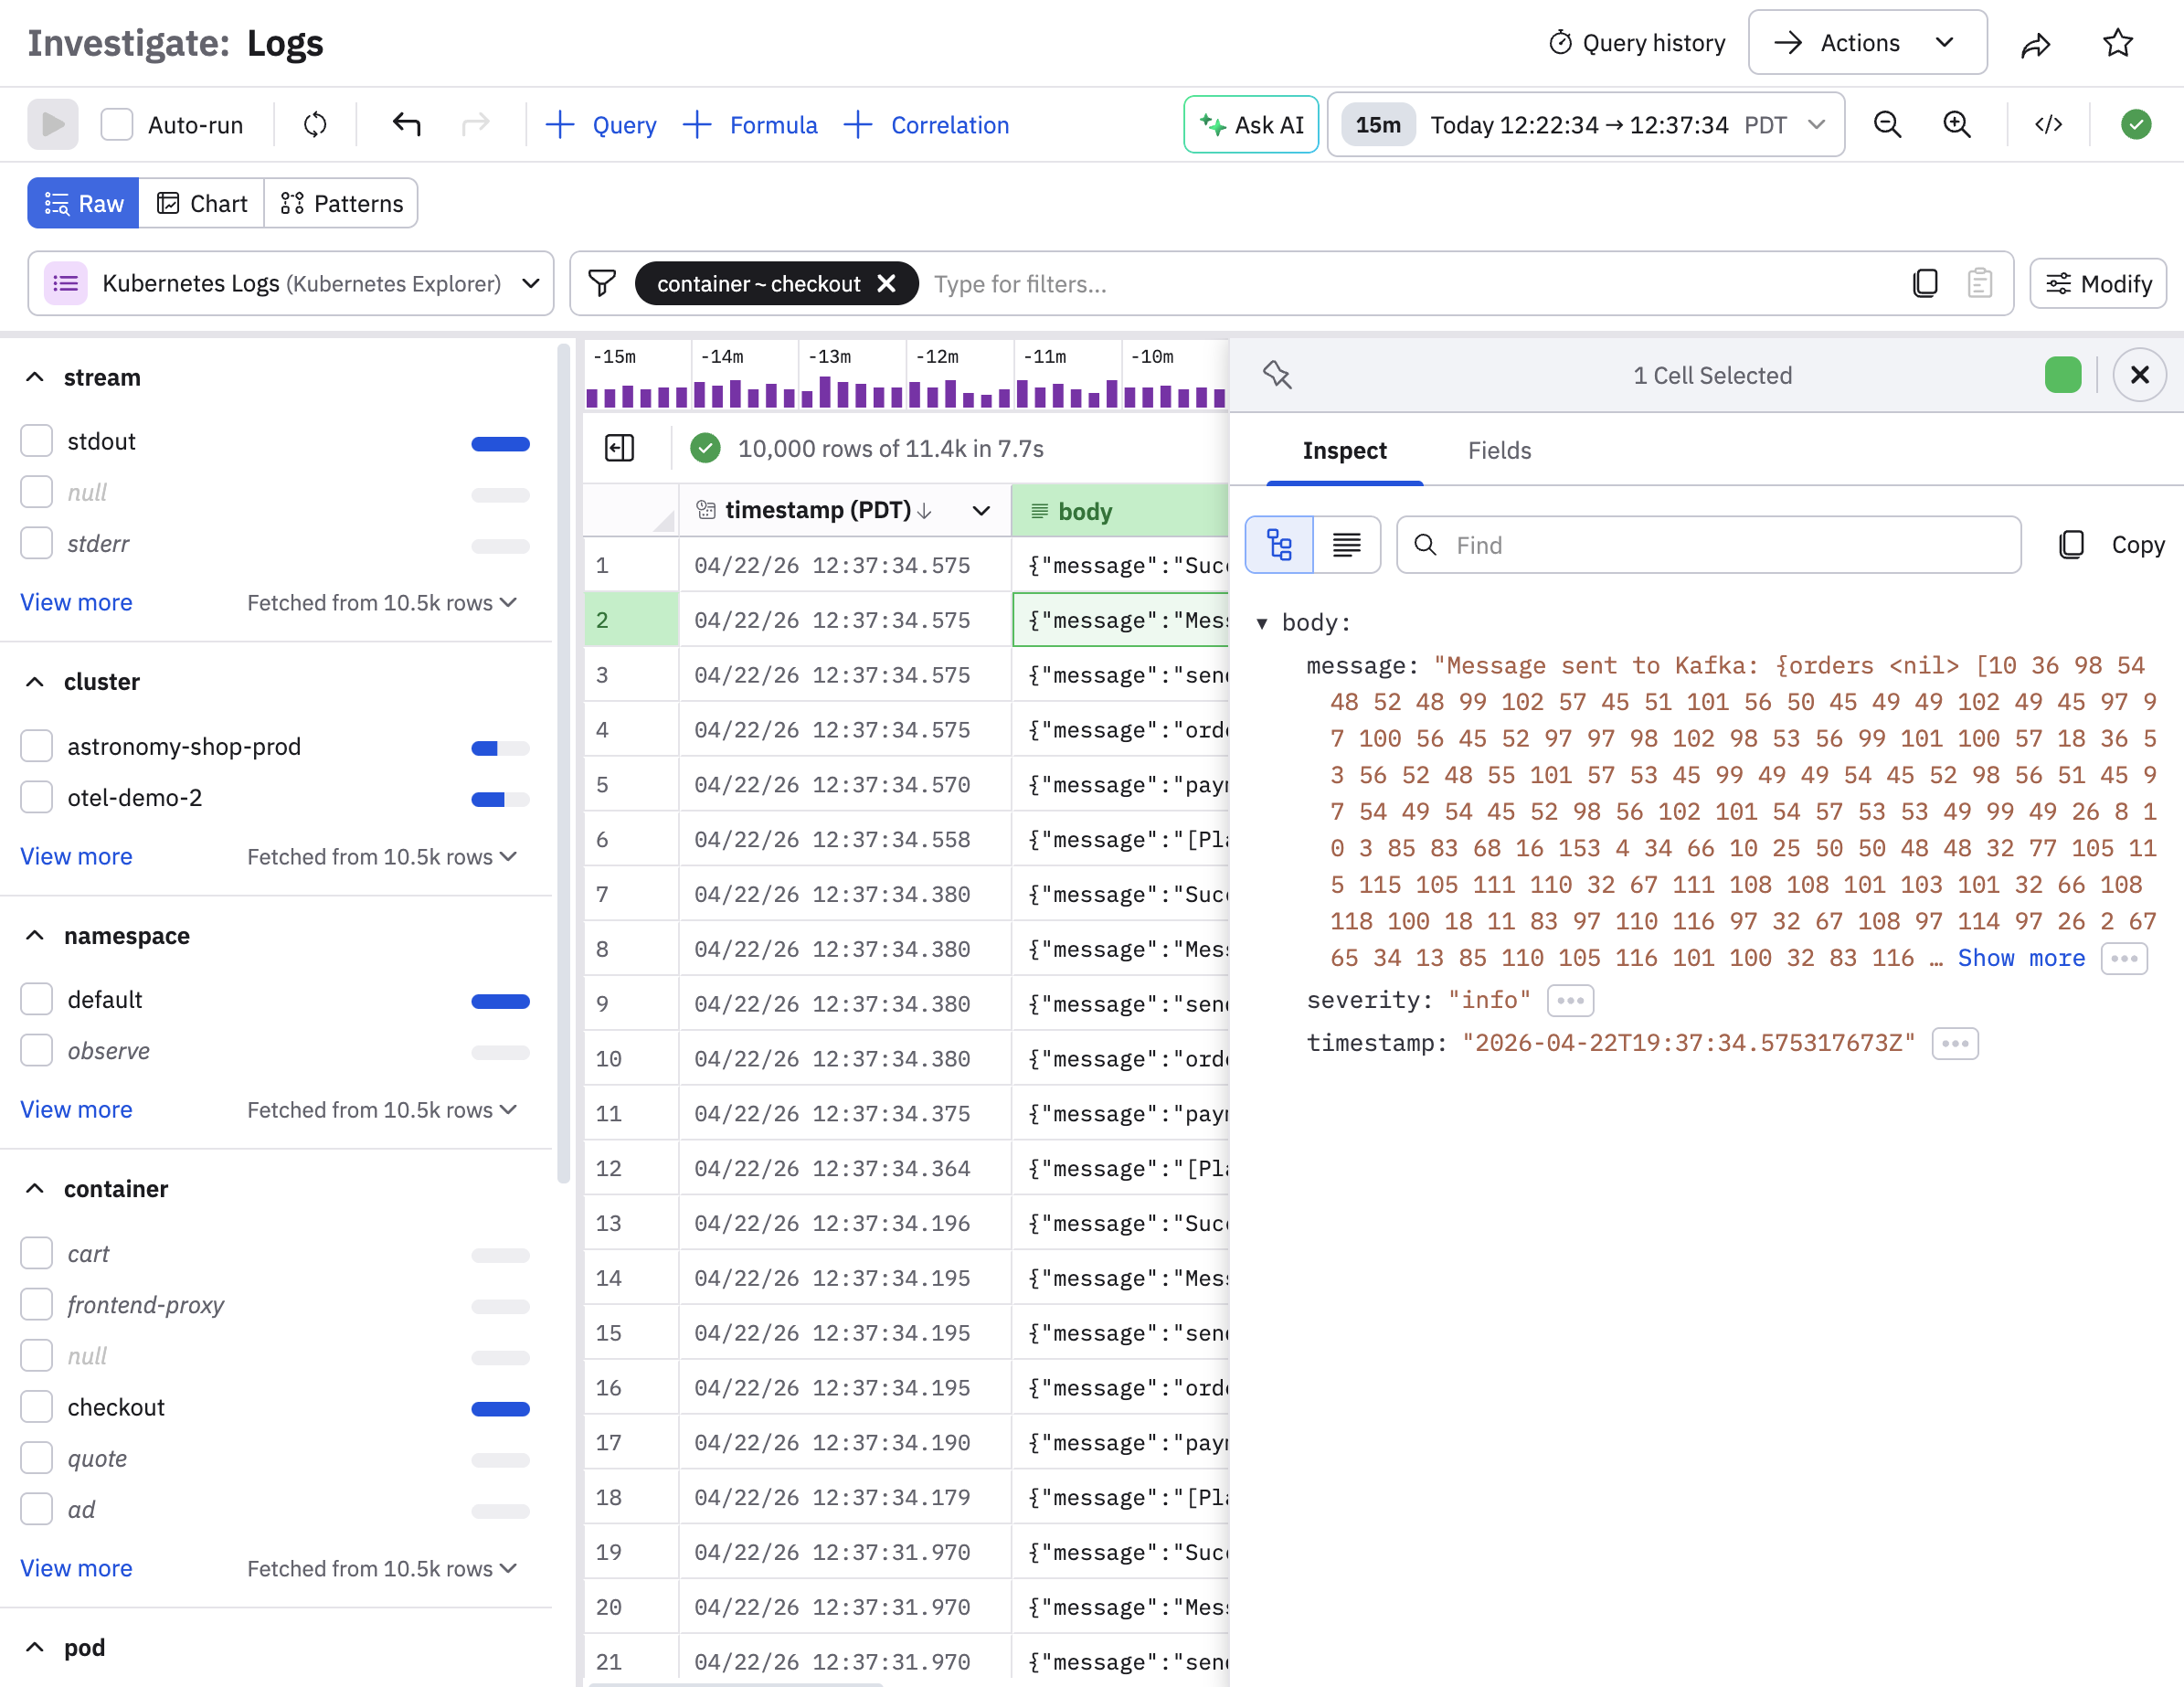
You can also right-click in any cell, or click the down arrow icon () and select Inspect to view the complete contents of that cell:
Log Explorer overview
This section provides an overview of the components in the Log Explorer.
Find and select a Dataset
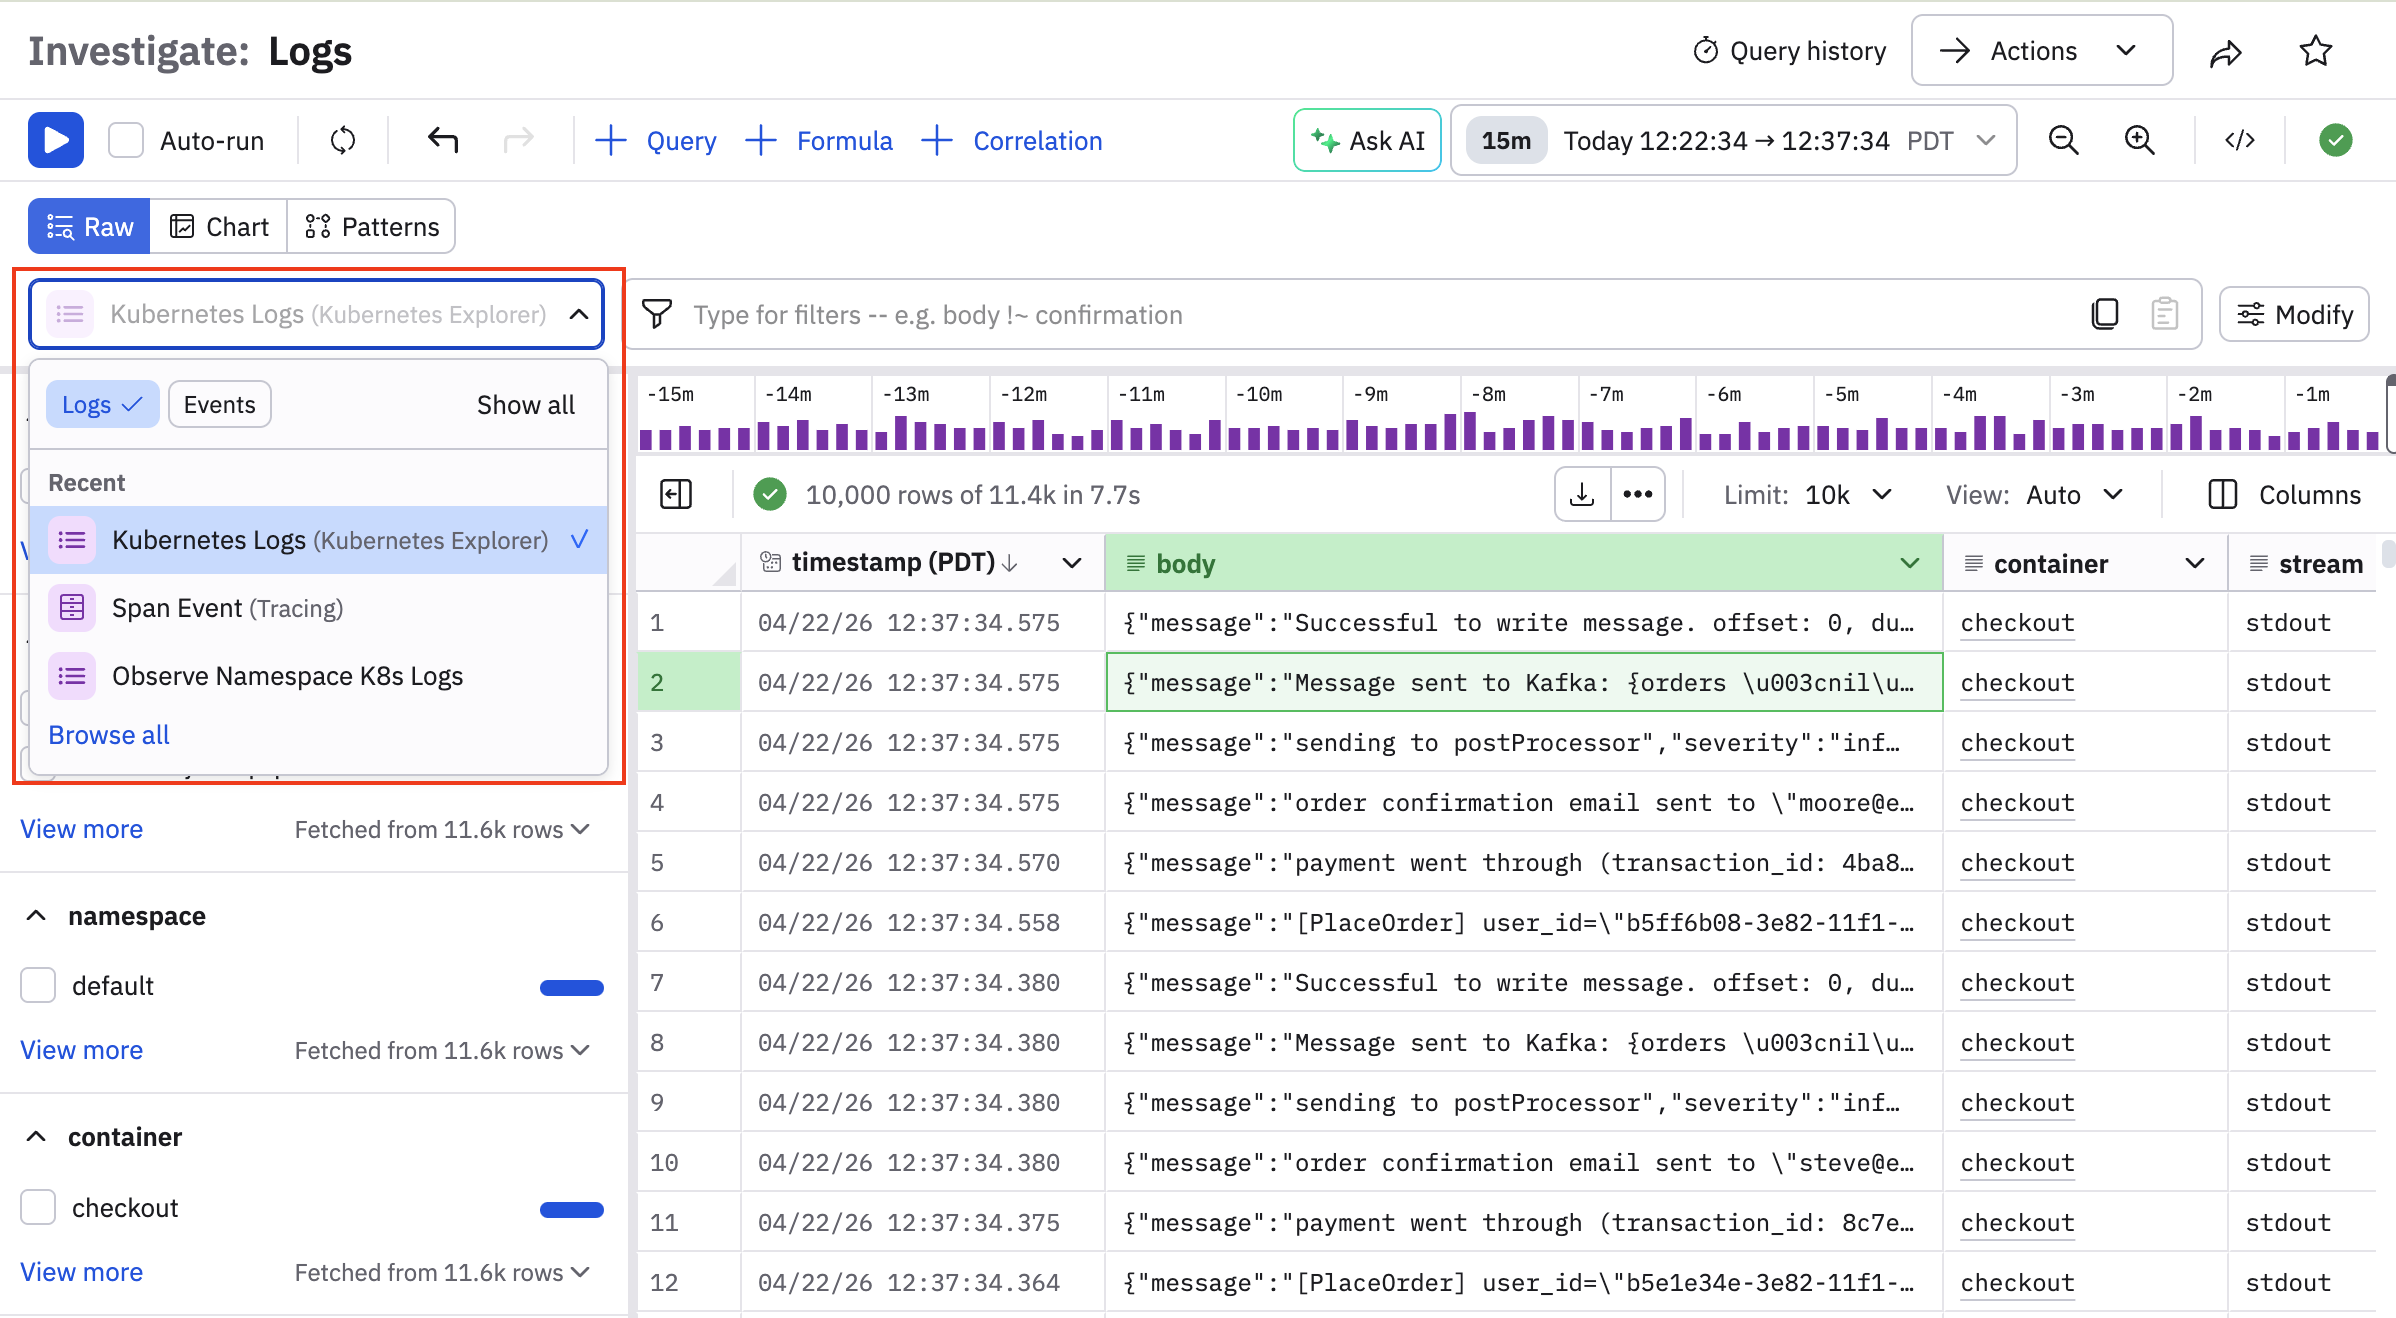
The log selector in the Logs panel shows the most recently accessed Logs Dataset. You can click on the name of the Dataset you want.
If you don't see the name of the desired Dataset, you can click on the View all link, or use the search field to find the Dataset you want. You can also search for a specific Dataset using the drop-down menu, which also provides View all and search capabilities.
Use filters to narrow the scope of the logs you see
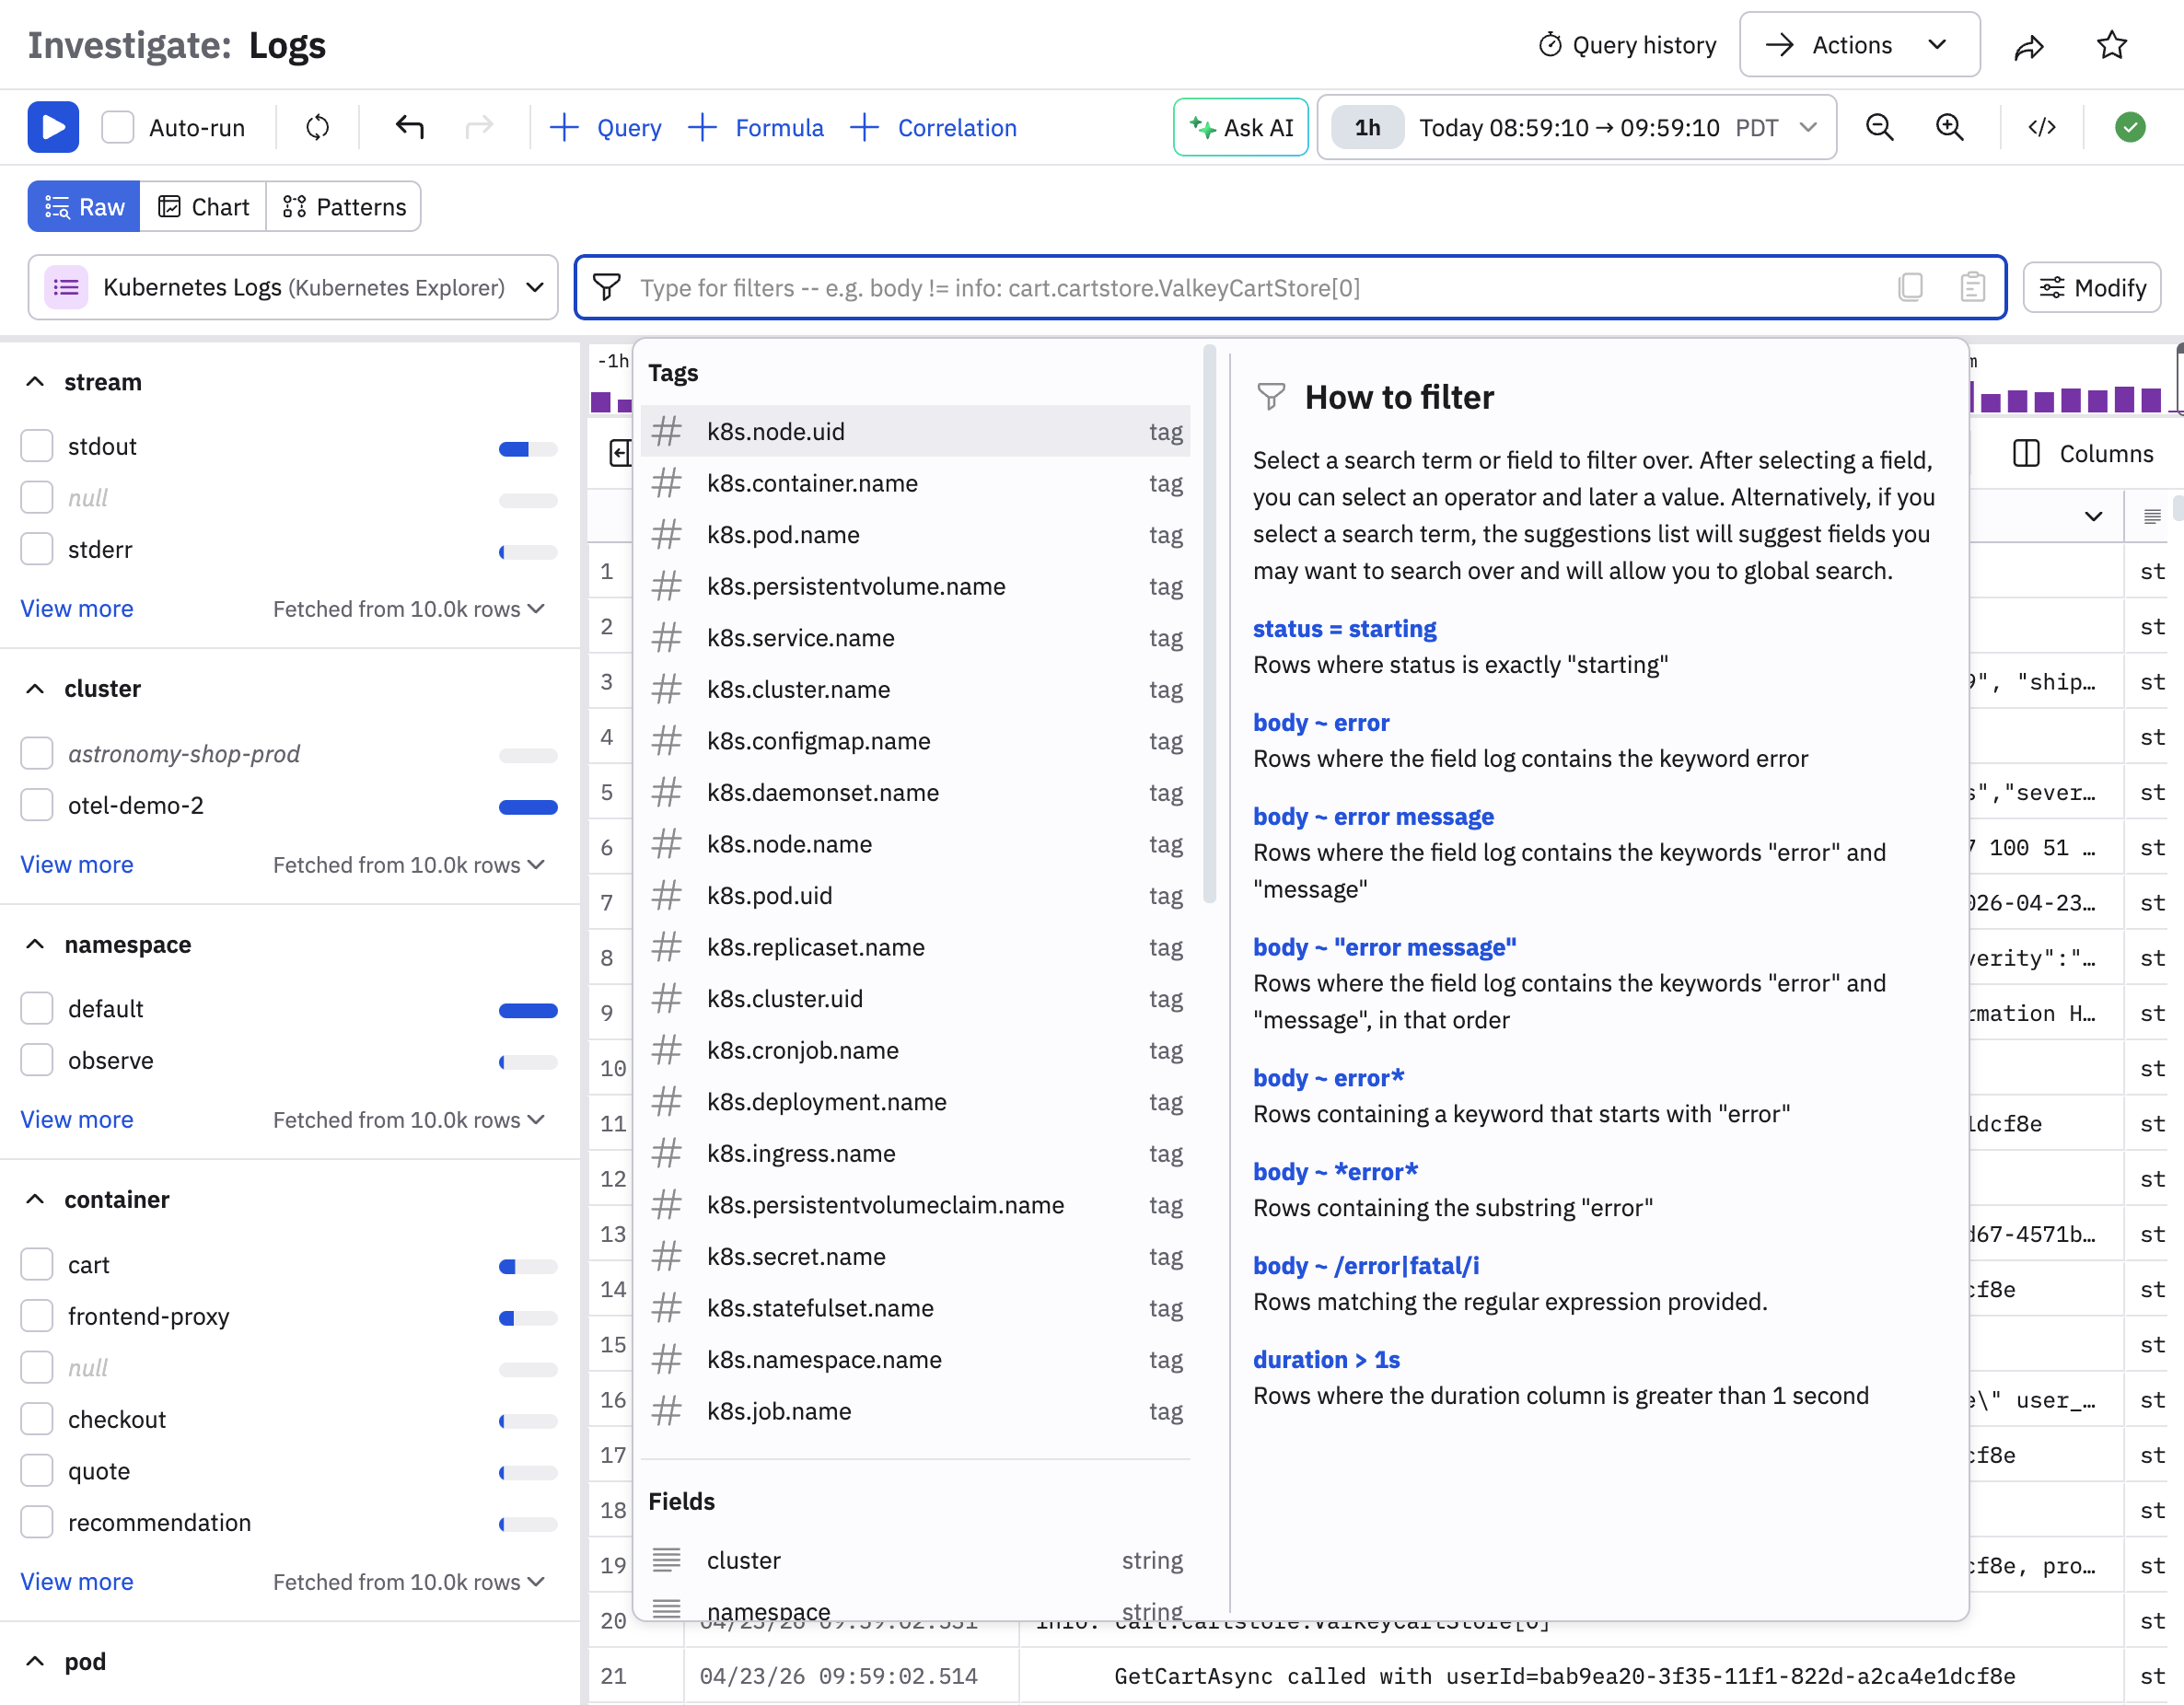
The left menu also displays a list of filters to use with the currently selected Logs Dataset. When you select a filter, the filter also appears in the query builder:
You can build filters by clicking in the query builder and selecting from a dropdown list of tags and fields. See Unified search syntax for more information about the search syntax in the query builder.
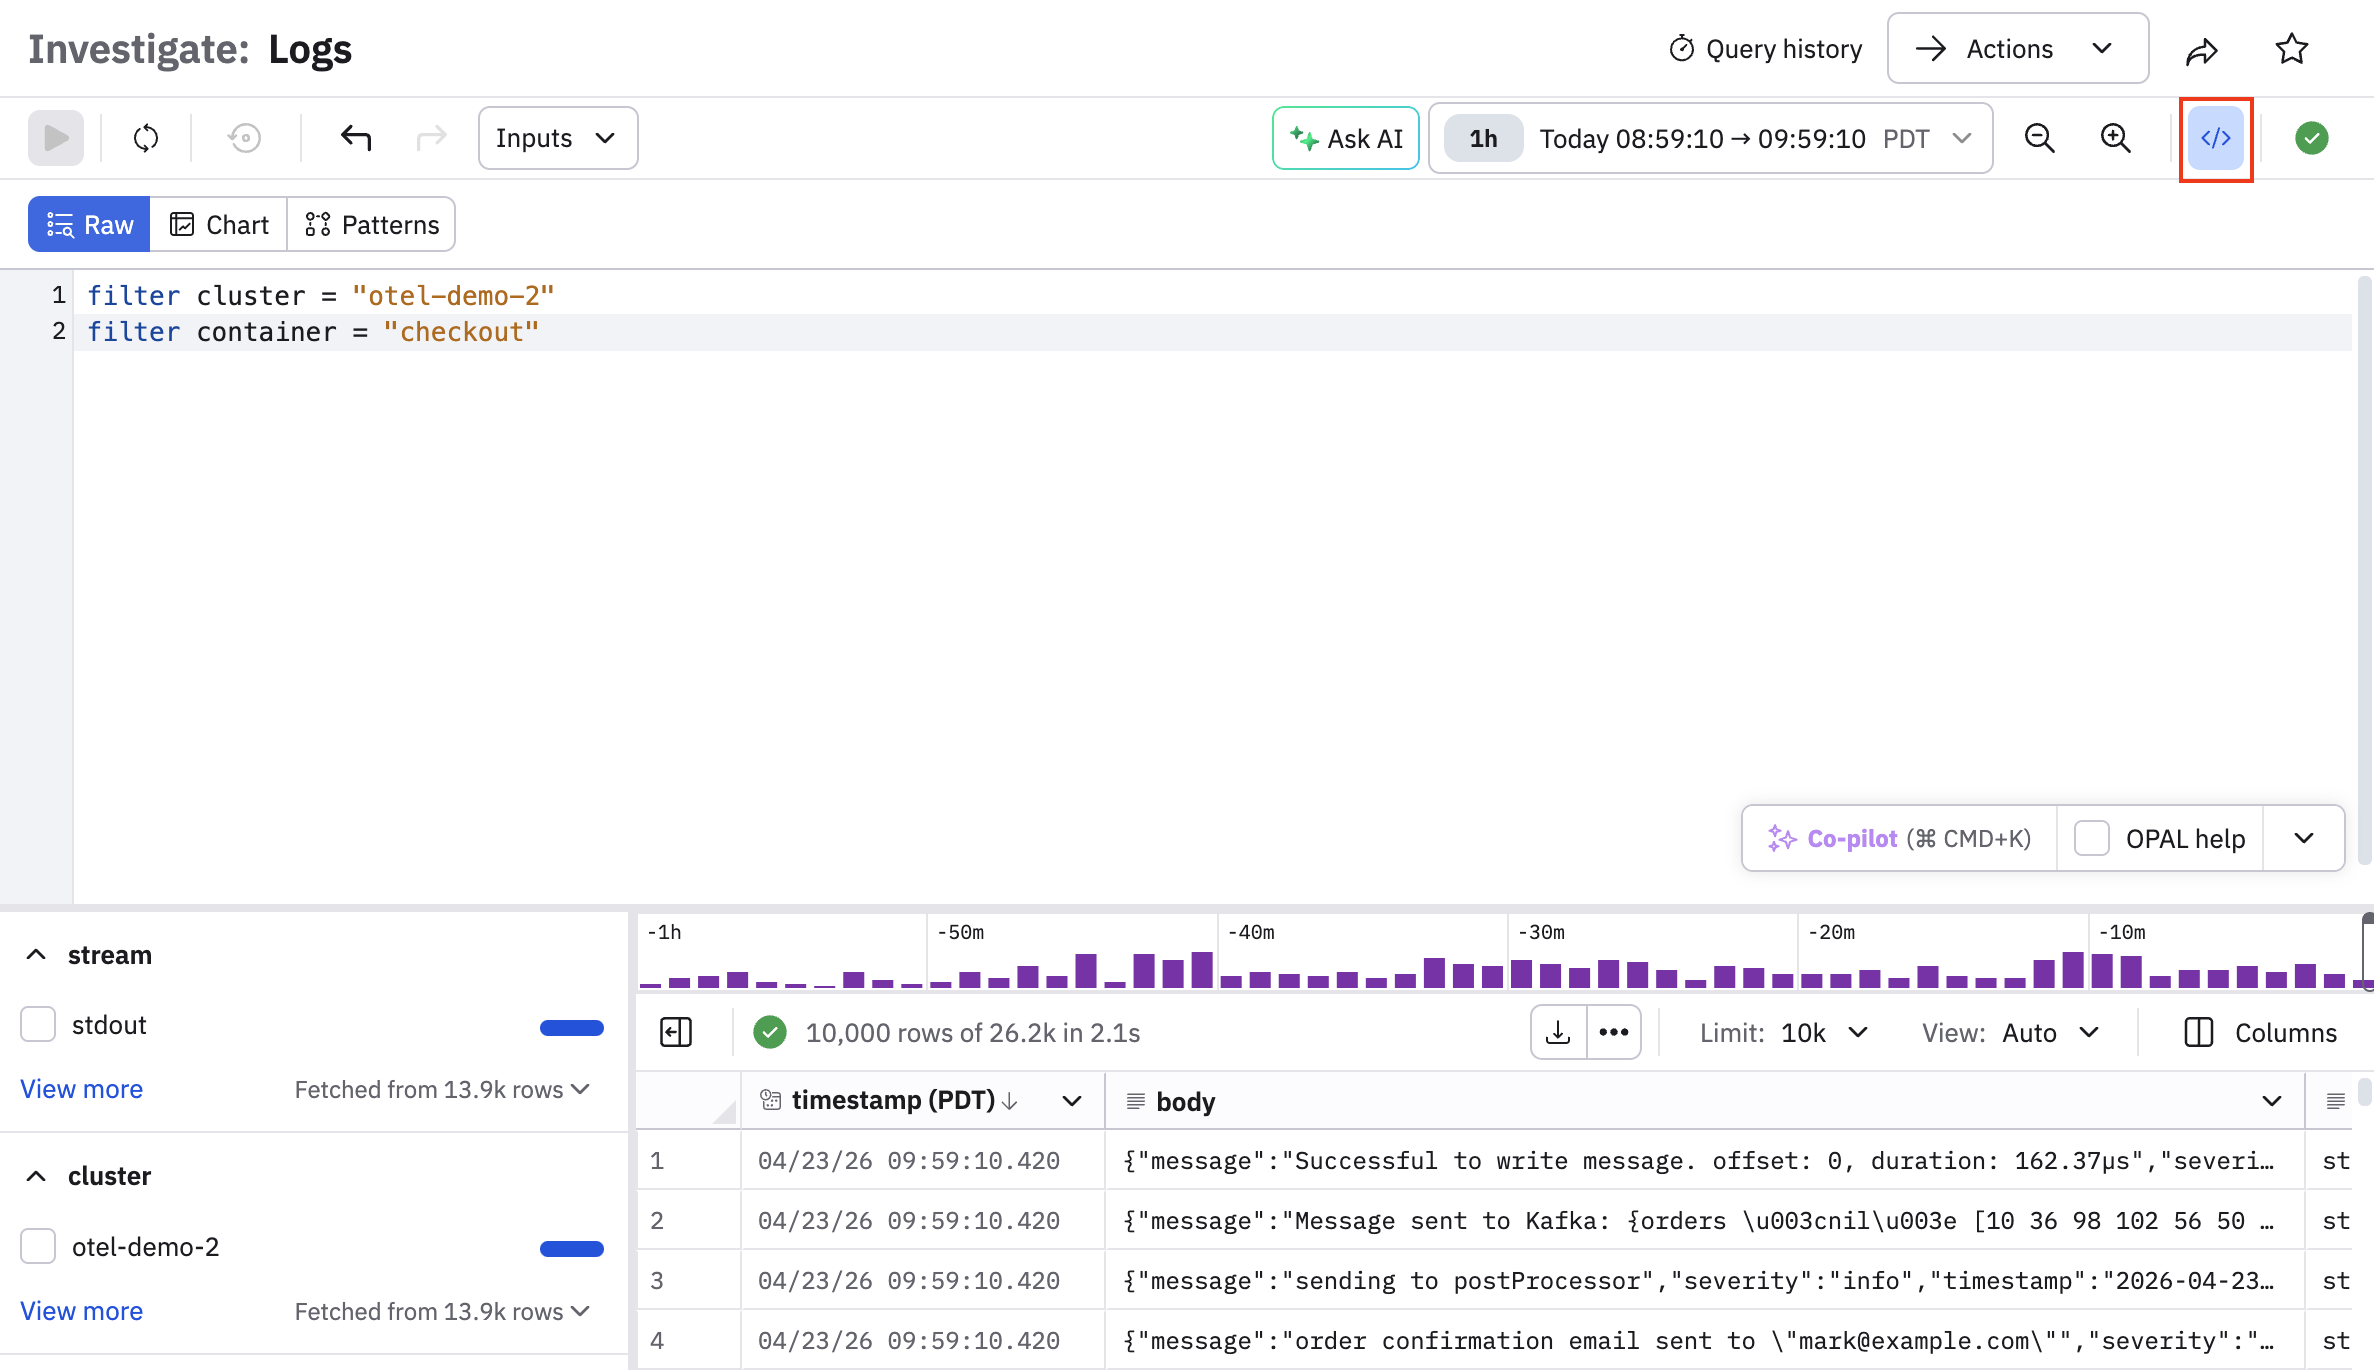
You can also click the code icon () to open the OPAL builder to build your queries using OPAL.
Format columns and cells
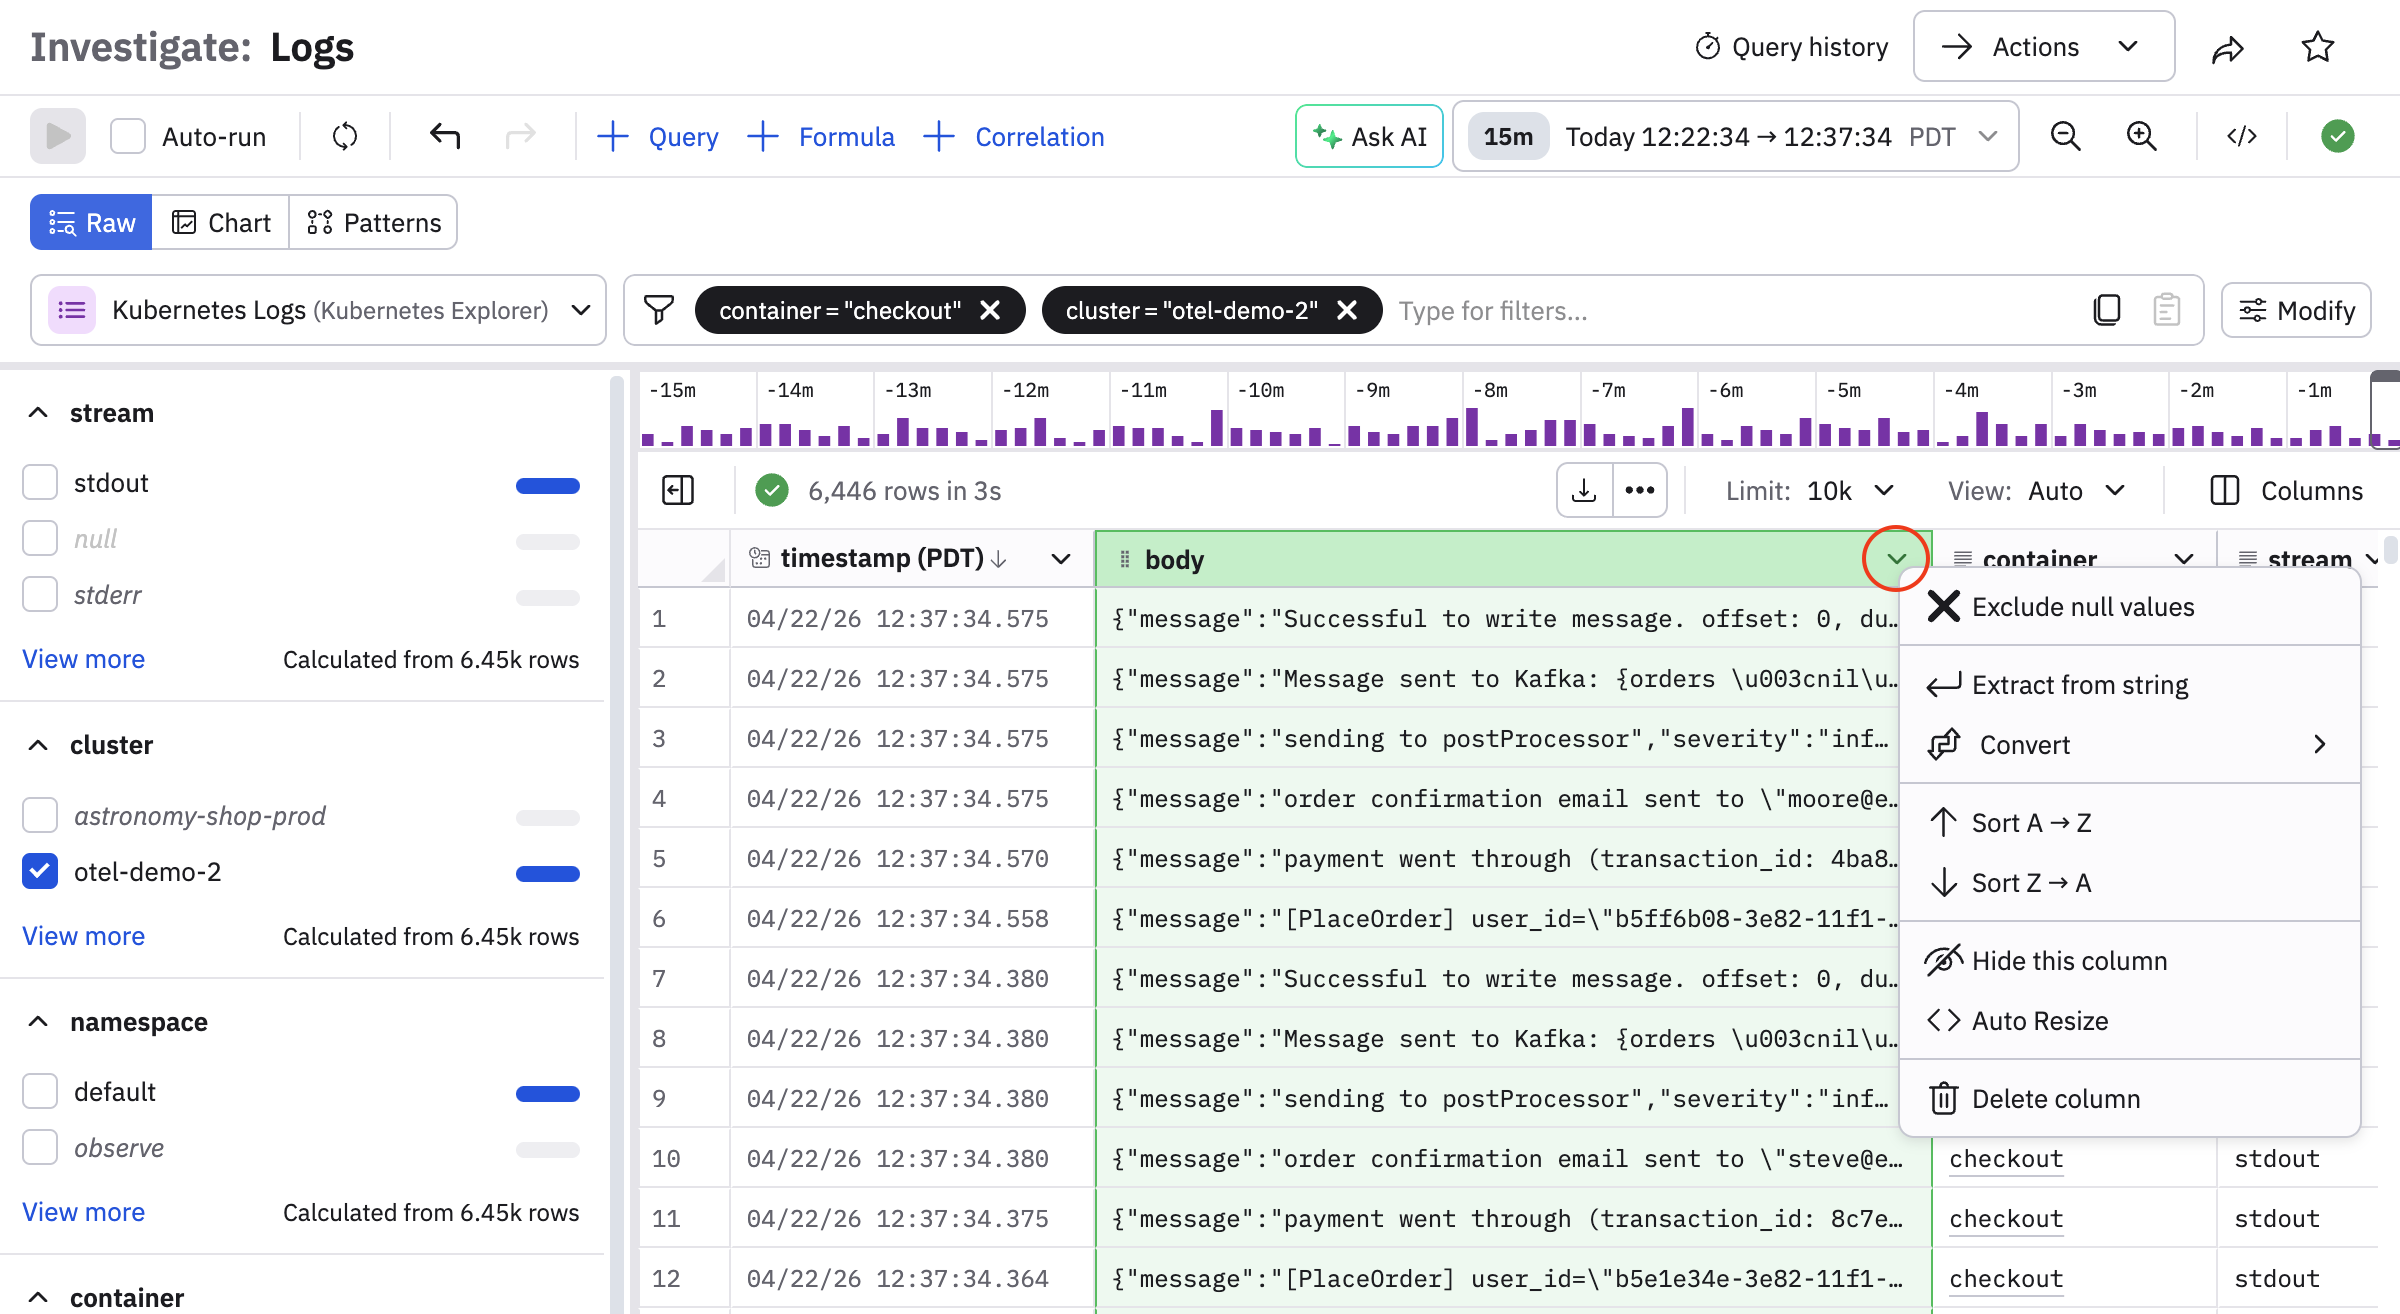
You can use column formatting tools to filter, sort, and visualize the data. Use a context-click on the column header to display options for working with data in a single column. The available options depend on the data type in the column.
| Option | Description |
|---|---|
| FIlter | Filter the column by values in the data (including or excluding). |
| Exclude null values | Remove empty cells from the column. |
| Create summary | Add a summary of the data in a column. |
| Extract from string | Extract parameters depending on the type of string. This may use O11y GPT features if enabled. |
| Sort | Lexical, numeric, or time sorting in ascending or descending order based on the column data type. |
| Conditional formatting | Apply color and style to string or numeric column types based on conditional formatting rules. |
| Hide column | Hide the column from view. This does not affect the query or Dataset. |
| Auto-resize | Adjust column width to optimize display on your screen. |
| Convert | Cast a column to a different data type. |
| Add related field |
|
You can also use context-click on a single cell to work with its data. The available options depend on the data type in the column:
| Option | Description |
|---|---|
| Show surrounding data | Adjust the time filter to focus on a time range based on this column's timestamp. See Show surrounding data. |
| Copy | Copy the value to clipboard. For most data types this will be a simple copy. For datetime columns, you have options such as locale or ISO 8601 formatting. |
| Extract from string | Extract parameters depending on the type of string. This may use O11y GPT features if enabled. |
| Explain this message | Use o11y AI features (if enabled) to open an o11y AI chat window and explain the message. |
| Inspect | Open the right rail with this data formatted for best display, search, and extraction. |
Show surrounding data
Use the Show surrounding data option from any cell to adjust the time filter to focus on a time range based on this column's timestamp:
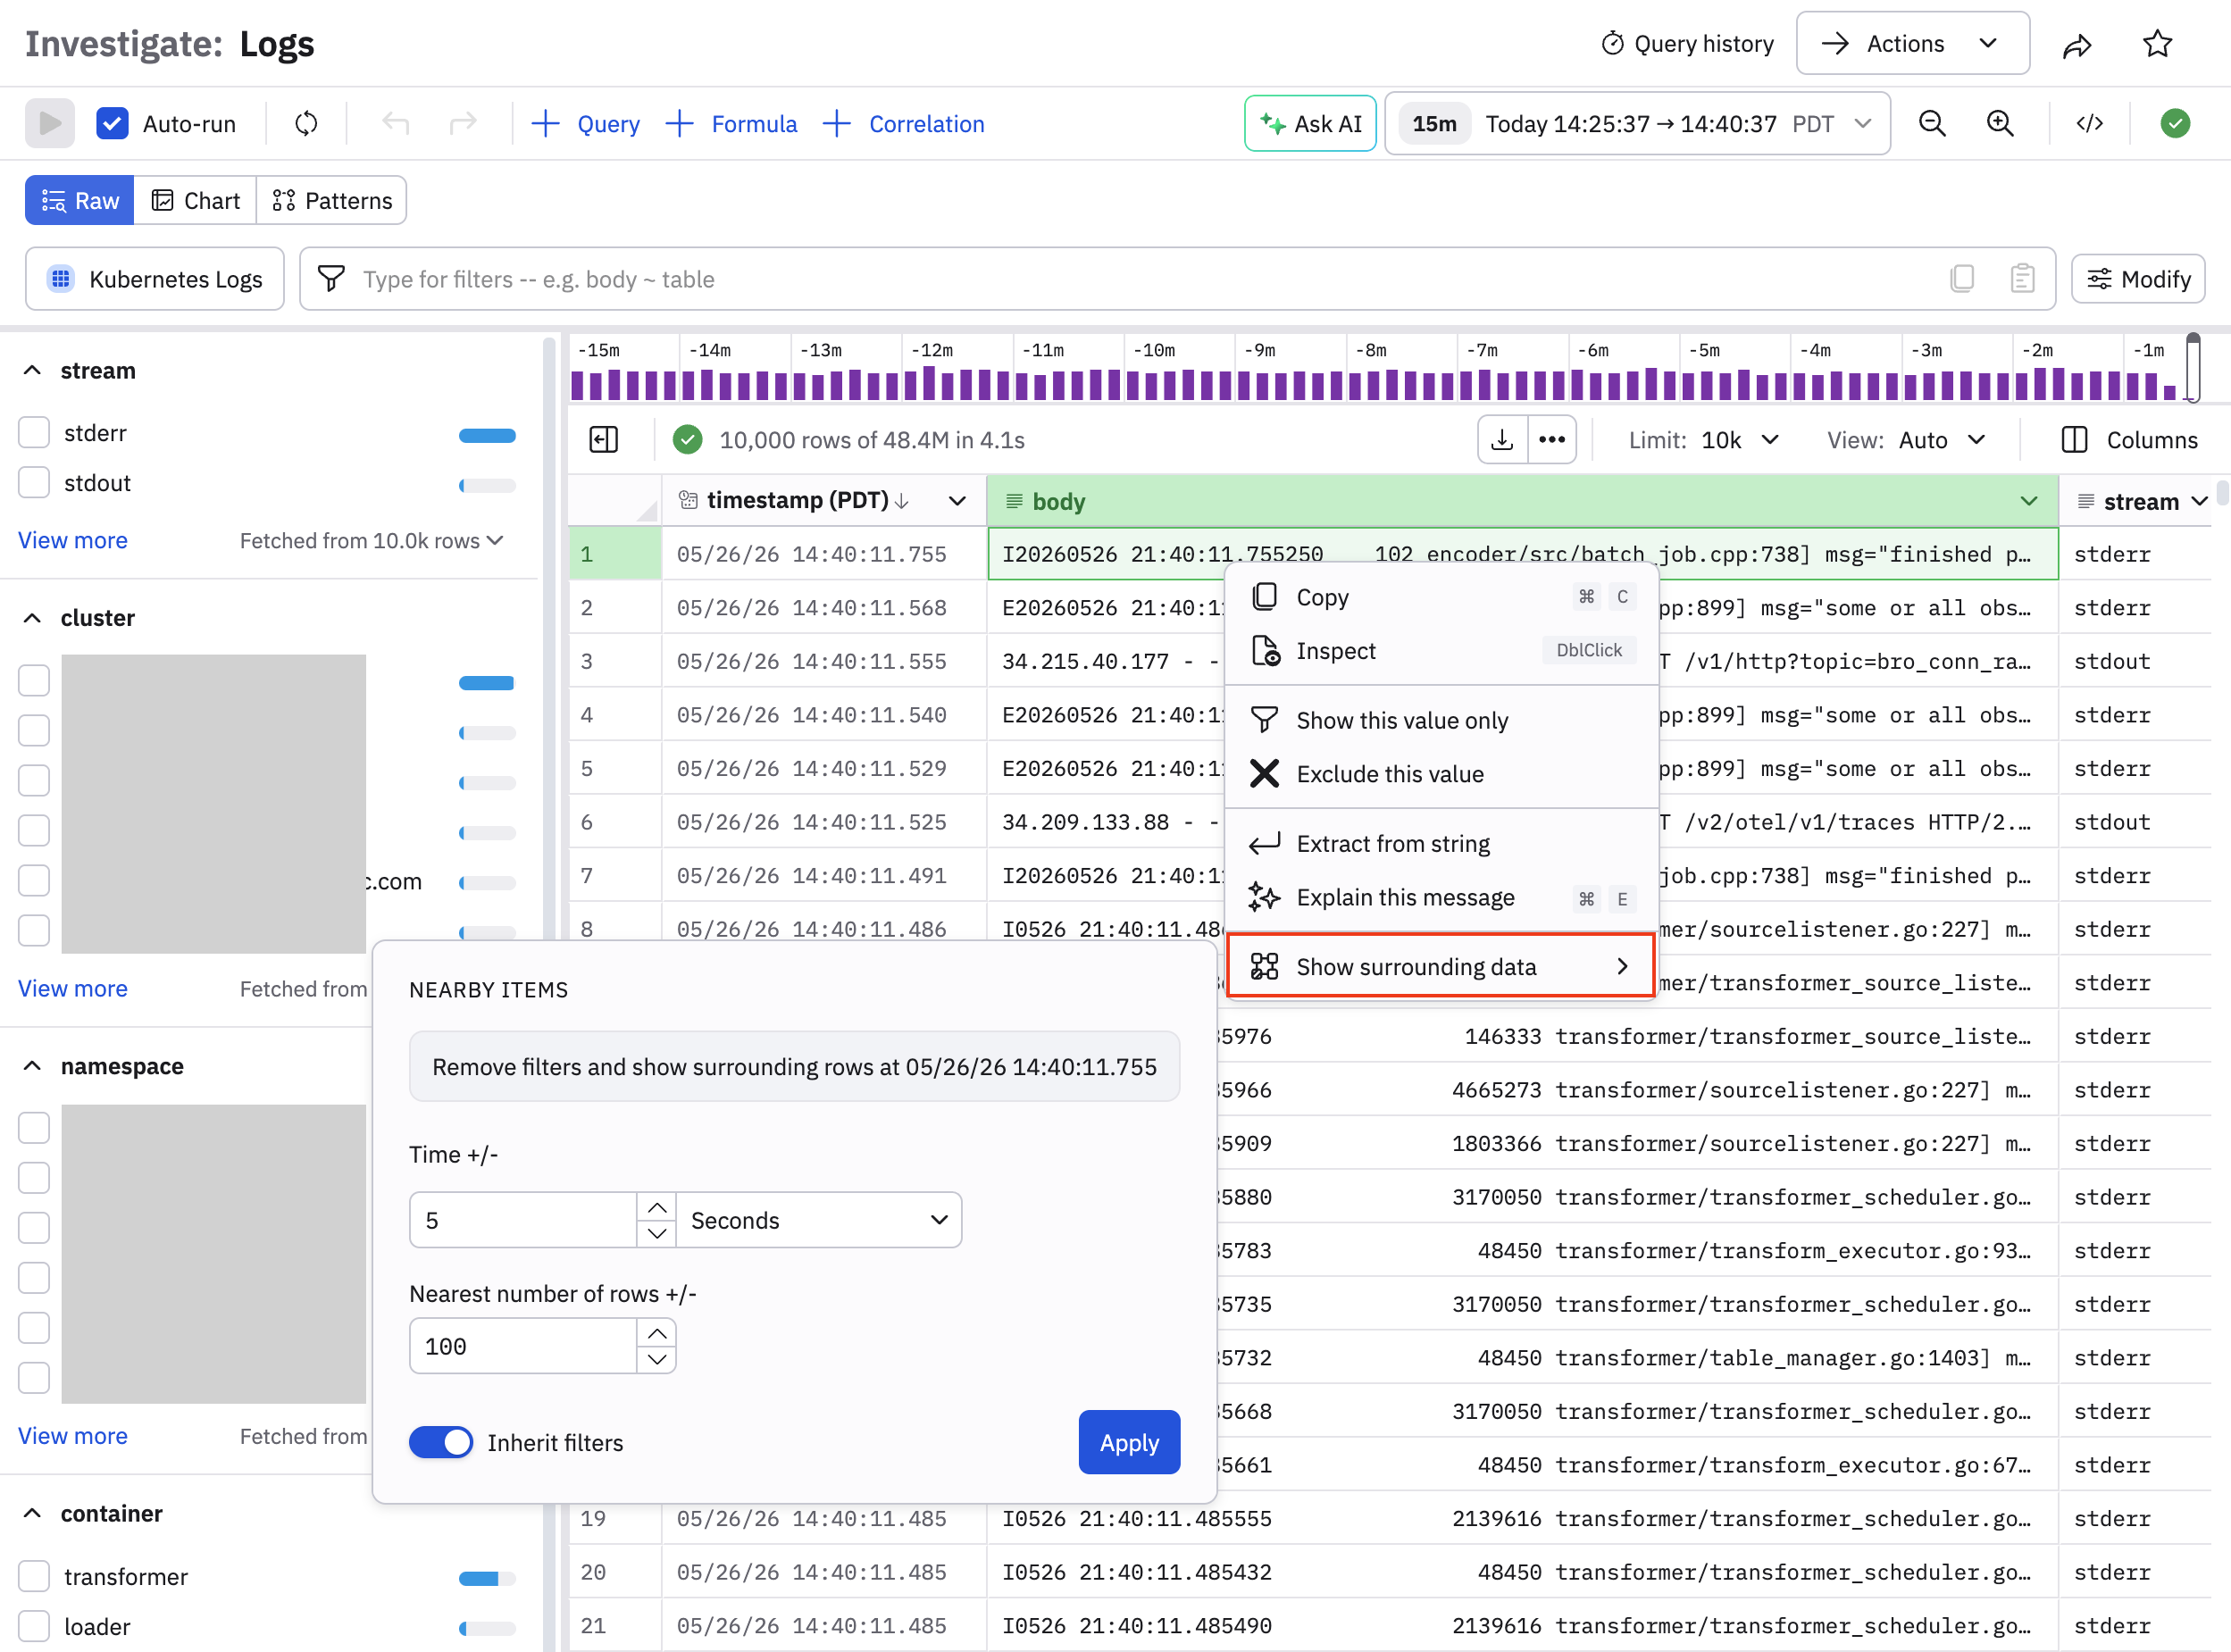
For example, you can go ahead or back 5 minutes, or choose to to include the nearest 100 rows or data.
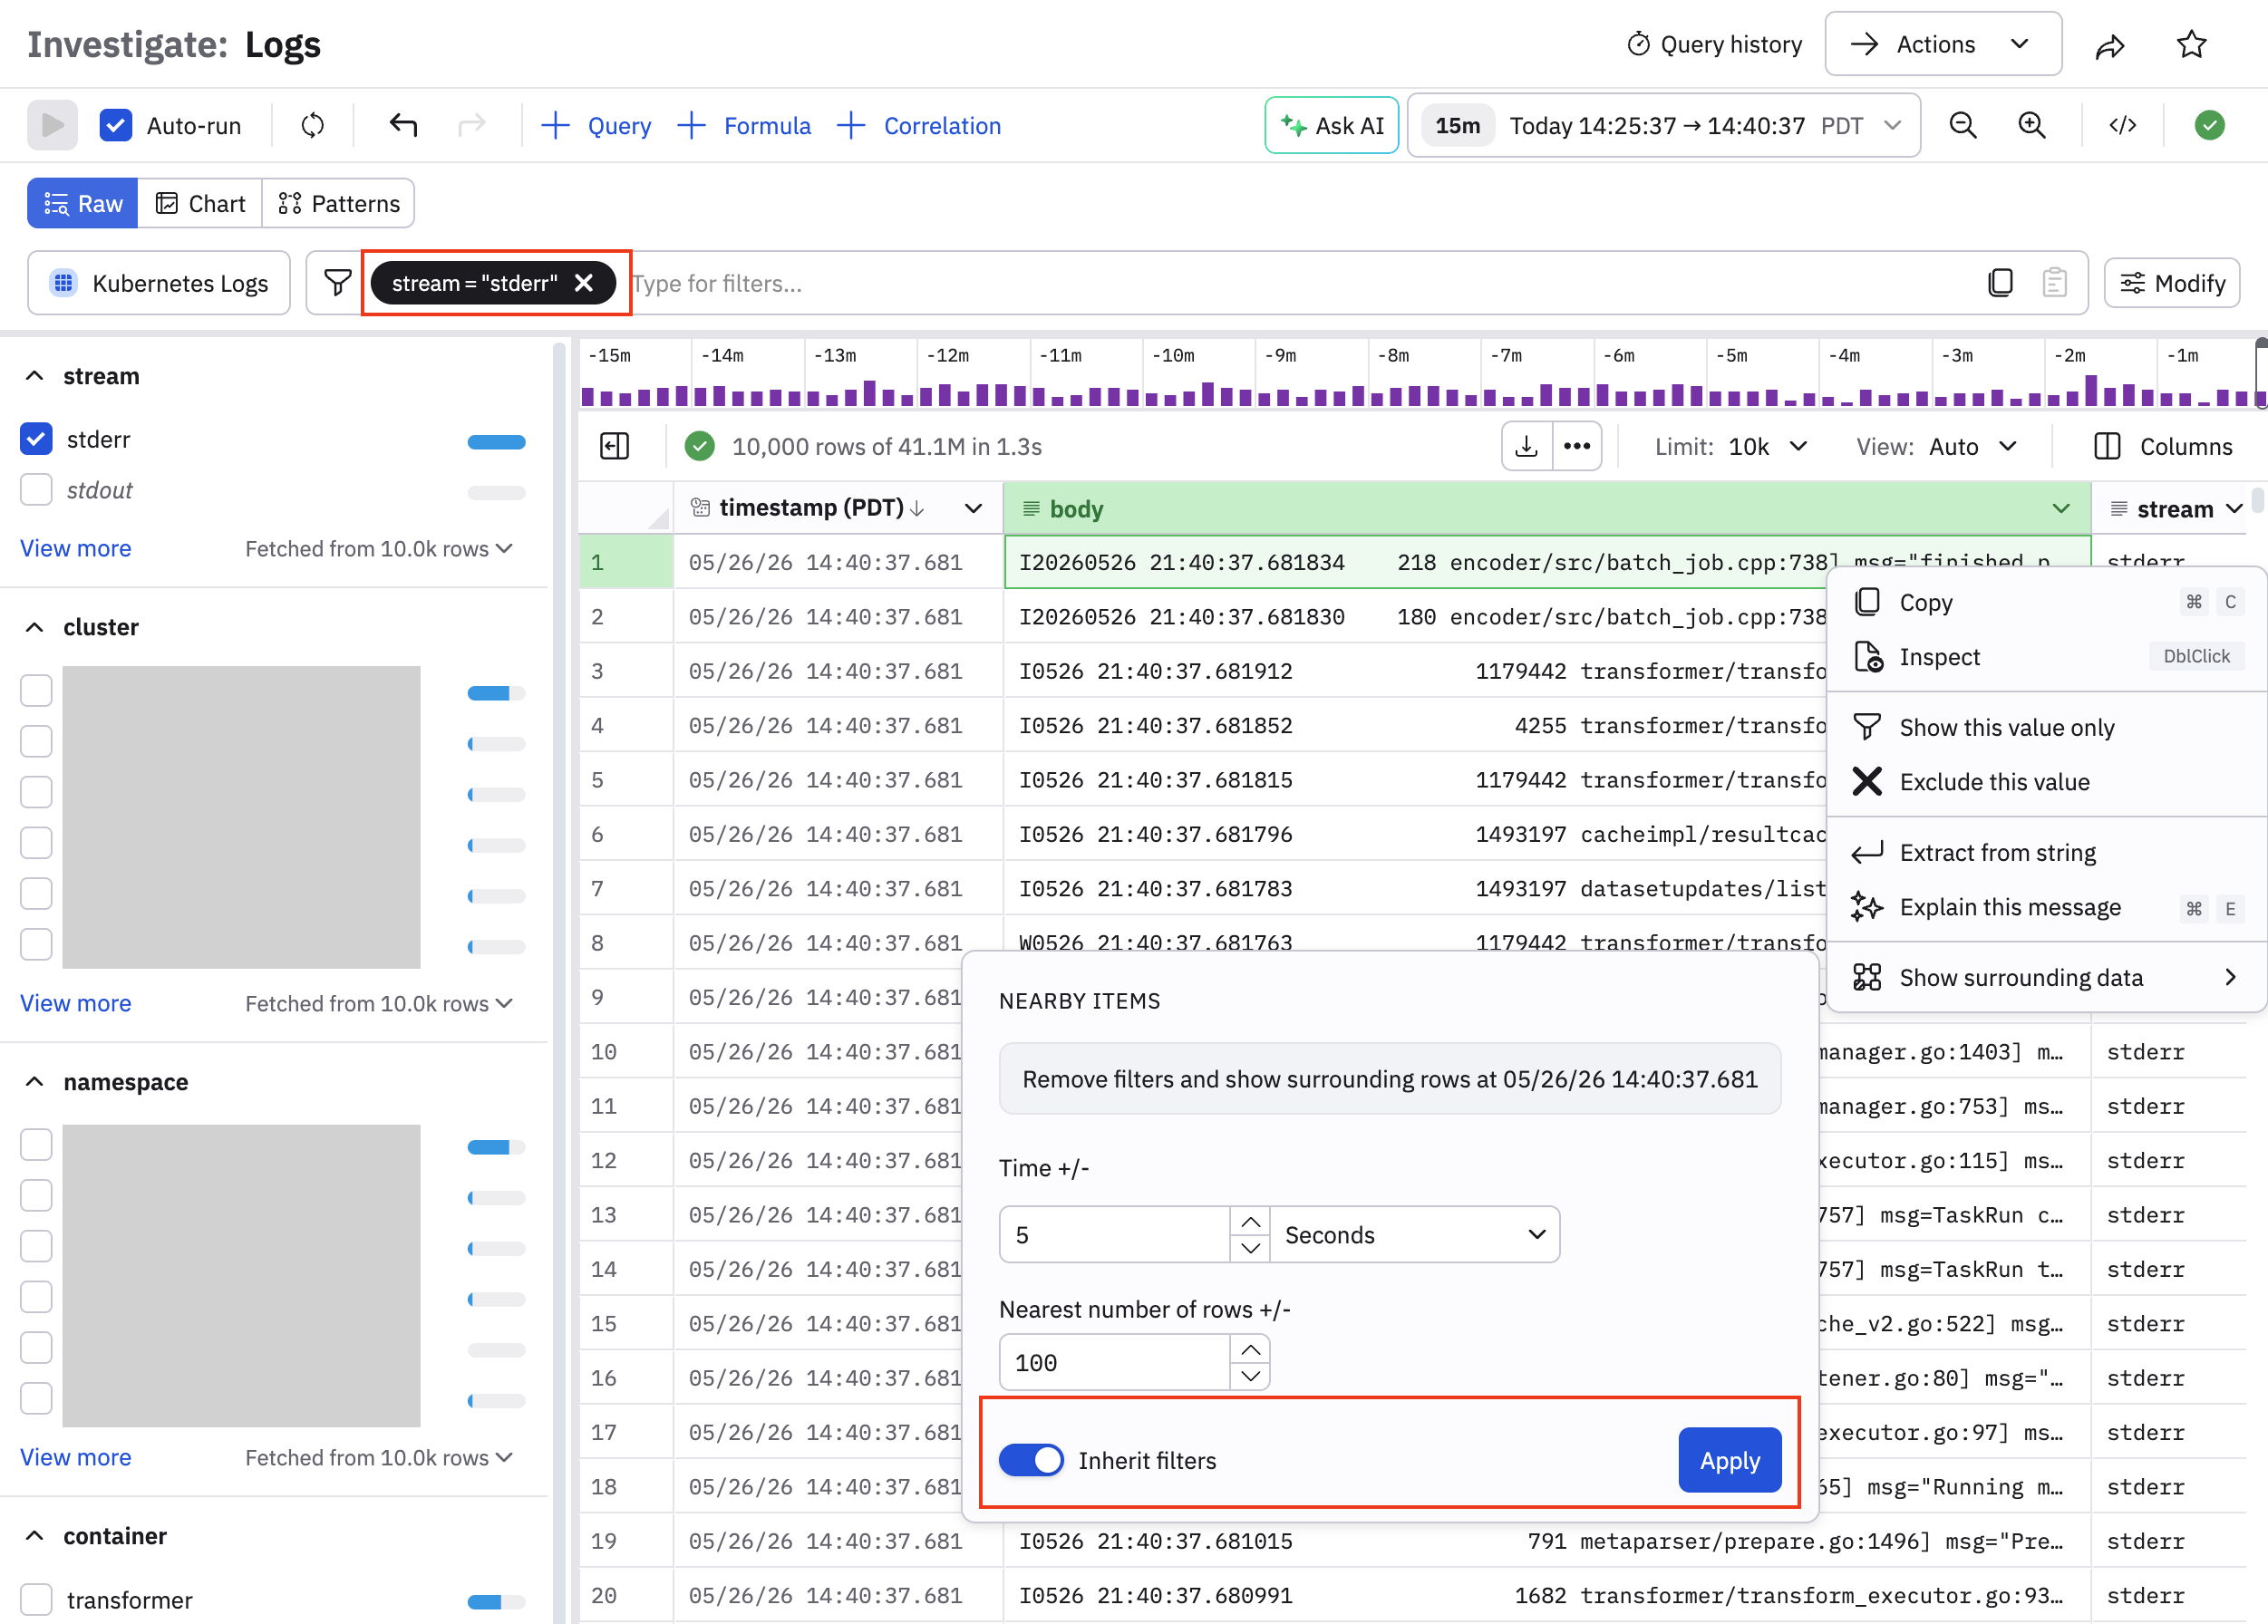
Slide the Inherit filters toggle to the on position as shown to inherit and carry the filters forward to the surrounding data view. For example, suppose we add a filter to view only stderr messages, then enable the Inherit filters toggle and click Apply:
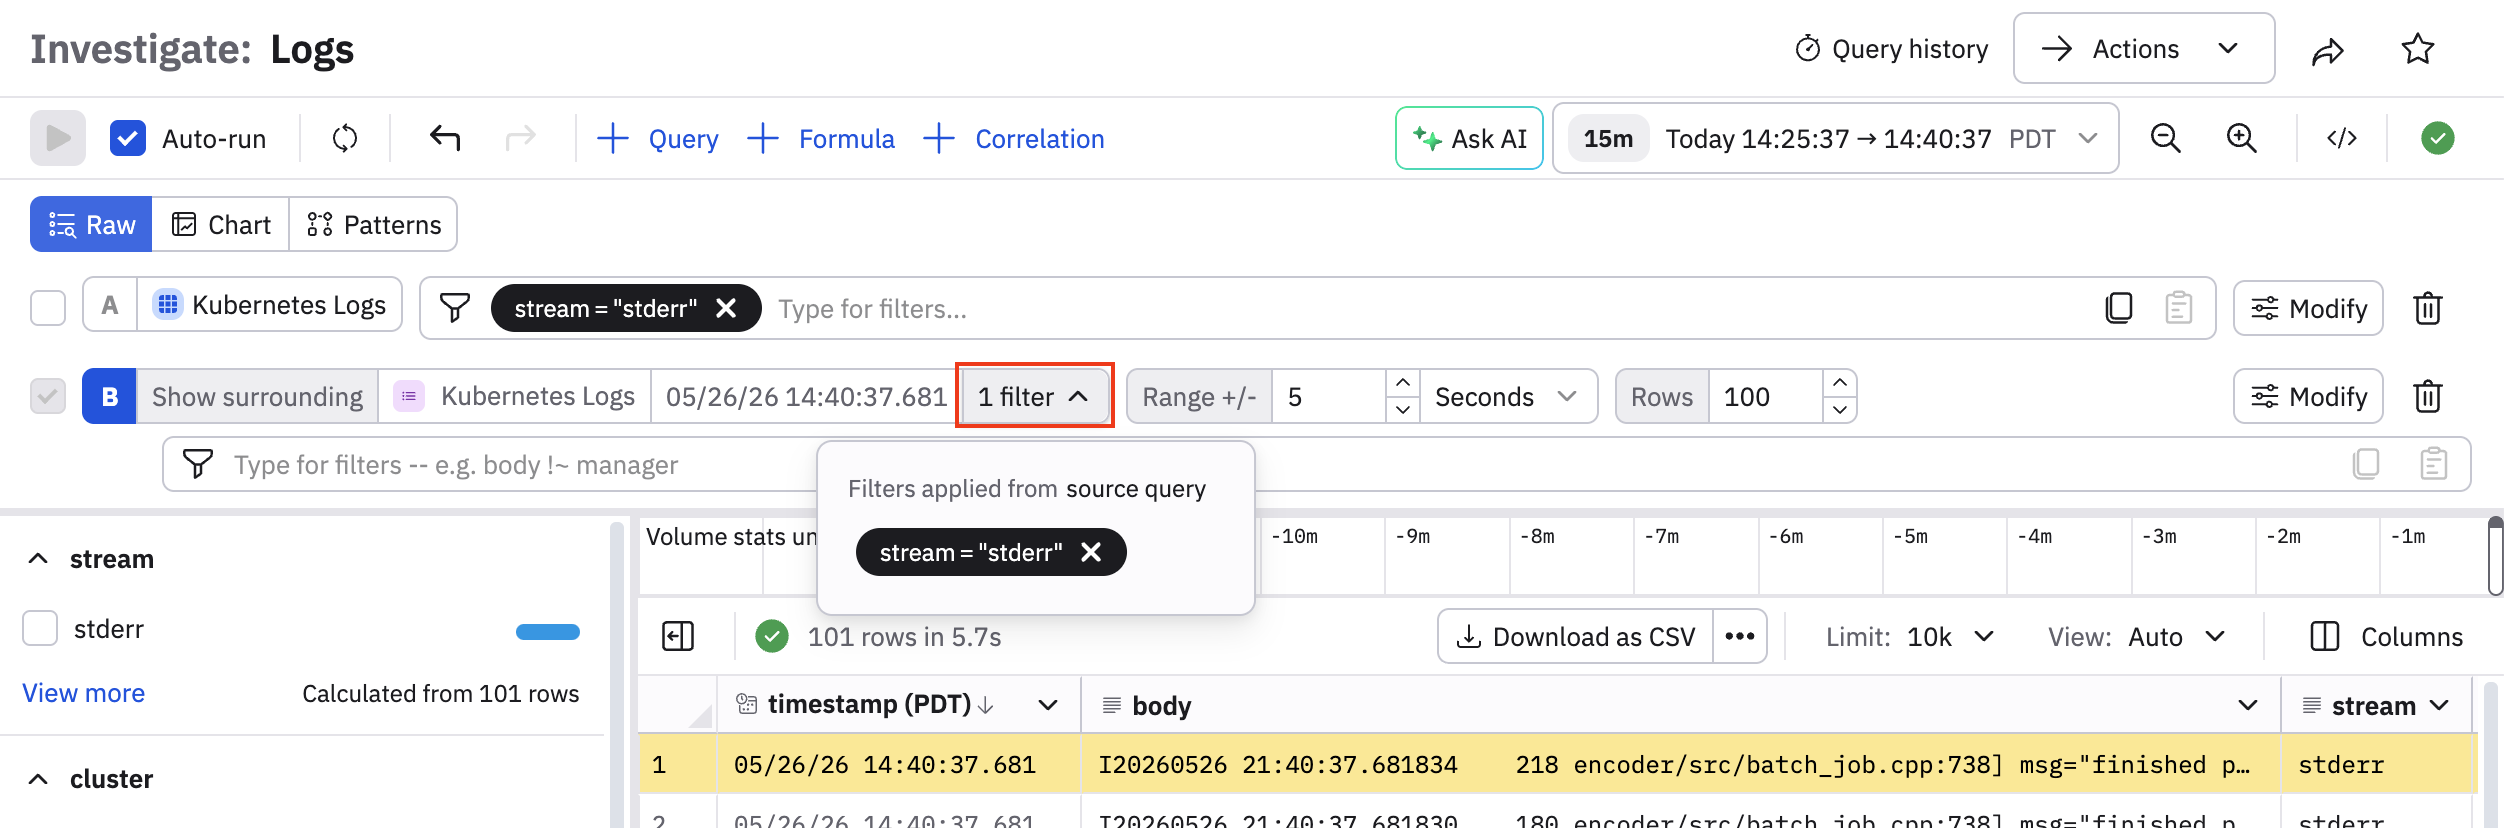
We can see in query B that the stderr filter from the Show surrounding data is carried forward and used in the Log Explorer.
You can also verify the filter inheritance in the generated OPAL:
Compare raw data and patterns
By default, Log Explorer shows data in Raw format as log events. Selecting a row from the list of logs displays details of the log in the right panel.
The log data from a busy system can be voluminous and difficult to understand. Click Patterns to apply a pattern-finding algorithm. Use context clicks on the cells in the table to filter by or exclude pattern IDs, then return to Raw mode and continue your analysis.
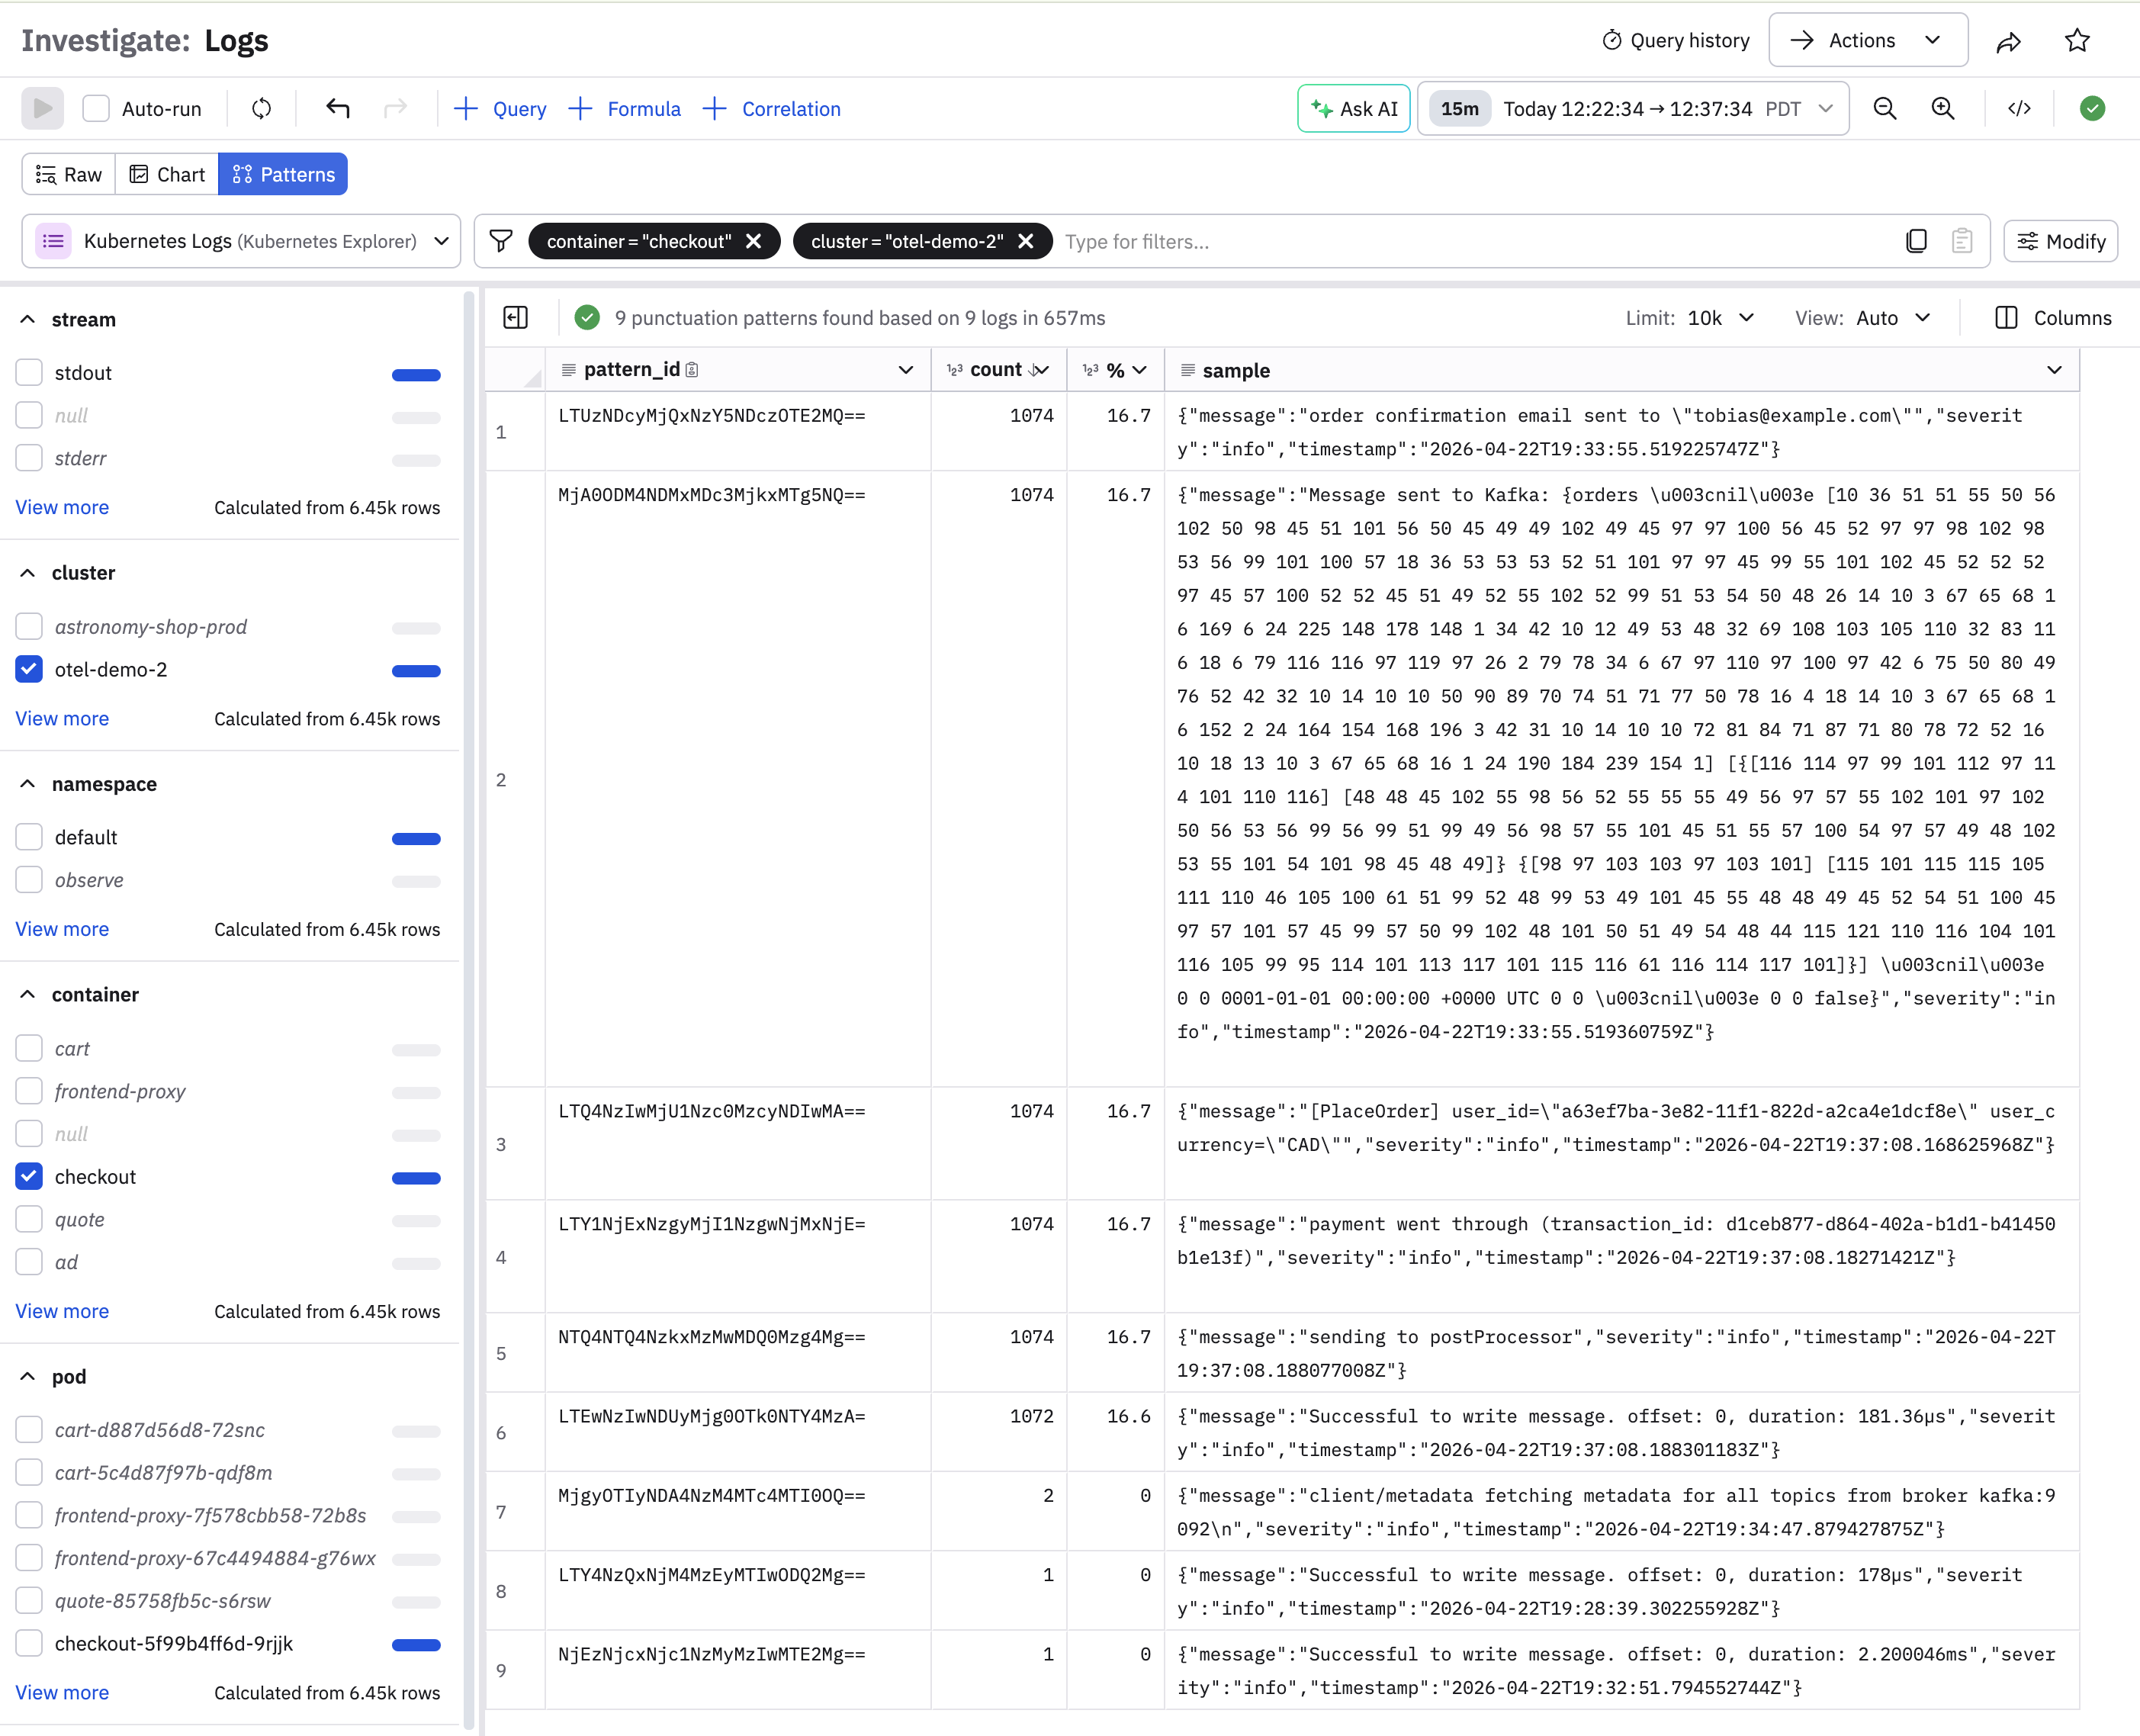
Pattern analysis fingerprints log rows using textual characteristics and groups matching fingerprints by prevalence.
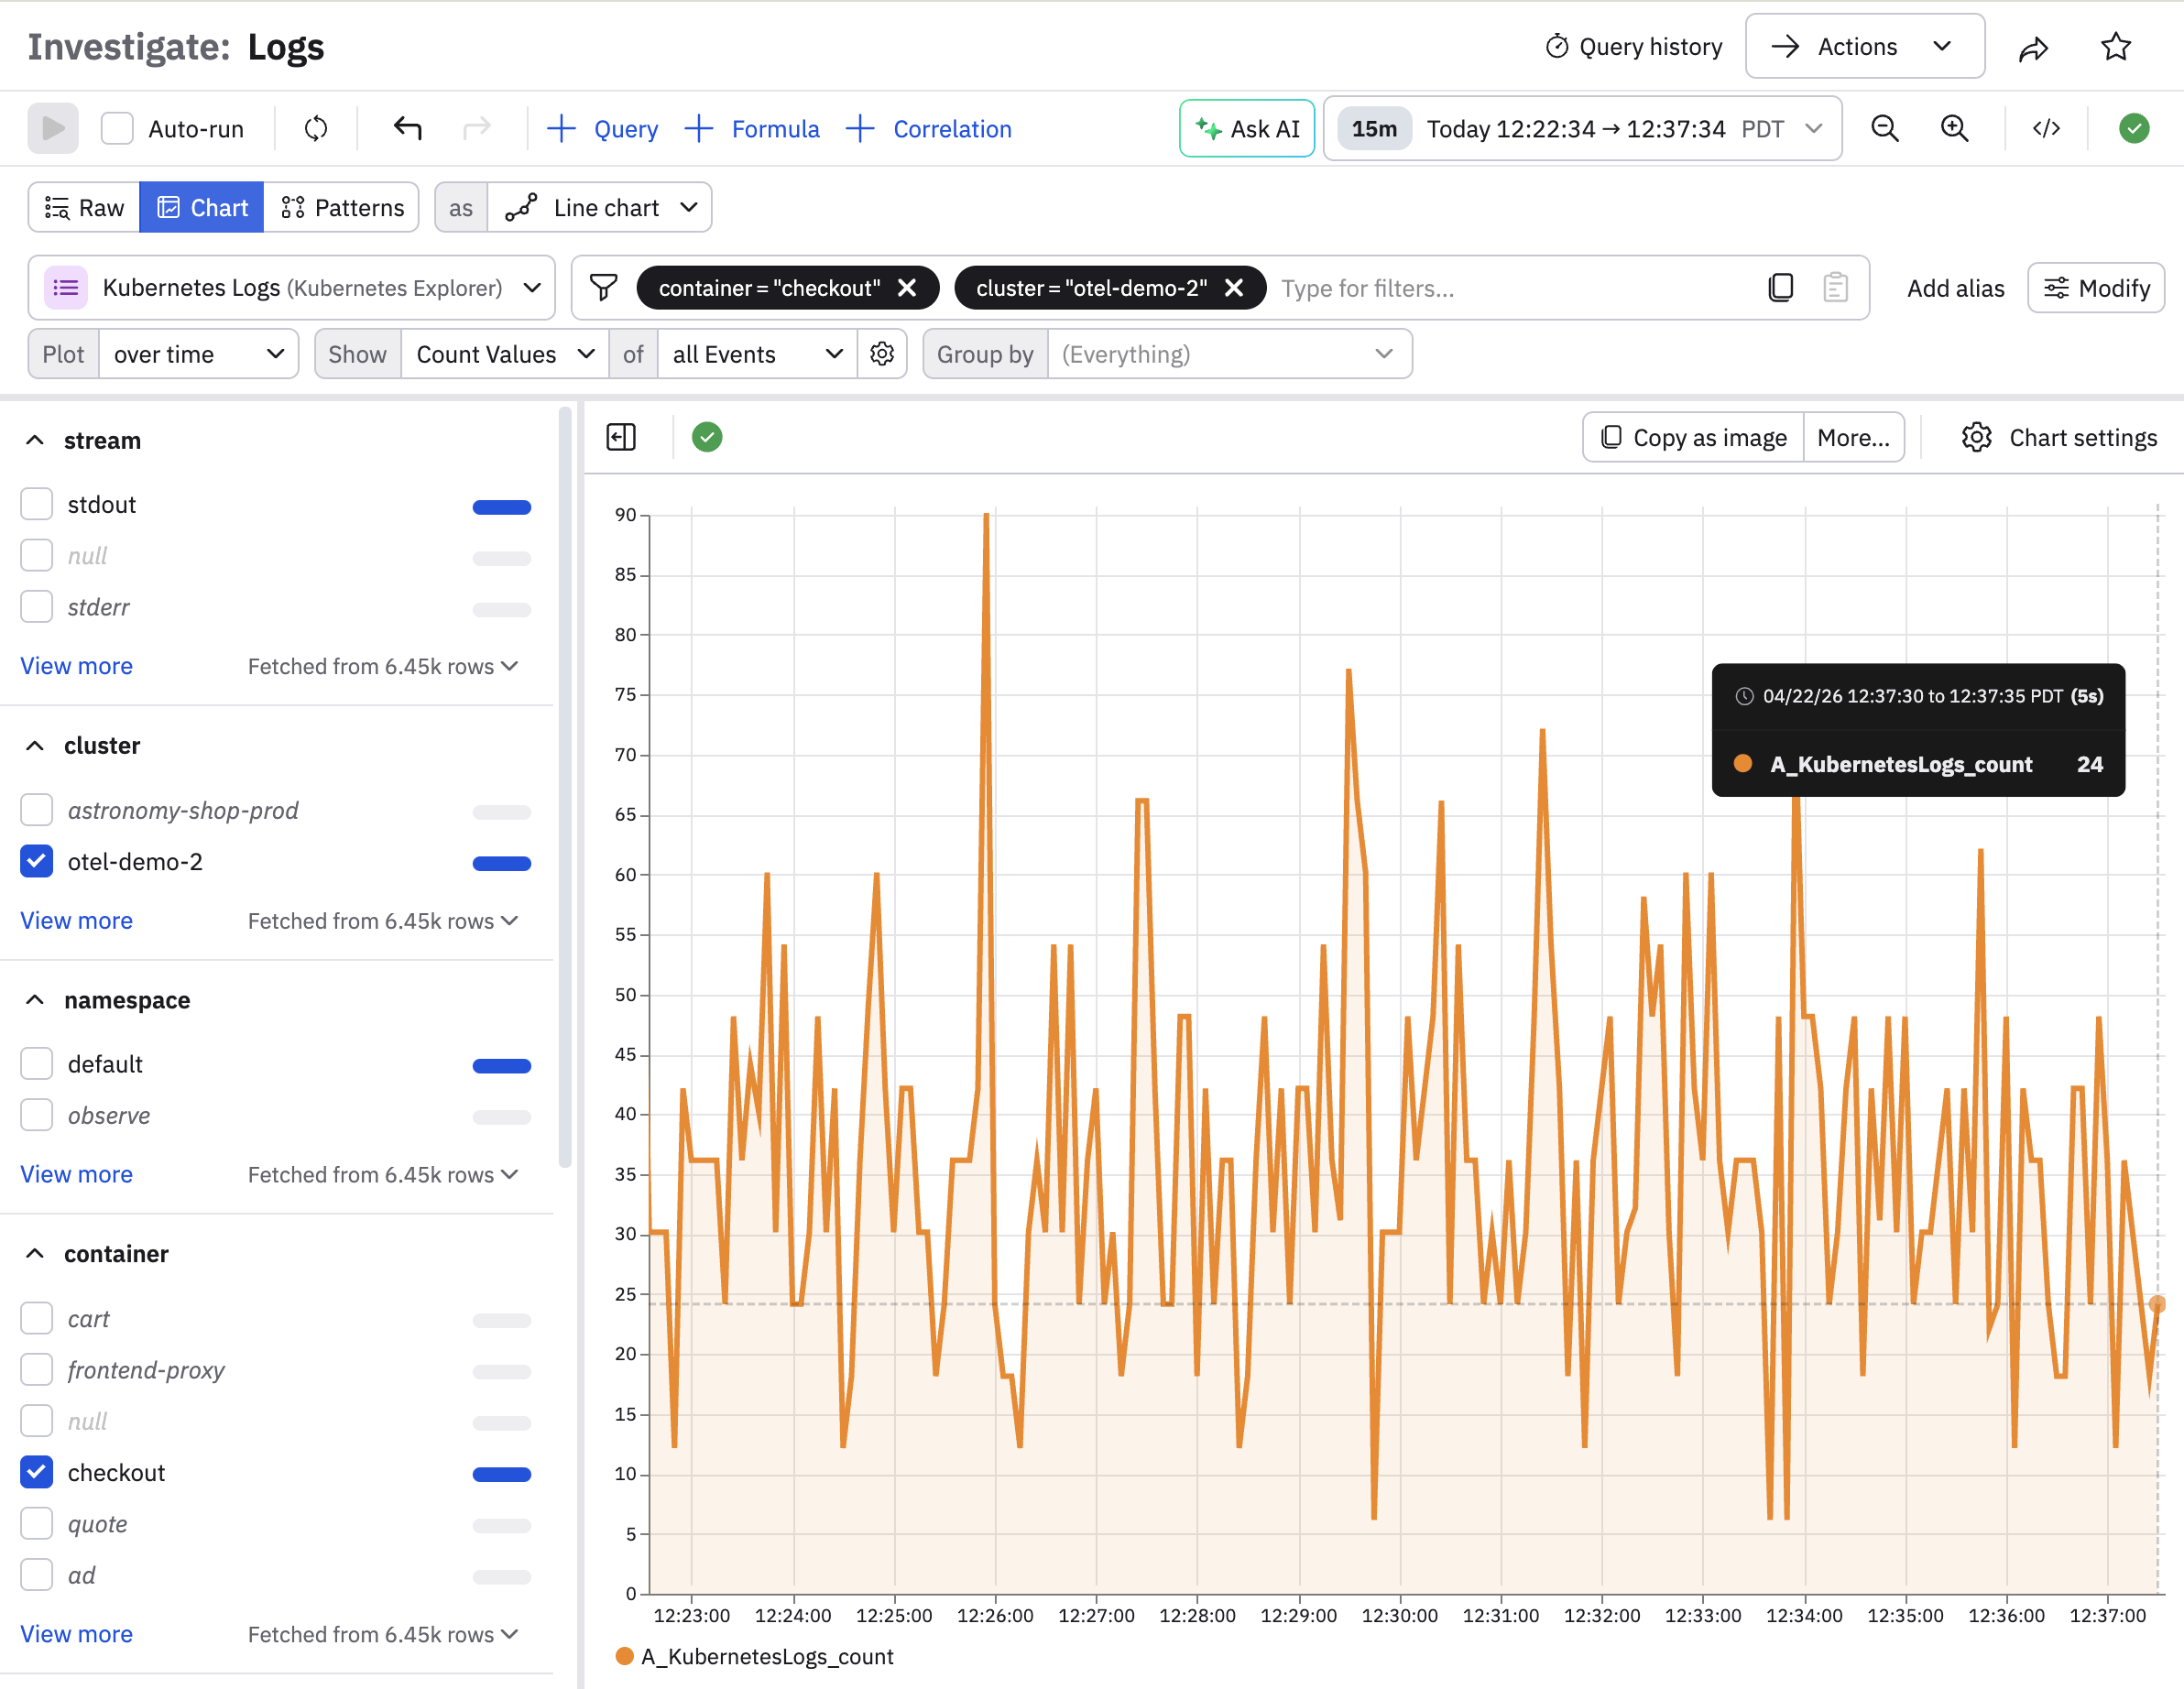
Visualize your data
Click Chart to display the Log Events as a visualization of the events. Log Explorer automatically produces a line chart from a count of events, but you can use the Expression Builder to build a custom visualization matching your data. See Visualization types for full discussion of the available visualizations and options.
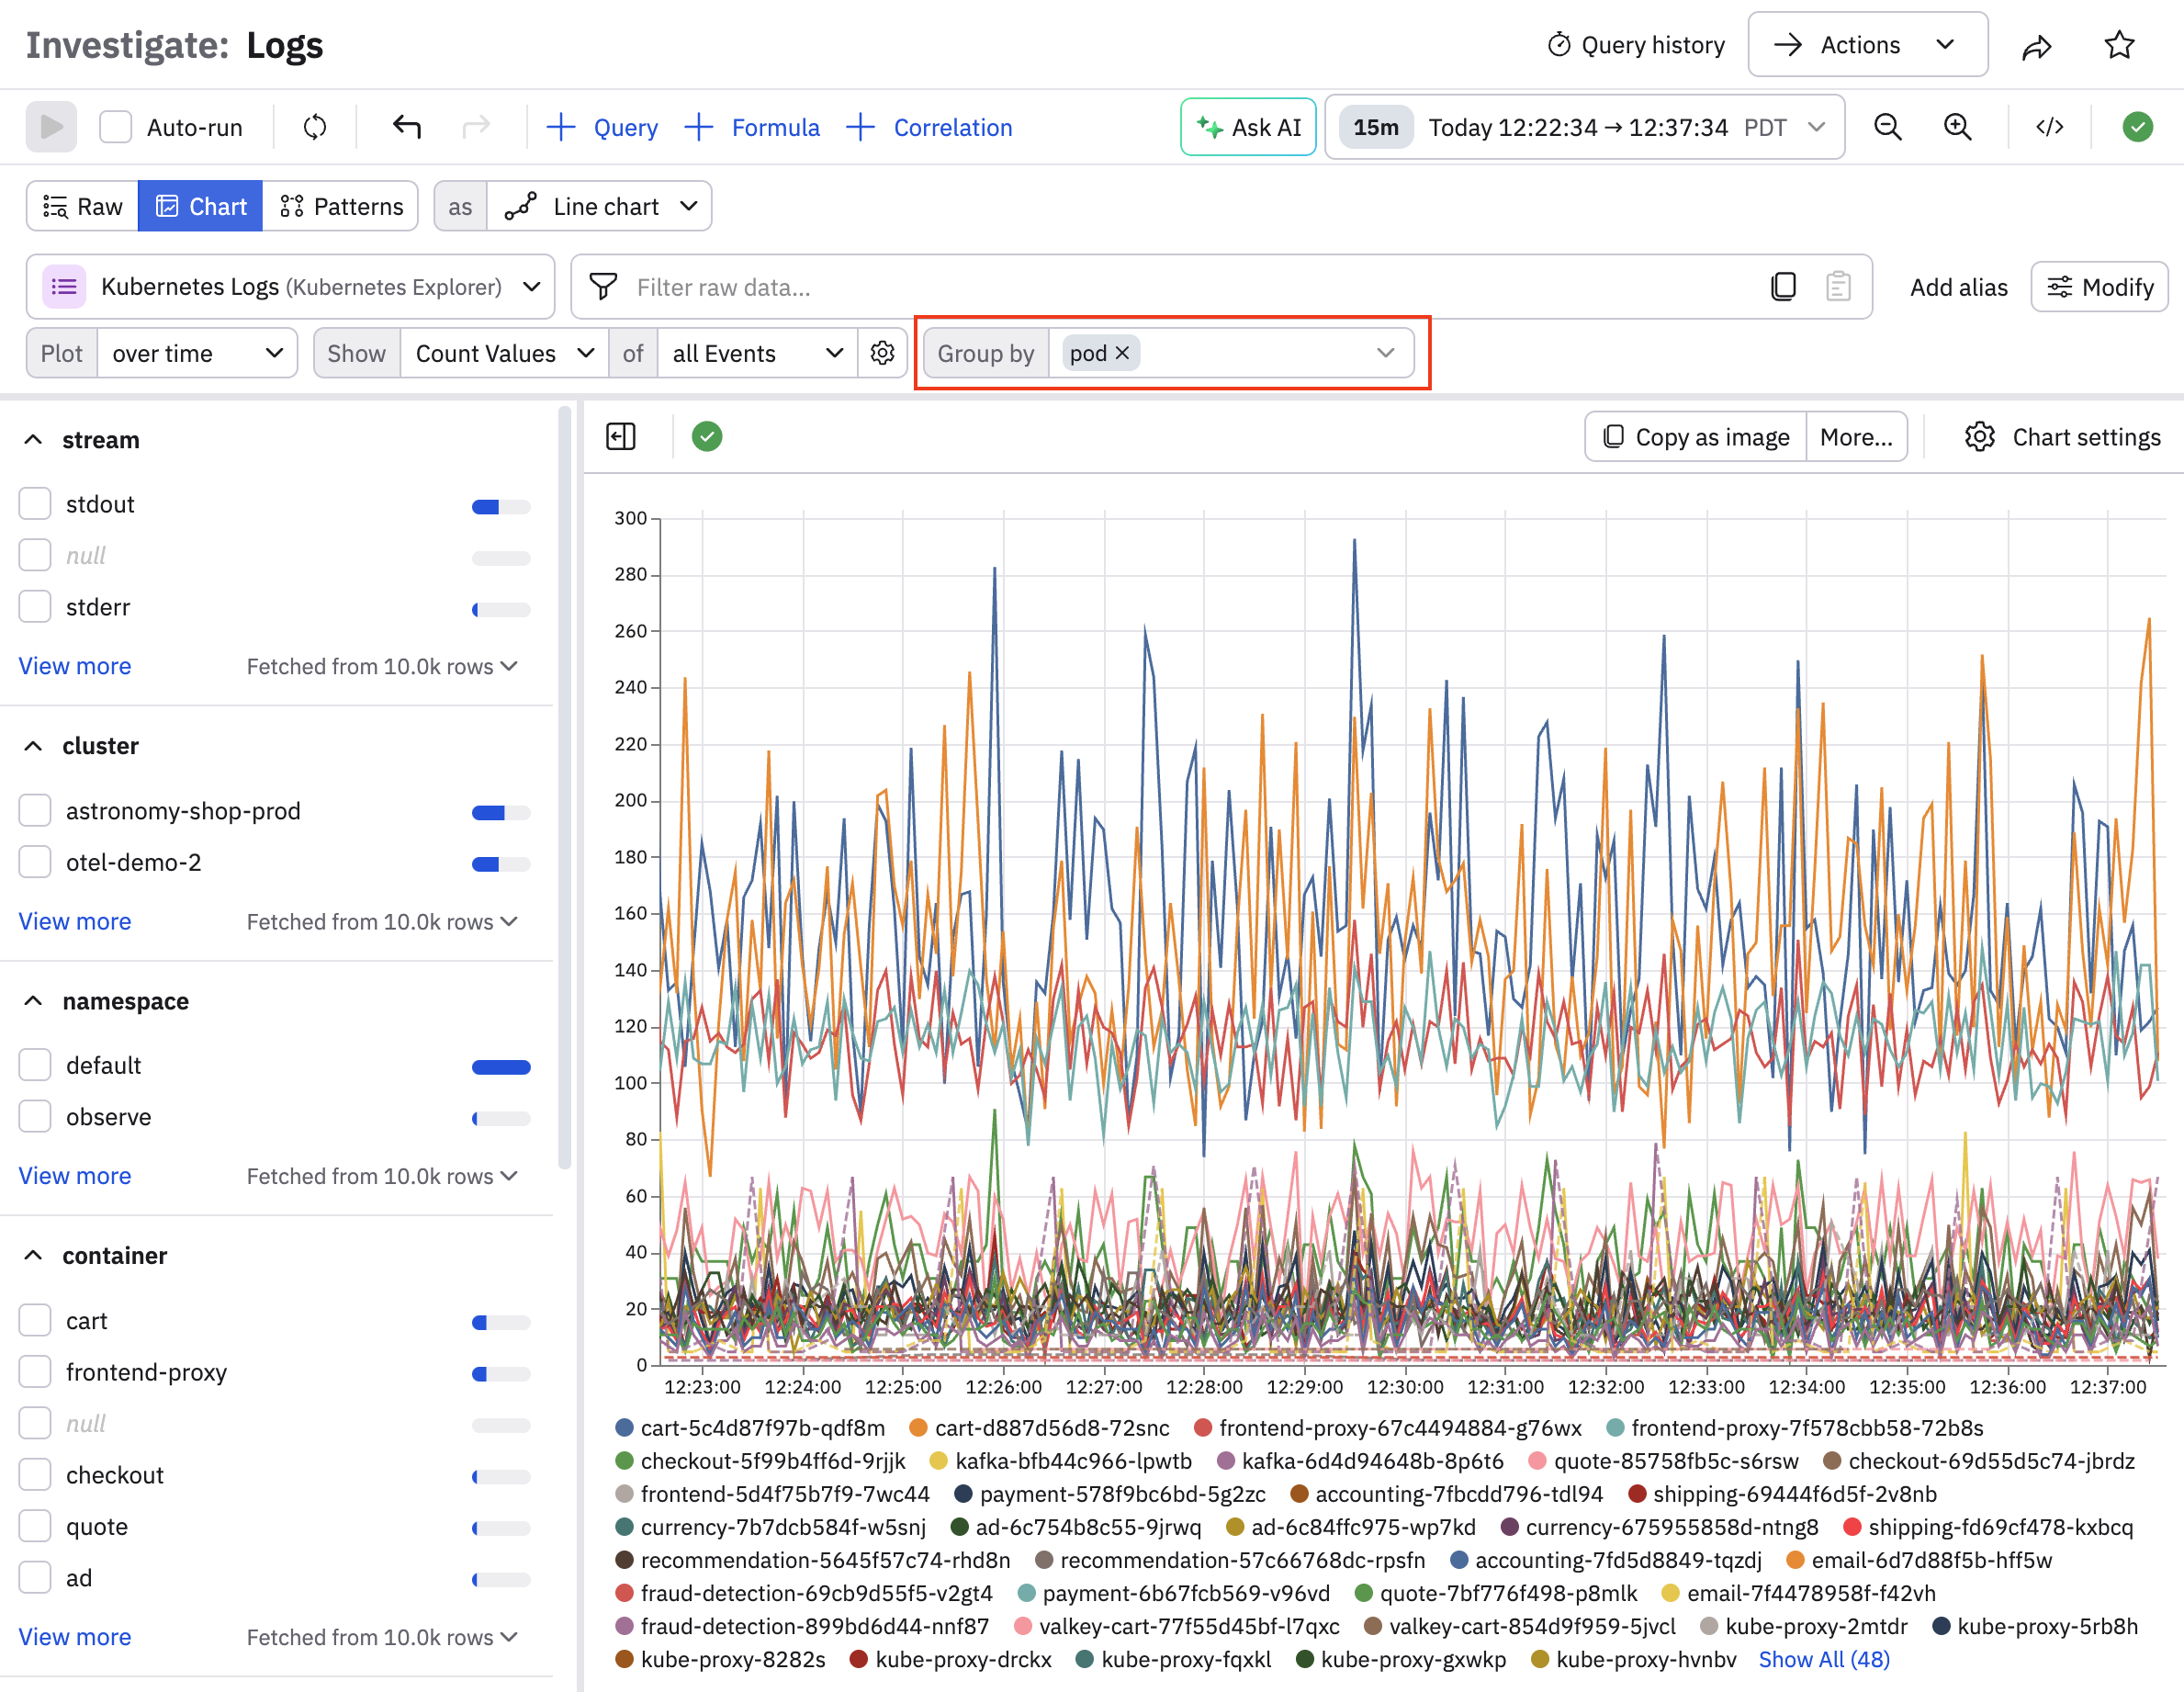
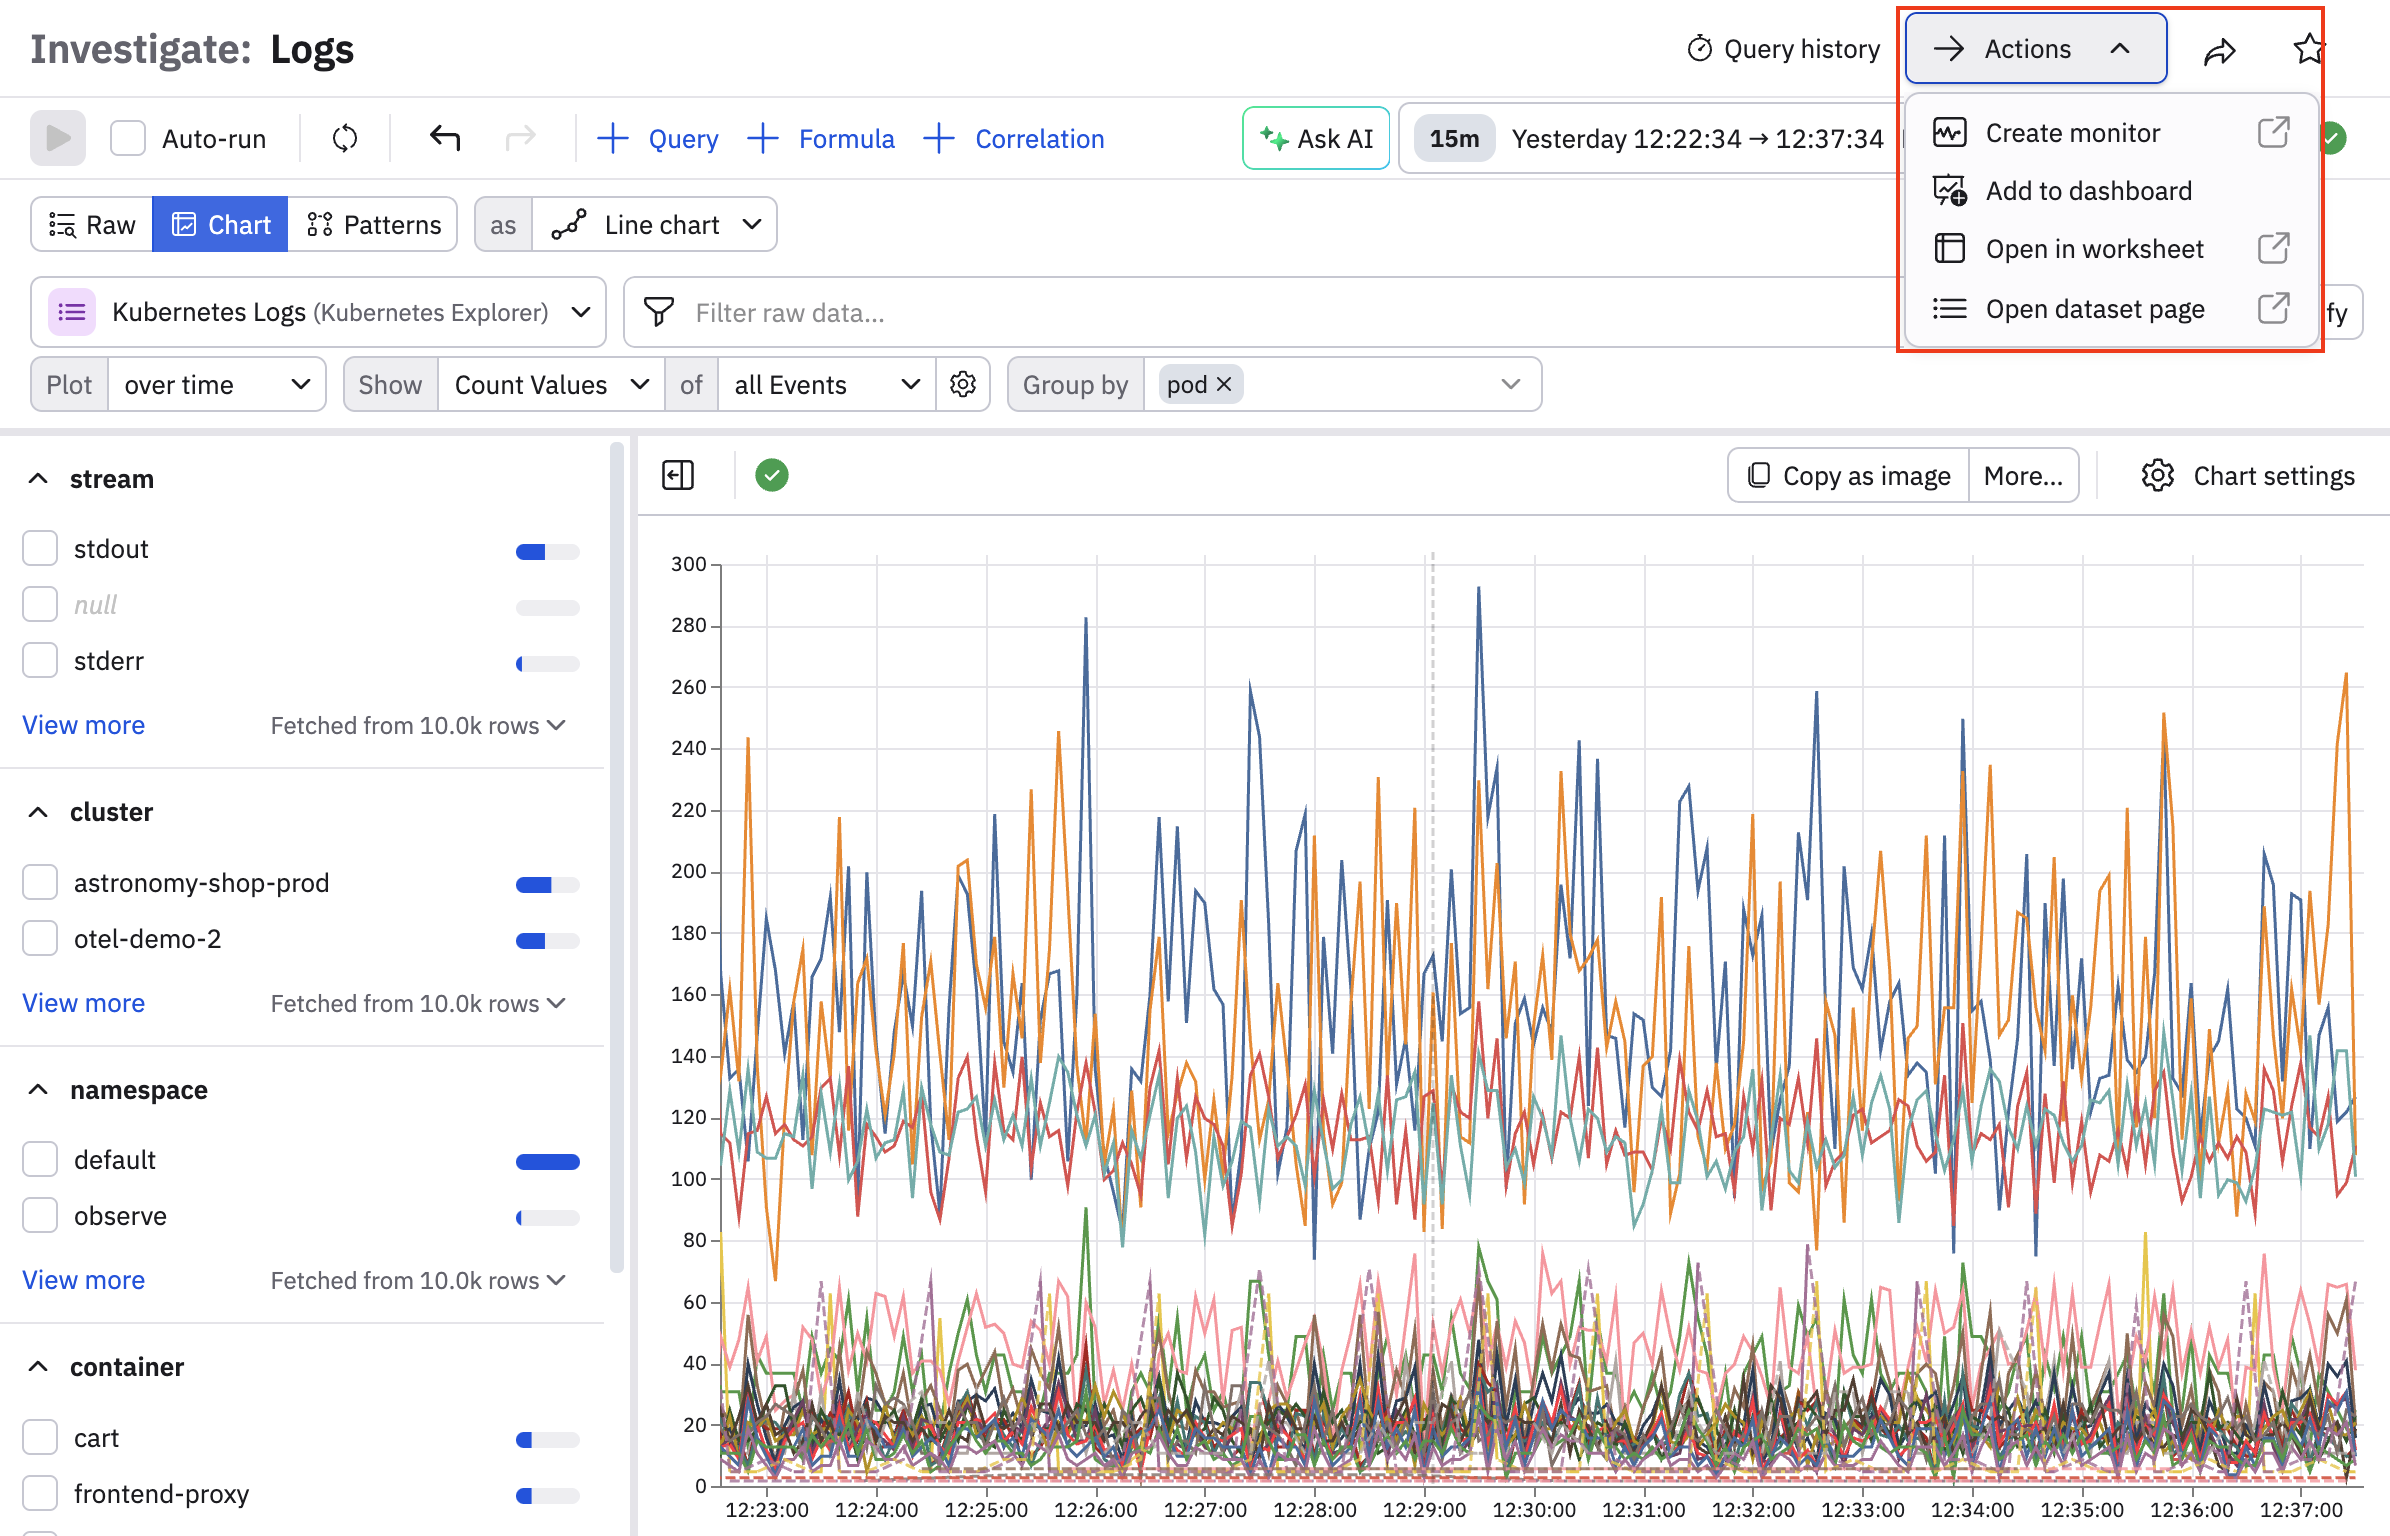
For example, we can remove our existing filters and group by pod:
A given element in a chart also has a contextual menu. In this case, click a line to see these options:
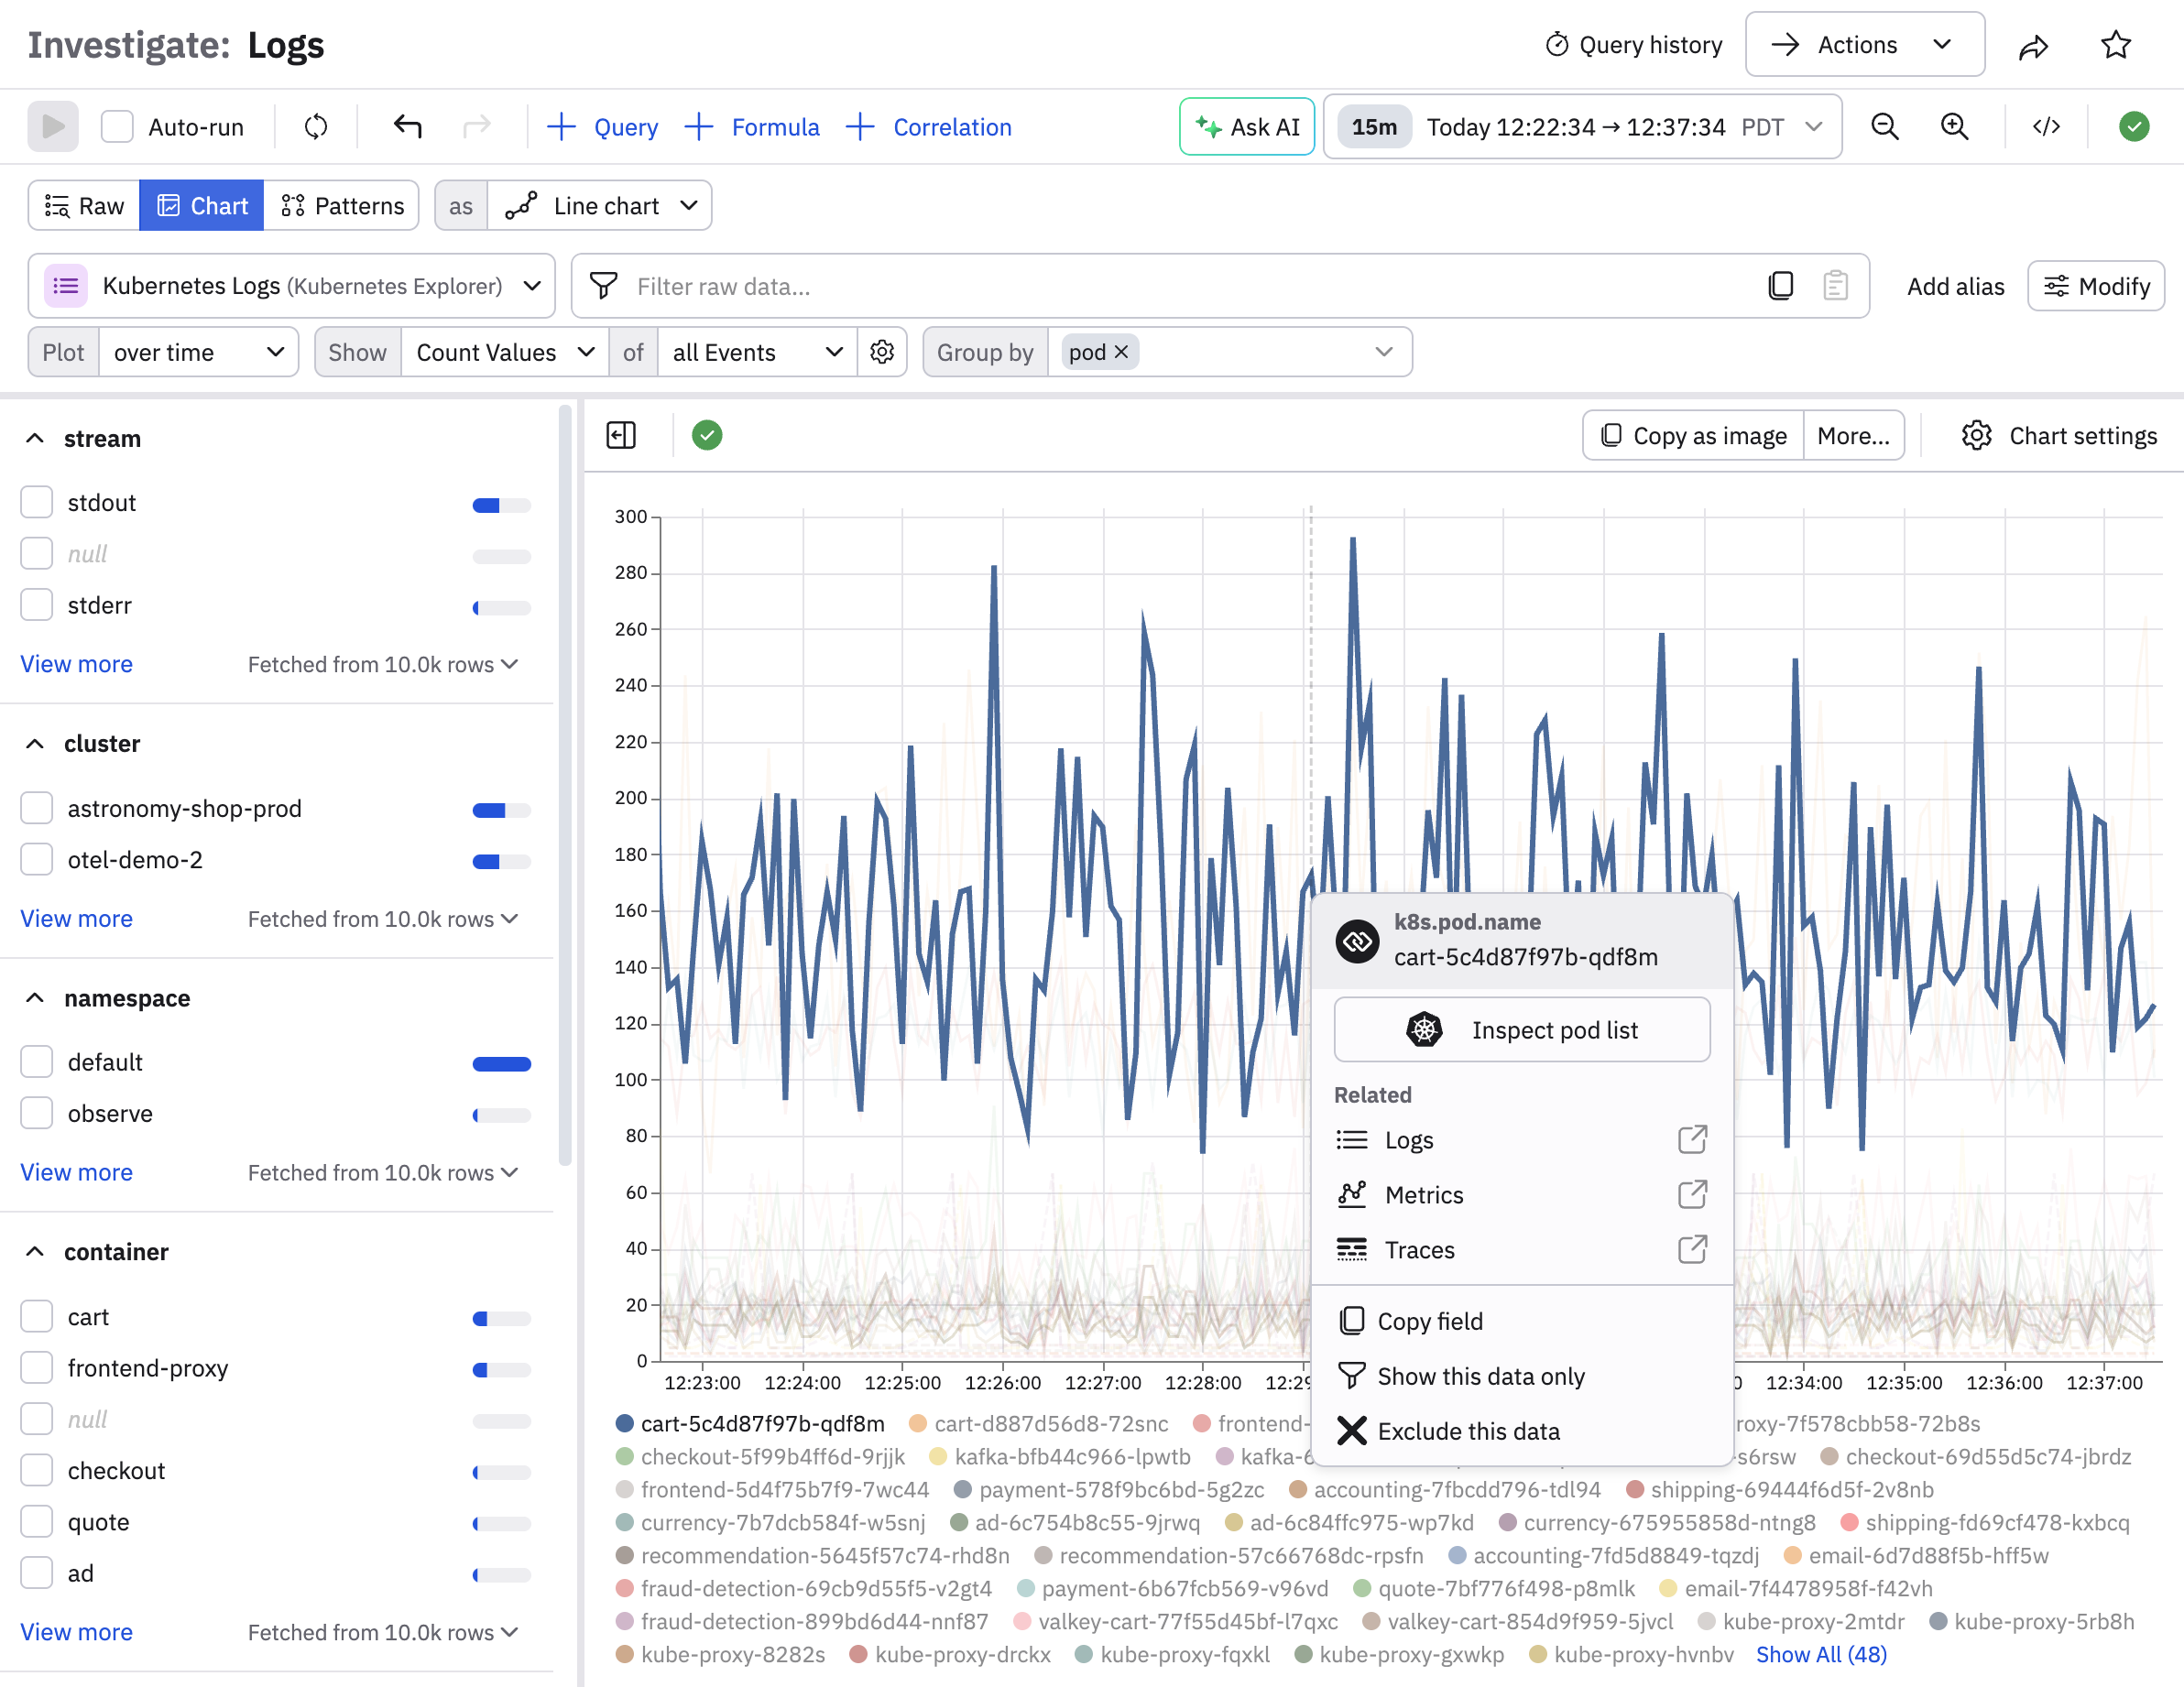
| Option | Description |
|---|---|
| Show this data only | Display just this graph line in the visualization. |
| Exclude this data | Remove this data from the visuzliation. |
| Copy | Copy the graph line. |
| Inspect | Inspect the data for this graph line. |
| For selected resource | Displays the related resource which you can open in a new window. |
| View related | View related dashboards, metrics, and or logs in a new window. |
Perform additional actions
Click Actions at the top right corner to perform the following tasks:
| Action | Description |
|---|---|
| Create monitor | Use a Monitor to send alerts based on this data. See Monitors and alerts. |
| Add to dashboard | Make a new panel with this data in an existing or new dashboard. See Create and share dashboards. |
| Open in worksheet | Further model and refine this data in a Worksheet. See Create and share Worksheets. |
| Open dataset page | Examine this data in the Datasets page. See Create and share Datasets. |
Export data
Click Download as CSV to download the data displayed in Log Explorer in CSV or JSON format. You can specify a maximum size limit (one thousand, ten thousand, or one hundred thousand rows). Note that hidden fields will be included. Use the pick_col OPAL verb to reduce the width of downloaded data.
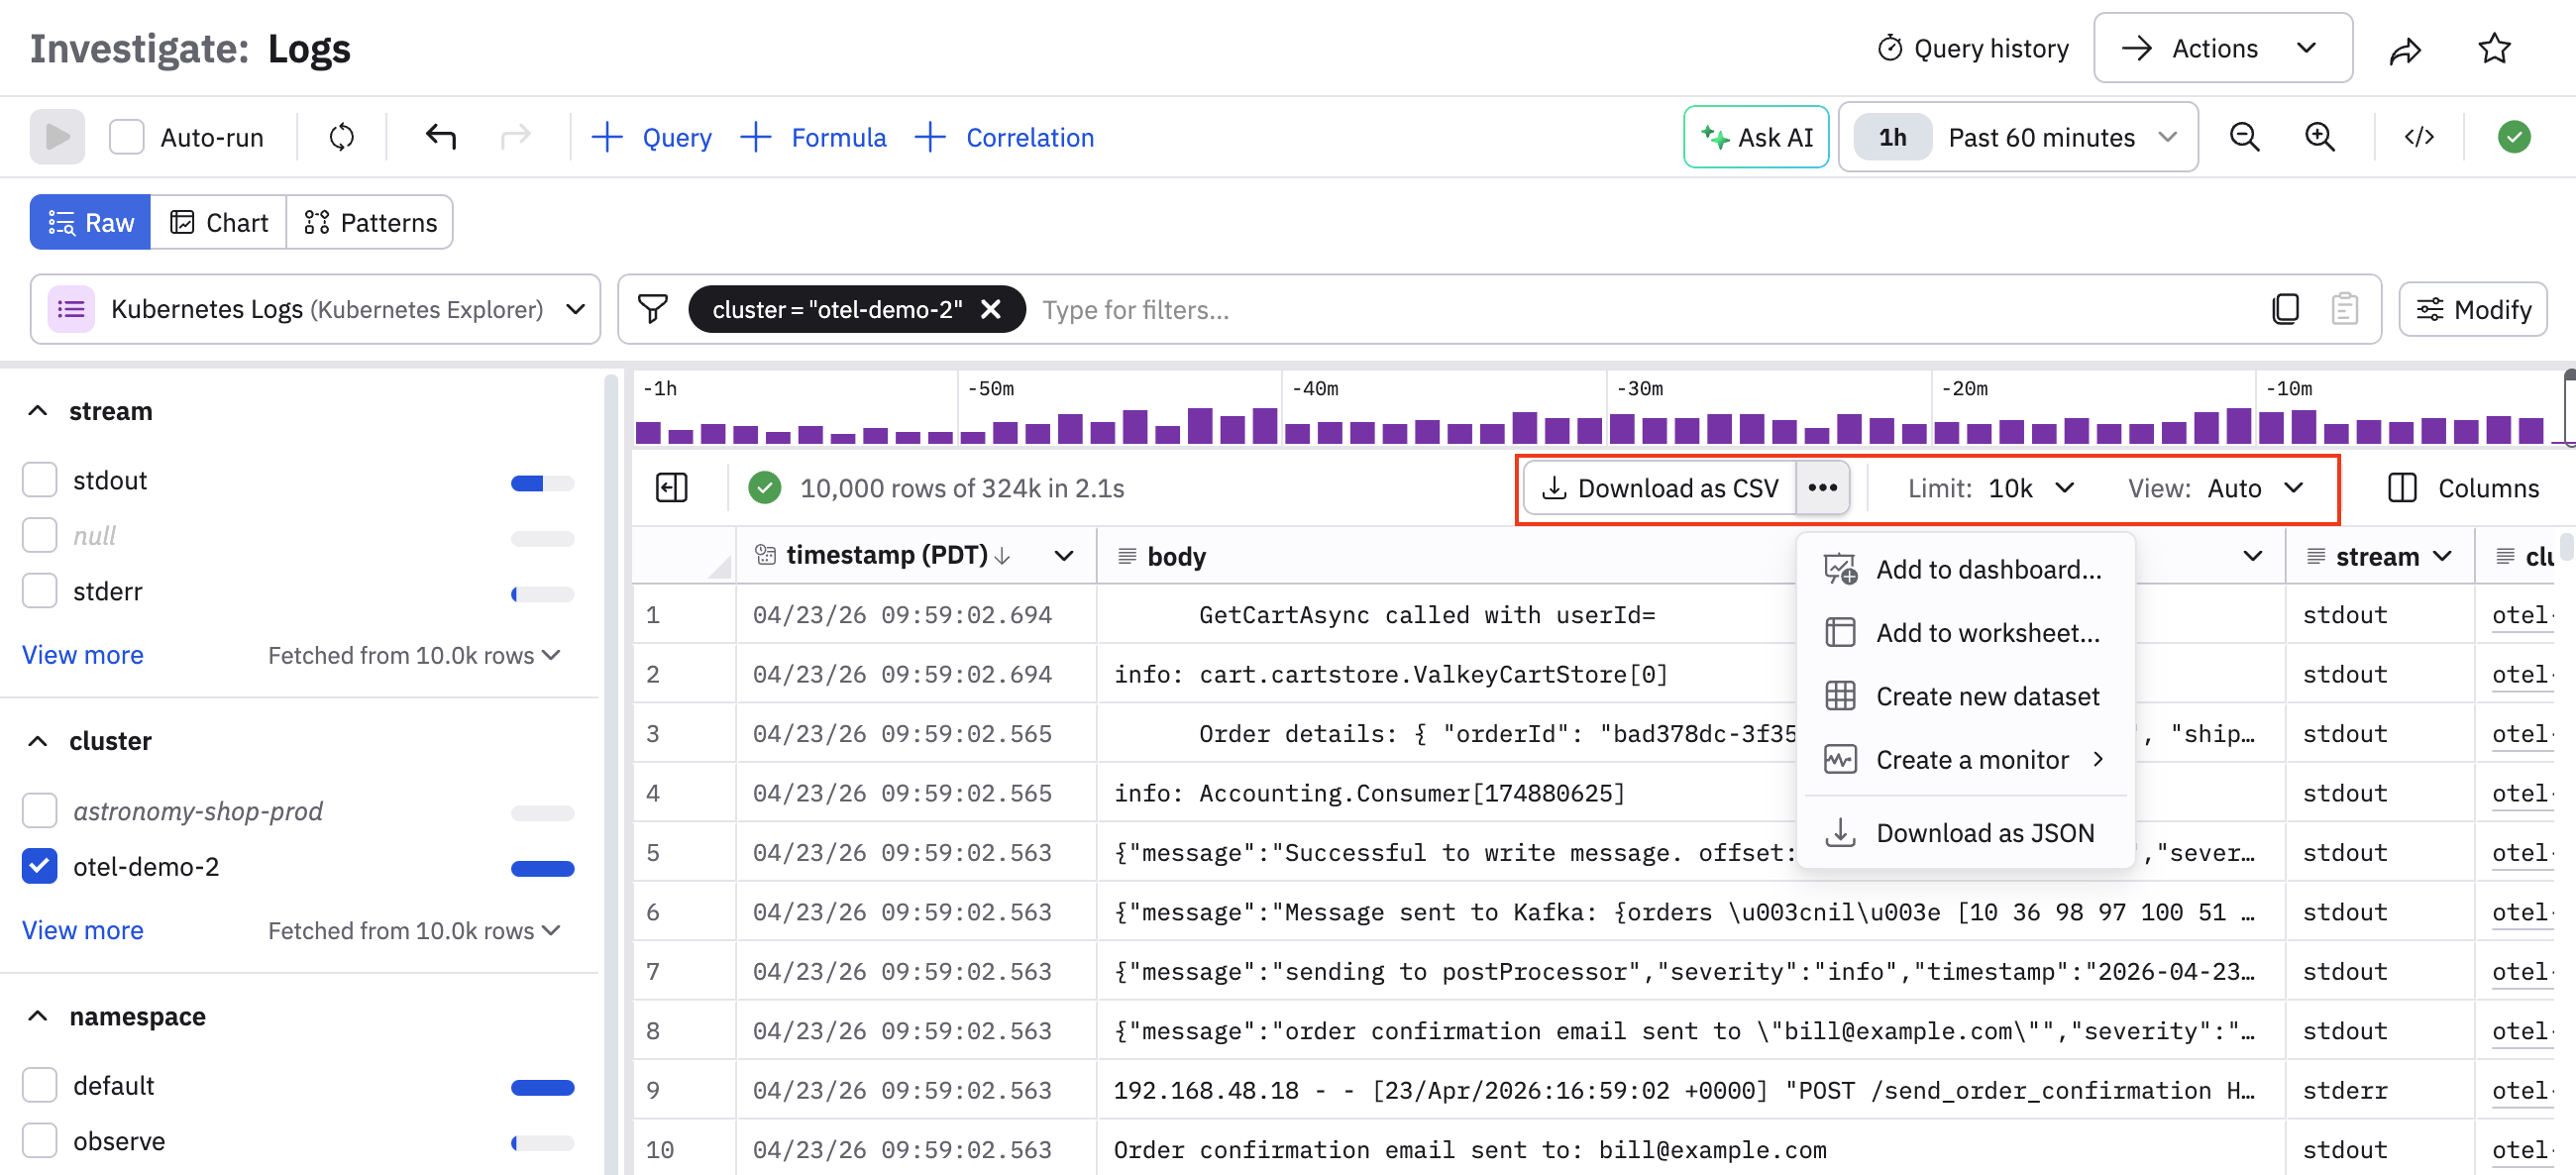
If you need to extract more data, see the Observe API.
Updated about 2 months ago