APM runtime metrics
Observe APM can automatically plot runtime metrics and infrastructure metrics for your services. This provides a fast way to answer questions like: "how is garbage collection affecting my CPU usage and service response times?" or "are we seeing an increase of goroutines associated with the service erroring?"
To view runtime metrics for your services, perform the following steps:
- Click APM in the left navigation.
- Select a service.
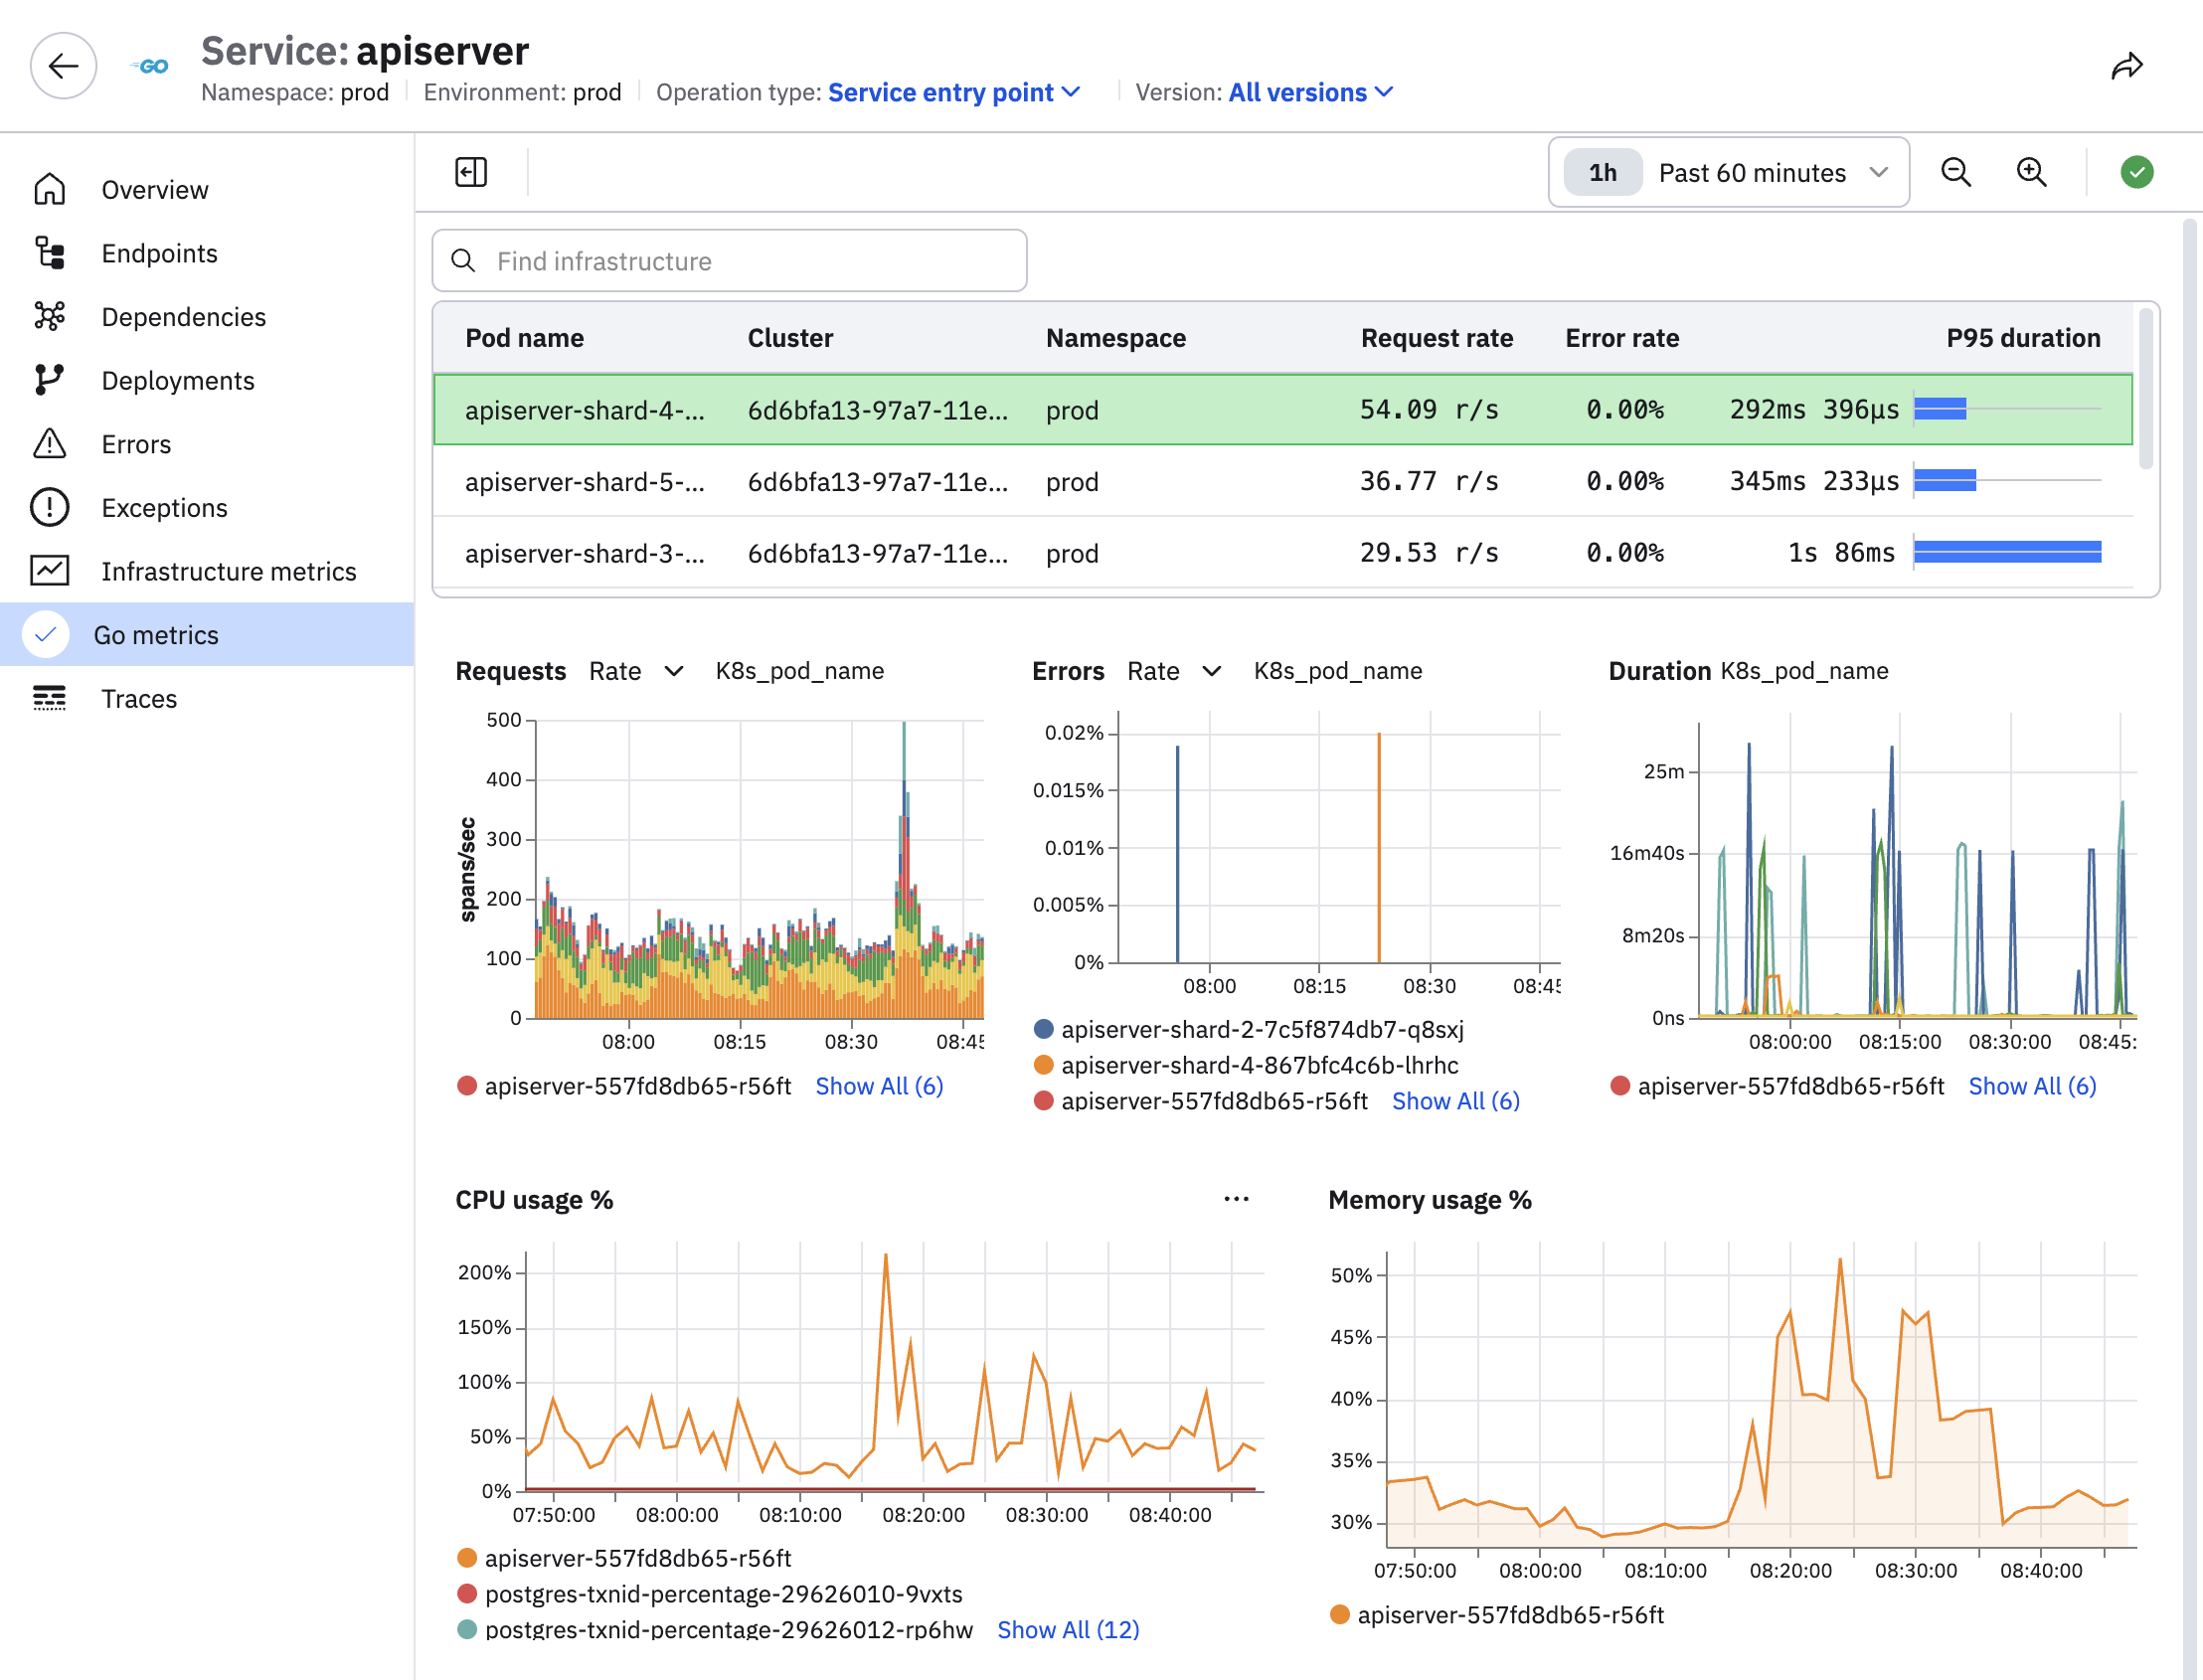
- Click the metric you want to investigate, such as Infrastructure metrics or Go metrics in this example:
Requirements to enable runtime metrics
The following requirements must be met in order for metrics to be plotted in APM:
- The metrics must be sent to Observe in OTel format and be written to the Metrics/OpenTelemetry Dataset.
- If you are running the Observe Agent on a host or containerized environment, make sure the
forwarding.metrics.output_format: oteloption is set in thevalues.yamlfile. This value is set automatically if you install the Observe Agent from the Add Data portal. - If you are running the Observe Agent in Kubernetes, make sure the
node.forwarder.metrics.outputFormat=oteloption is set in yourvalues.yamlfile when installing or upgrading the Observe Agent Helm chart. This value is set automatically if you install the Observe Agent from the Add Data portal.
- If you are running the Observe Agent on a host or containerized environment, make sure the
- The metrics must have temporality
delta. This can be configured using the standard OTel environment variableOTEL_EXPORTER_OTLP_METRICS_TEMPORALITY_PREFERENCE=delta. For compatibility, the Observe Agent can also be configured to convert all metrics todeltatemporality by settingforwarding.metrics.convert_cumulative_to_delta: truein the agent config ornode.forwarder.metrics.convertCumulativeToDelta=truein your Helm chartvalues.yamlfile.
To associate your infra metrics with your services and display them alongside runtime metrics in APM, see Associate infrastructure metrics with services.
Supported languages and runtimes
Select a language for more information.
Supported versions are v0.55.0 and later, but starting with v0.62.0 the environment variable OTEL_GO_X_DEPRECATED_RUNTIME_METRICS must be set to true.
APM Runtime metrics plot data for the following metric names:
process.runtime.go.cgo.callsprocess.runtime.go.gc.countprocess.runtime.go.gc.pause_nsprocess.runtime.go.gc.pause_ns.countprocess.runtime.go.gc.pause_ns.maxprocess.runtime.go.gc.pause_ns.minprocess.runtime.go.gc.pause_ns.sumprocess.runtime.go.gc.pause_total_nsprocess.runtime.go.goroutinesprocess.runtime.go.mem.heap_allocprocess.runtime.go.mem.heap_idleprocess.runtime.go.mem.heap_inuseprocess.runtime.go.mem.heap_objectsprocess.runtime.go.mem.heap_releasedprocess.runtime.go.mem.heap_sysprocess.runtime.go.mem.live_objectsprocess.runtime.go.mem.lookups
Java runtime metric support is available when using the OTel zero-code instrumentation Java agent. See Getting started in the OpenTelemetry documentation.
NoteMicronaut is not supported.
Supported versions are v2.0.0 and later.
APM Runtime metrics plot data for the following metric names:
jvm.gc.duration.countjvm.gc.duration.sumjvm.memory.committedjvm.memory.limitjvm.memory.usedjvm.thread.count
.Net runtime metric support is available when using OTel .NET zero-code instrumentation. See .NET zero-code instrumentation in the OpenTelemetry documentation.
Supported versions are v1.4.0 and later.
APM Runtime metrics plot data for the following metric names:
process.runtime.dotnet.gc.collections.countprocess.runtime.dotnet.gc.pause.timeprocess.runtime.dotnet.gc.last_collection.heap.fragmentation.sizeprocess.runtime.dotnet.thread_pool.thread.countprocess.runtime.dotnet.exceptions
NodeJS runtime metric support is available when using OTel JavaScript zero-code instrumentation. See JavaScript zero-code instrumentation in the OpenTelemetry documentation.
Supported versions are v0.62.0 and later.
APM Runtime metrics plot data for the following metric names:
nodejs.eventloop.utilizationnodejs.eventloop.delay.p99nodejs.eventloop.timev8js.gc.durationv8js.memory.heap.usedv8js.memory.heap.limit
Updated 3 months ago