Install on Windows
This page provides instructions for installing the Observe Agent on a Windows system to collect metrics, logs, and application telemetry—including OpenTelemetry traces—and forward them to Observe.
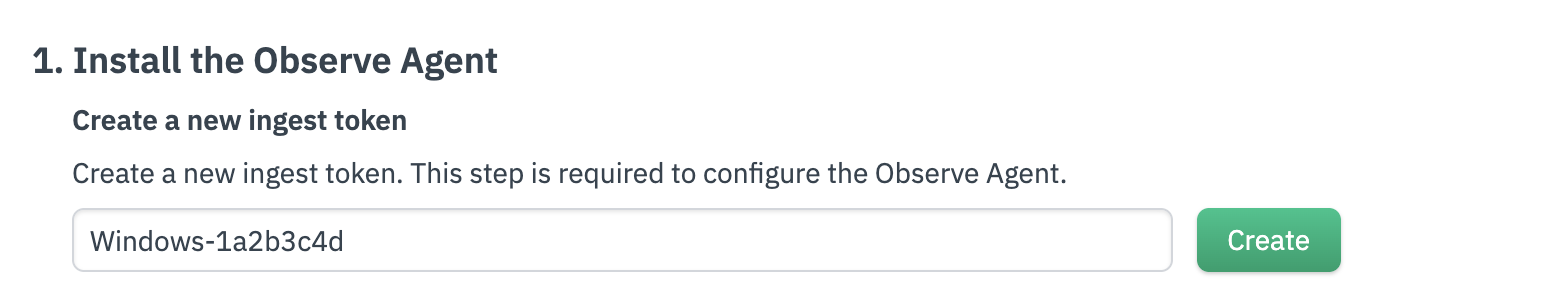
Create an ingest token
Create an ingest token in the Add Data portal, and be sure to record this token in a safe place, as you will need to provide it during the installation.
- From the left navigation, click Data & integrations > Add Data.
- Click Windows.
- Click Create to generate a new ingest token.
Install and start the Observe Agent
Install the observe-agent package via the provided installation PowerShell script. This script needs to be run in a PowerShell terminal that you run as administrator.
Replace the contents of the agent configuration file with the config file below. Replace <YOUR_INGEST_TOKEN> with your instance’s ingest token you create from the Add Data for Windows page (ex: a1b2c3d4e5f6g7h8i9k0:l1m2n3o4p5q6r7s8t9u0v1w2x3y4z5a6) and <YOUR_OBSERVE_COLLECTION_ENDPOINT> with your instance’s collection endpoint (ex: https://123456789012.collect.observeinc.com/). For more information on configuring the agent, see Configuration.
NoteSome Observe instances may optionally use a name instead of Customer ID; if this is the case for your instance, contact your Observe Data Engineer to discuss implementation. A stem name will work as is, but a DNS redirect name may require client configuration.
[Net.ServicePointManager]::SecurityProtocol = "Tls, Tls11, Tls12, Ssl3"; Invoke-WebRequest -UseBasicParsing "https://github.com/observeinc/observe-agent/releases/latest/download/install.ps1" -outfile .\install.ps1; .\install.ps1 -observe_token "<YOUR_INGEST_TOKEN>" -observe_collection_endpoint "<YOUR_OBSERVE_COLLECTION_ENDPOINT>"To validate that the agent is installed correctly, you can run the following commands.
Get-Service ObserveAgent
Set-Location "${Env:Programfiles}\Observe\observe-agent"
./observe-agent status
Configure the Observe Agent
You can configure the Observe Agent automatically or manually.
Configure the Observe Agent automatically
The easiest way to initialize the agent configuration is to use the observe-agent init-config command as follows:
observe-agent init-config --token <YOUR_INGEST_TOKEN> --observe_url <YOUR_OBSERVE_COLLECTION_ENDPOINT>This is only recommended for initial configuration. For subsequent changes, see below.
Configure the Observe Agent manually
The installation PowerShell script will automatically start the agent for you. You can find the observe-agent.yaml config file in the ${Env:Programfiles}\Observe\observe-agent directory. For more information on configuring the agent, see Configure the Observe Agent on Linux, Windows, and macOS.
# Observe data token (ex: a1b2c3d4e5f6g7h8i9k0:l1m2n3o4p5q6r7s8t9u0v1w2x3y4z5a6)
token: "<YOUR_INGEST_TOKEN>"

# Target Observe collection url (ex: https://123456789012.collect.observeinc.com/)
observe_url: "<YOUR_OBSERVE_COLLECTION_ENDPOINT>"

# Debug mode - Sets agent log level to debug
debug: false

# Enable forwarding of local app metrics and traces
forwarding:
  enabled: true
  metrics:
    output_format: otel

# Collect metrics and logs pertaining to the agent itself
self_monitoring:
  enabled: true

host_monitoring:
  # Collect metrics or logs about the host system
  enabled: true
  # Collect logs from the host system (stdout/stderr)
  logs:
    enabled: true
    # Tail log files, useful for app logs
    include:
      - 'C:/path_to_logs/log/*.log'
      - 'C:/path_to_logs_2/log/*.log'
  metrics:
    # Collect metrics about the host system
    host:
      enabled: true
    # Collect metrics about the processes running on the host system
    process:
      enabled: false

resource_attributes:
  # Add resource attributes, this is a good spot to add unique identifiers
  deployment.environment.name: dev-example
  store.number: 1234 # Example of a unique identifier, this will appear in all logs/metrics

# Otel overrides - example is for debugging

# otel_config_overrides:
#   exporters:
#     debug:
#       verbosity: detailed
#       sampling_initial: 5
#       sampling_thereafter: 200
#   service:
#     pipelines:
#       metrics:
#         receivers: [hostmetrics]
#         processors: [memory_limiter]
#         exporters: [debug]
Restart the Observe Agent with the updated configuration
If you made any configuration updates, you can restart the agent and apply the new config with the following command.
Restart-Service ObserveAgentWindows service startup and recovery settings
The Observe Agent installer registers the Observe Agent as a Windows service named ObserveAgent with a startup type of Automatic. In some environments, the Observe Agent may fail to start after a server reboot because dependent services or network resources are not yet available when the Observe Agent starts.
Recommended: Use delayed auto-start
To avoid startup failures after reboot, change the service startup type to Automatic (Delayed Start). This ensures the Observe Agent starts after other system services have initialized.
Set-Service -Name ObserveAgent -StartupType AutomaticDelayedStartTo verify the current startup type:
Get-Service -Name ObserveAgent | Select-Object Name, StartType, StatusConfigure automatic recovery on failure
Configure the service to restart automatically if it stops unexpectedly:
- Open
services.msc. - Right-click ObserveAgent and select Properties.
- Go to the Recovery tab.
- Set First failure, Second failure, and Subsequent failures to Restart the Service.
Alternatively, use PowerShell:
sc.exe failure ObserveAgent reset= 86400 actions= restart/5000/restart/10000/restart/30000This configures the service to restart after 5, 10, and 30 seconds on successive failures, resetting the failure count after 24 hours.
Diagnose startup failures
If the Observe Agent doesn't start after a reboot, check the Windows Event Viewer for errors:
- Event Viewer > Windows Logs > System — Look for Service Control Manager errors (Event IDs 7000, 7009, 7011) around the reboot time.
- Event Viewer > Windows Logs > Application — Filter by Source =
ObserveAgentfor agent-specific errors.
NoteThese service settings are managed by Windows, not by the
observe-agent.yamlconfiguration file. The YAML file configures the OpenTelemetry collector component of the agent and does not control Windows service behavior.
Send application data to Observe
Once the Observe Agent is deployed, configure your application instrumentation or set the OTEL_EXPORTER_OTLP_ENDPOINT environment variable to one of the following addresses to send application telemetry including traces to the Observe Agent.
NoteWhen setting up the endpoint to send traces, make sure you use the path that your OTLP library requires. Some libraries need traces to go to /v1/traces, while others expect them at the root path /.
- OTLP/HTTP endpoint: http://localhost:4318
- OTLP/grpc endpoint: http://localhost:4317
See APM instrumentation for more information about how to instrument your app for observability.
Uninstall the Observe Agent
Run the following commands to uninstall the Observe Agent:
Stop-Service ObserveAgent
Remove-Item -Recurse "${Env:Programfiles}\Observe"
Upgrade the Observe Agent
To upgrade the Observe Agent, run the installation PowerShell script again. The script will stop the service before installing the new version of the agent and restarting the service.
[Net.ServicePointManager]::SecurityProtocol = "Tls, Tls11, Tls12, Ssl3"; Invoke-WebRequest -UseBasicParsing "https://github.com/observeinc/observe-agent/releases/latest/download/install.ps1" -outfile .\install.ps1; .\install.ps1 -observe_token "<YOUR_INGEST_TOKEN>" -observe_collection_endpoint "<YOUR_OBSERVE_COLLECTION_ENDPOINT>"Updated 4 months ago
What’s Next
Use both the Log Explorer and the Metric Explorer to monitor your systems. To analyze your trace data, explore both the Trace Explorer and the Service Explorer.