View Prometheus metrics in Observe
After installing the app, you can view the metrics you collect from Prometheus in the Metrics Explorer and you can add them to dashboards.
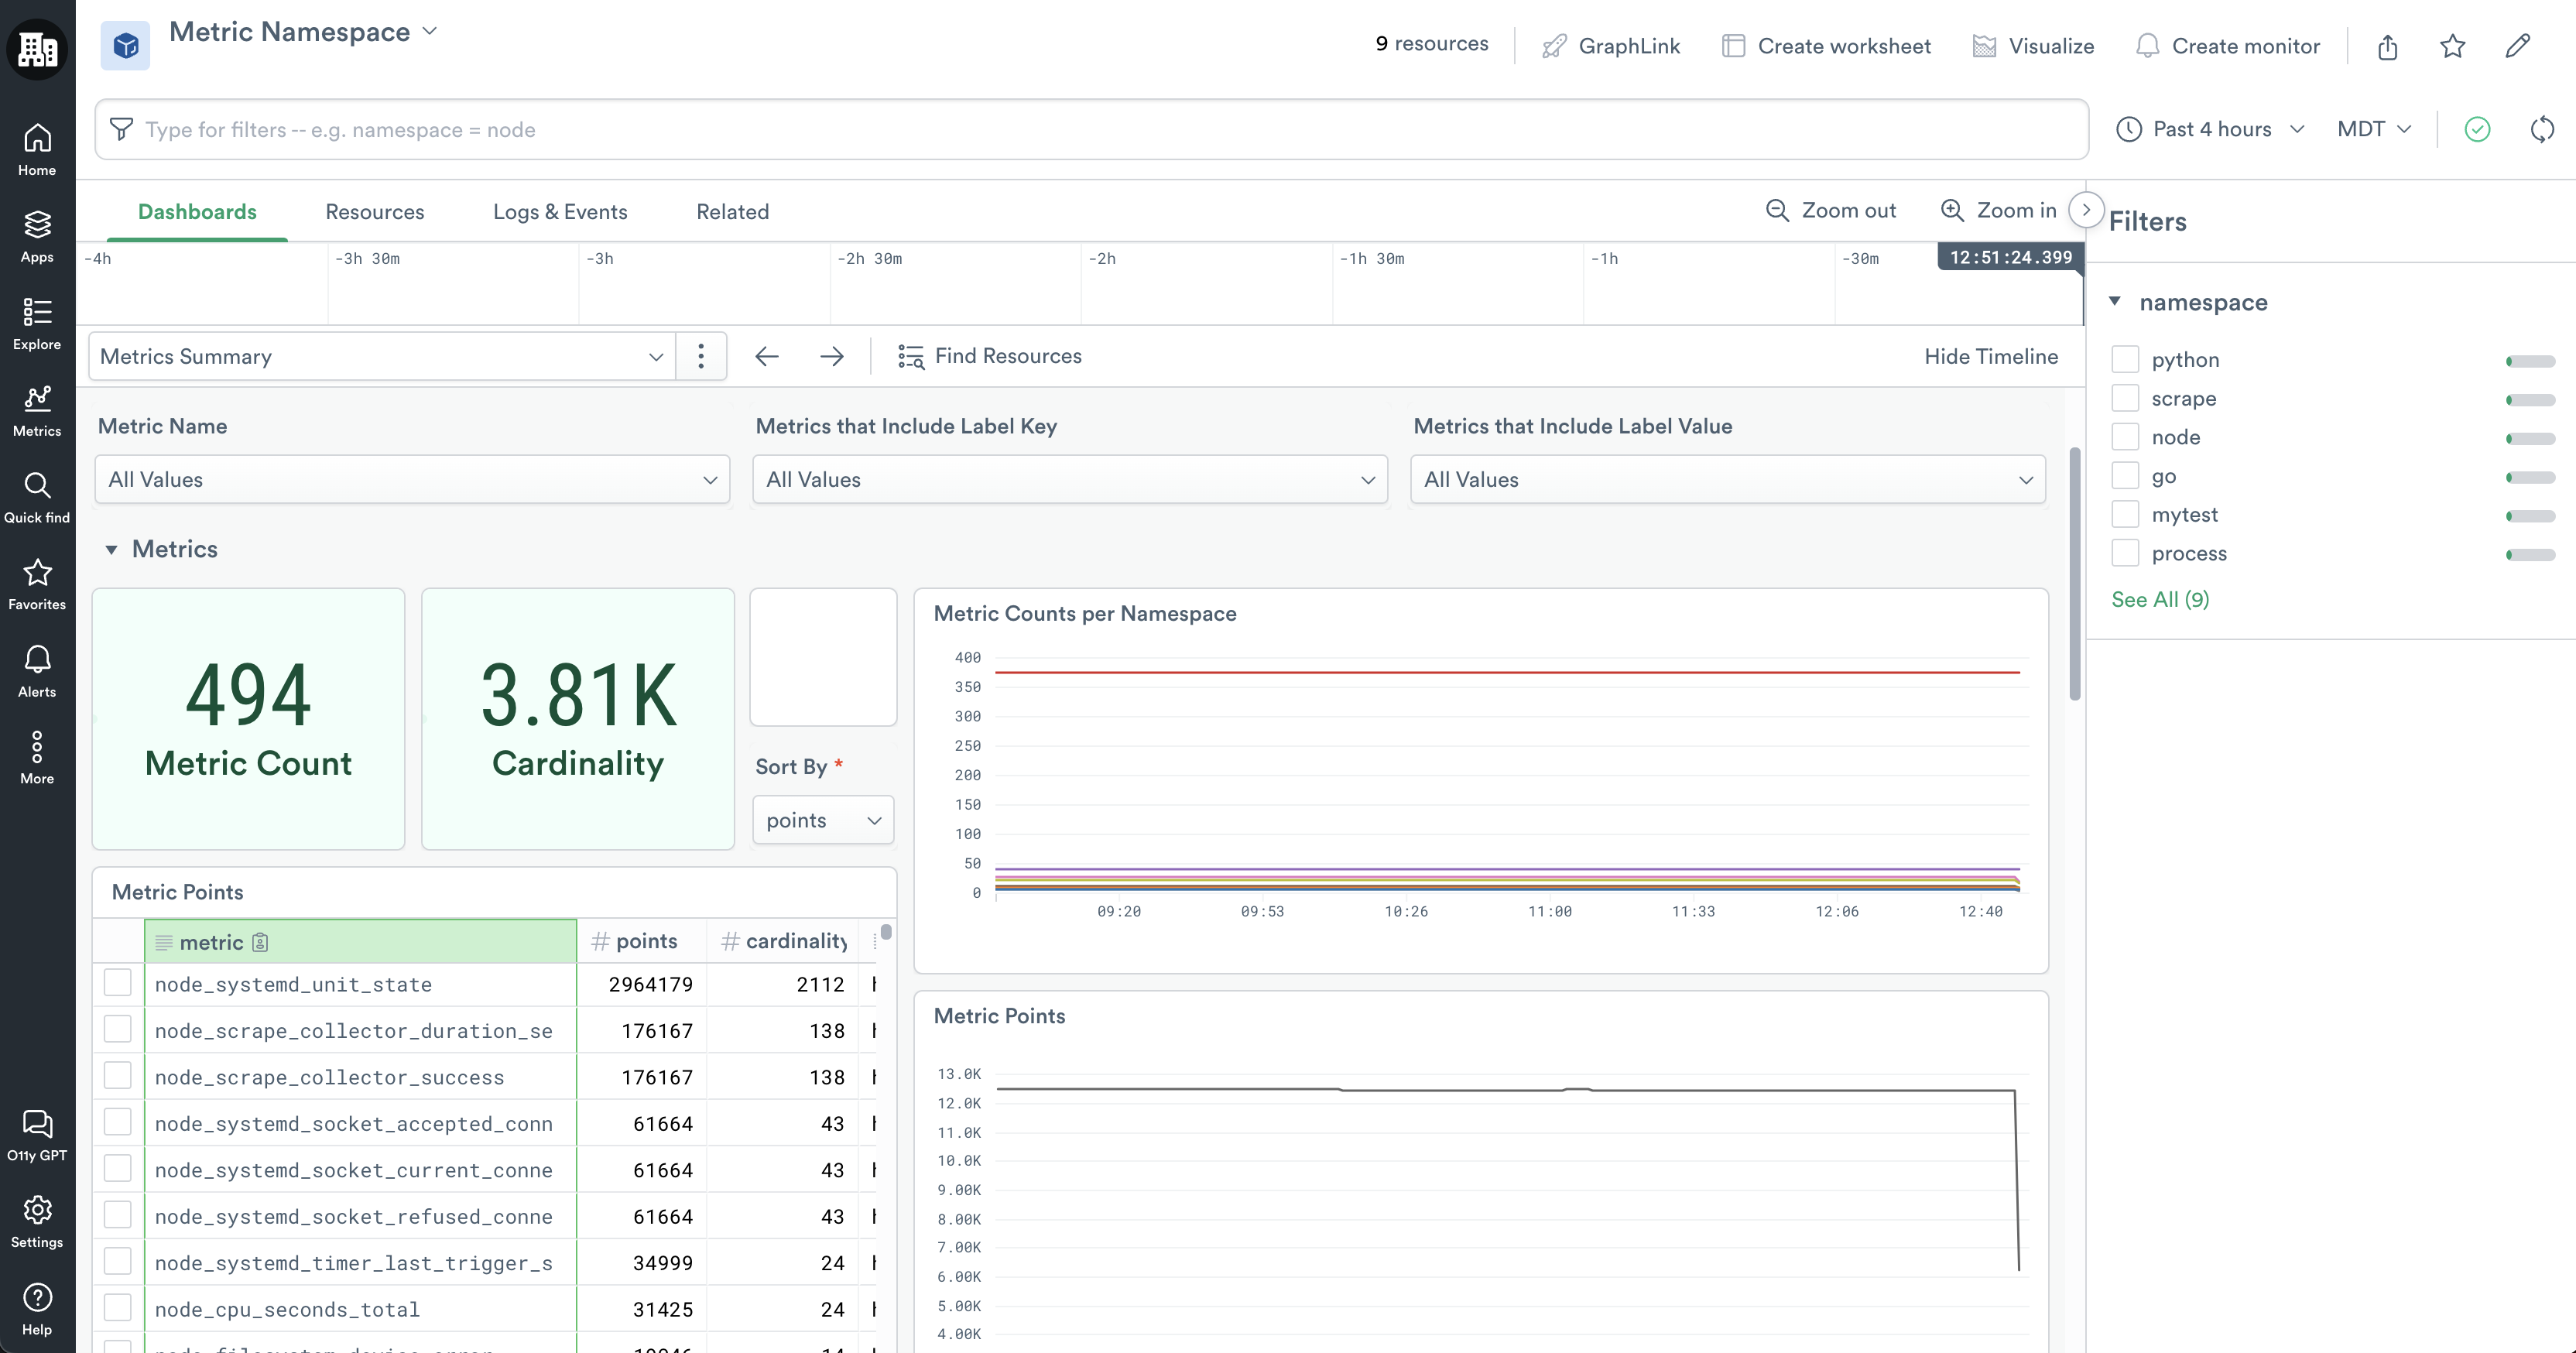
View the Metric Summary dashboard to analyze and troubleshoot how Prometheus generates your metrics by examining the following information:
- What metrics are you capturing within a given metric namespace?
- How many metric points and what kind of cardinality exists for a given metric?
- What labels are being applied to my metrics? (And by extension, what metrics are being collected for
pod:figbar?) - How do I know if my Prometheus scrape jobs work?
Updated 6 months ago
Did this page help you?