View MySQL data in Observe
After installing the MySQL app, view the health of your MySQL DB instances by going to the Instance dataset in Observe. This dataset models the instances of MySQL DB running in your environment, whether you manage the instance on a host or through a managed service on a cloud provider. This dataset offers GraphLinks to the following resources:
- Metrics
- General Logs
- Slow Query Logs
- Error Logs
From this resource, you can filter to any number of MySQL DB instances and use the default dashboards to get insight into health and status.
MySQL/Monitoring
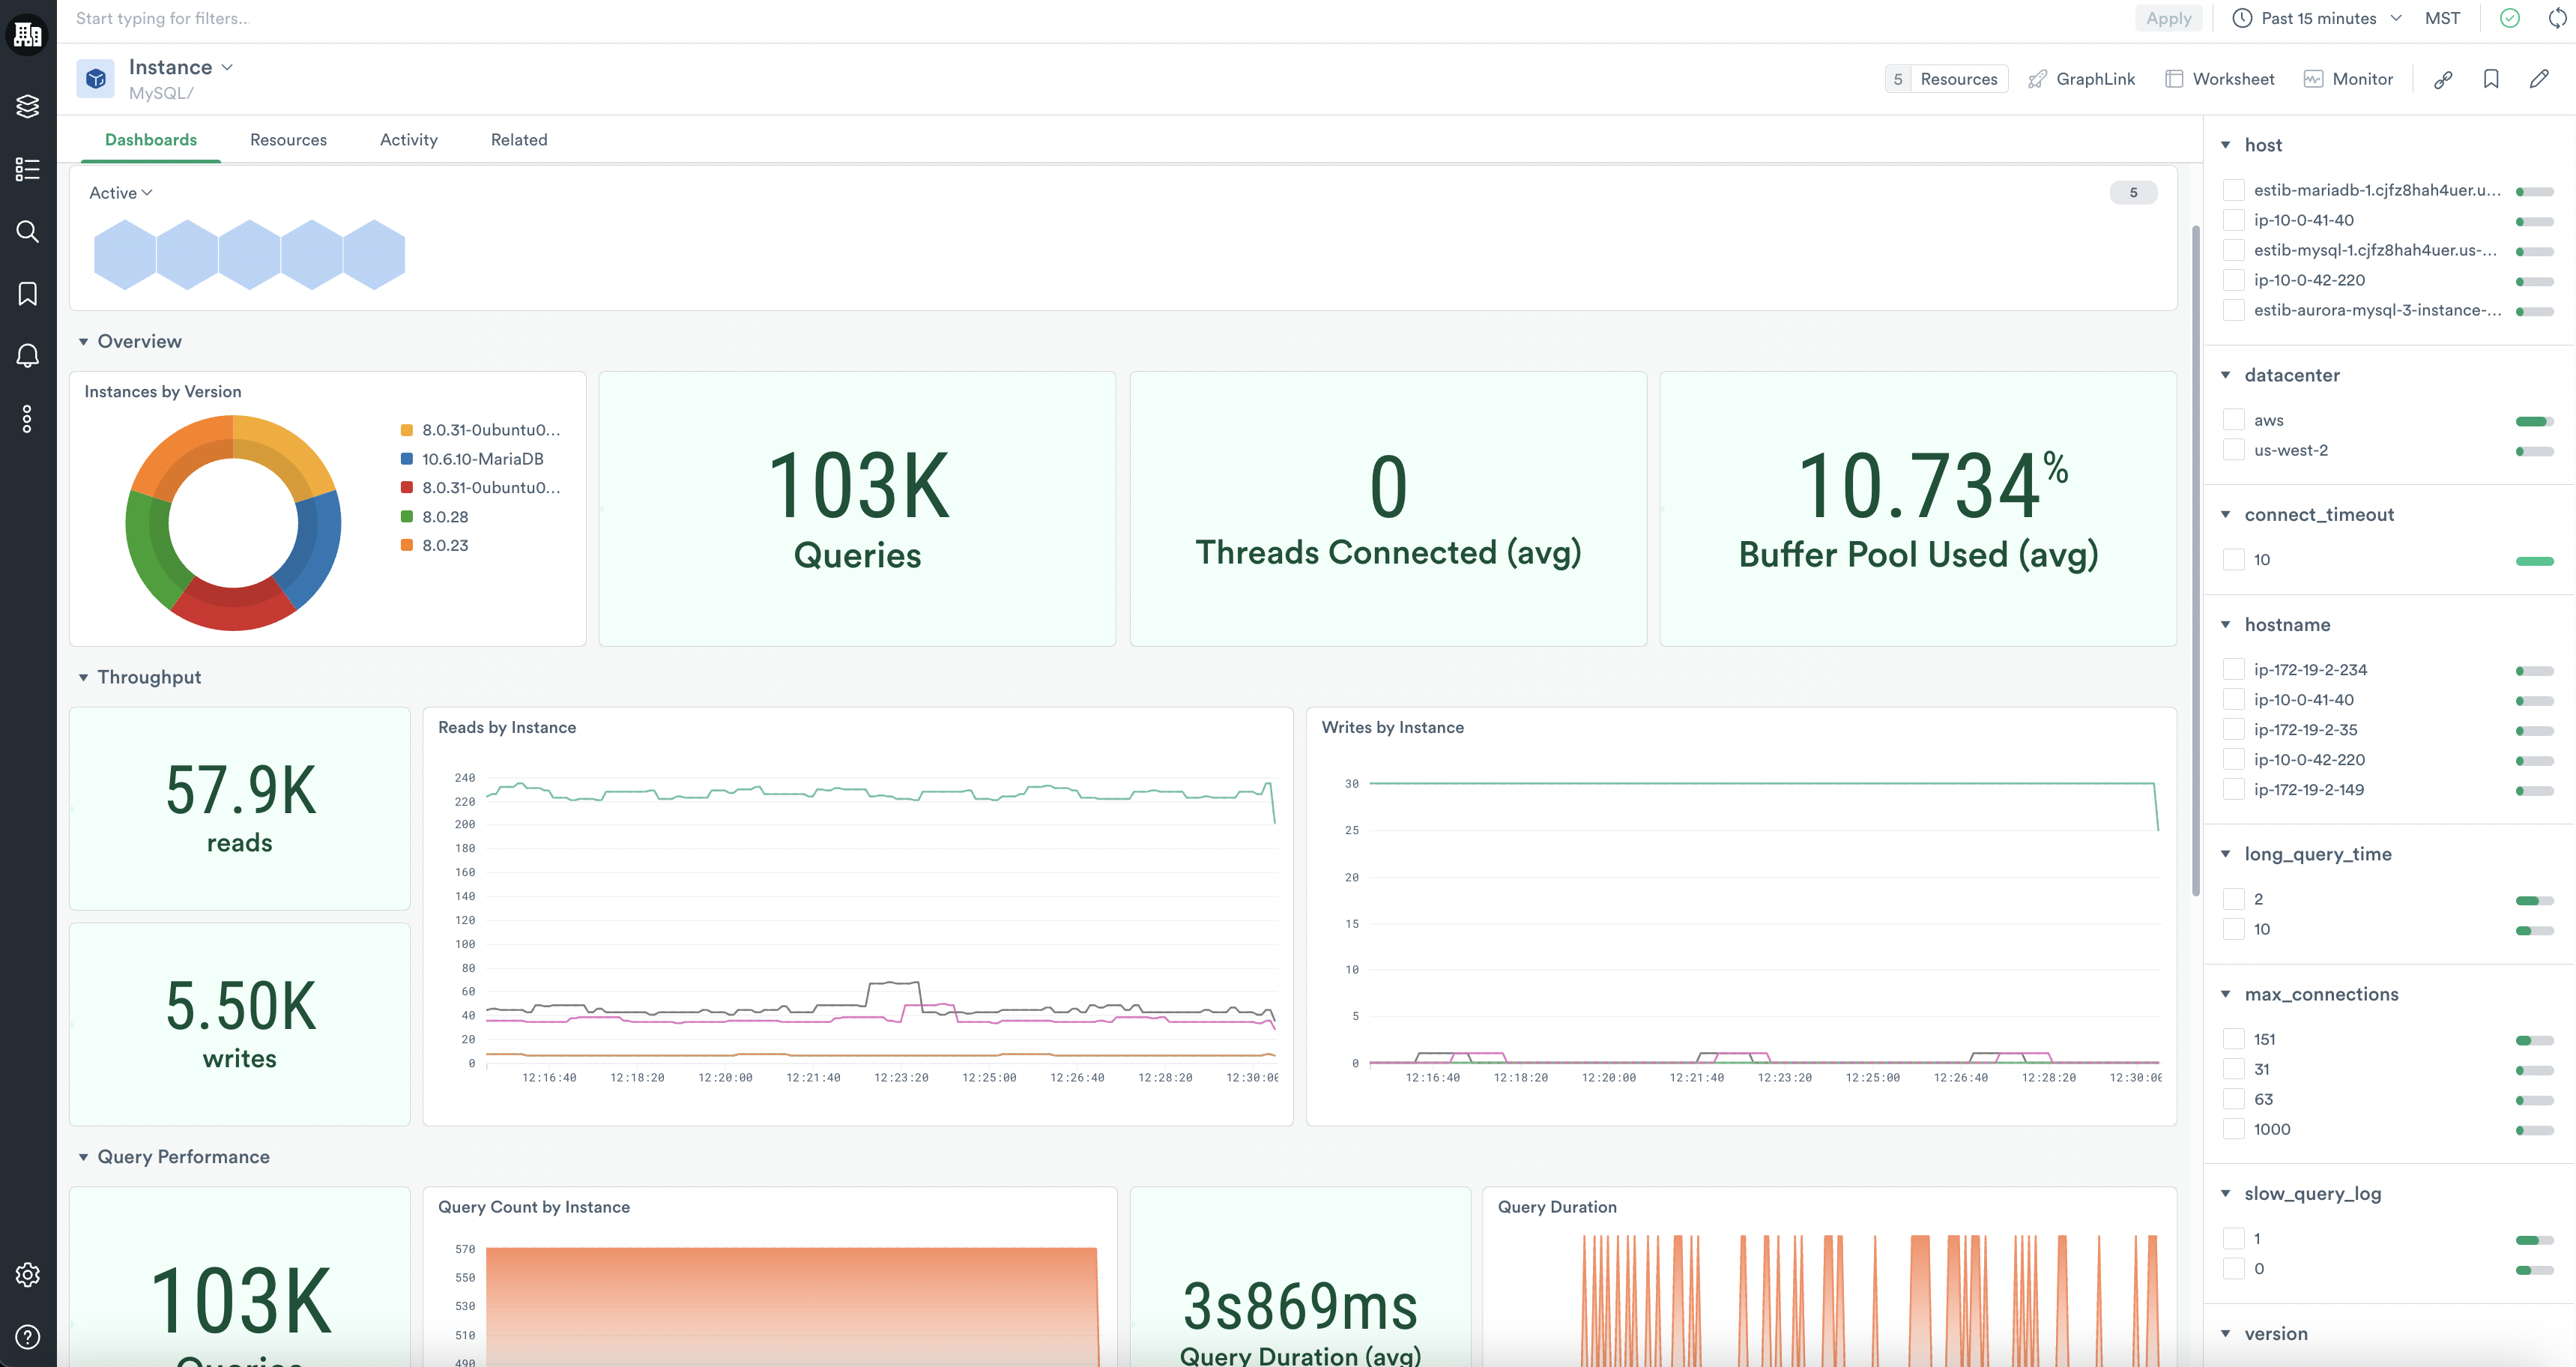
The MySQL/Monitoring dashboard displays key metrics for your MySQL DB instances, including throughput, query performance, concurrency, and buffer pool usage summaries. As you identify significant trends and anomalies in this dashboard, you can pivot to other, more specific dashboards to dive into deeper investigations.
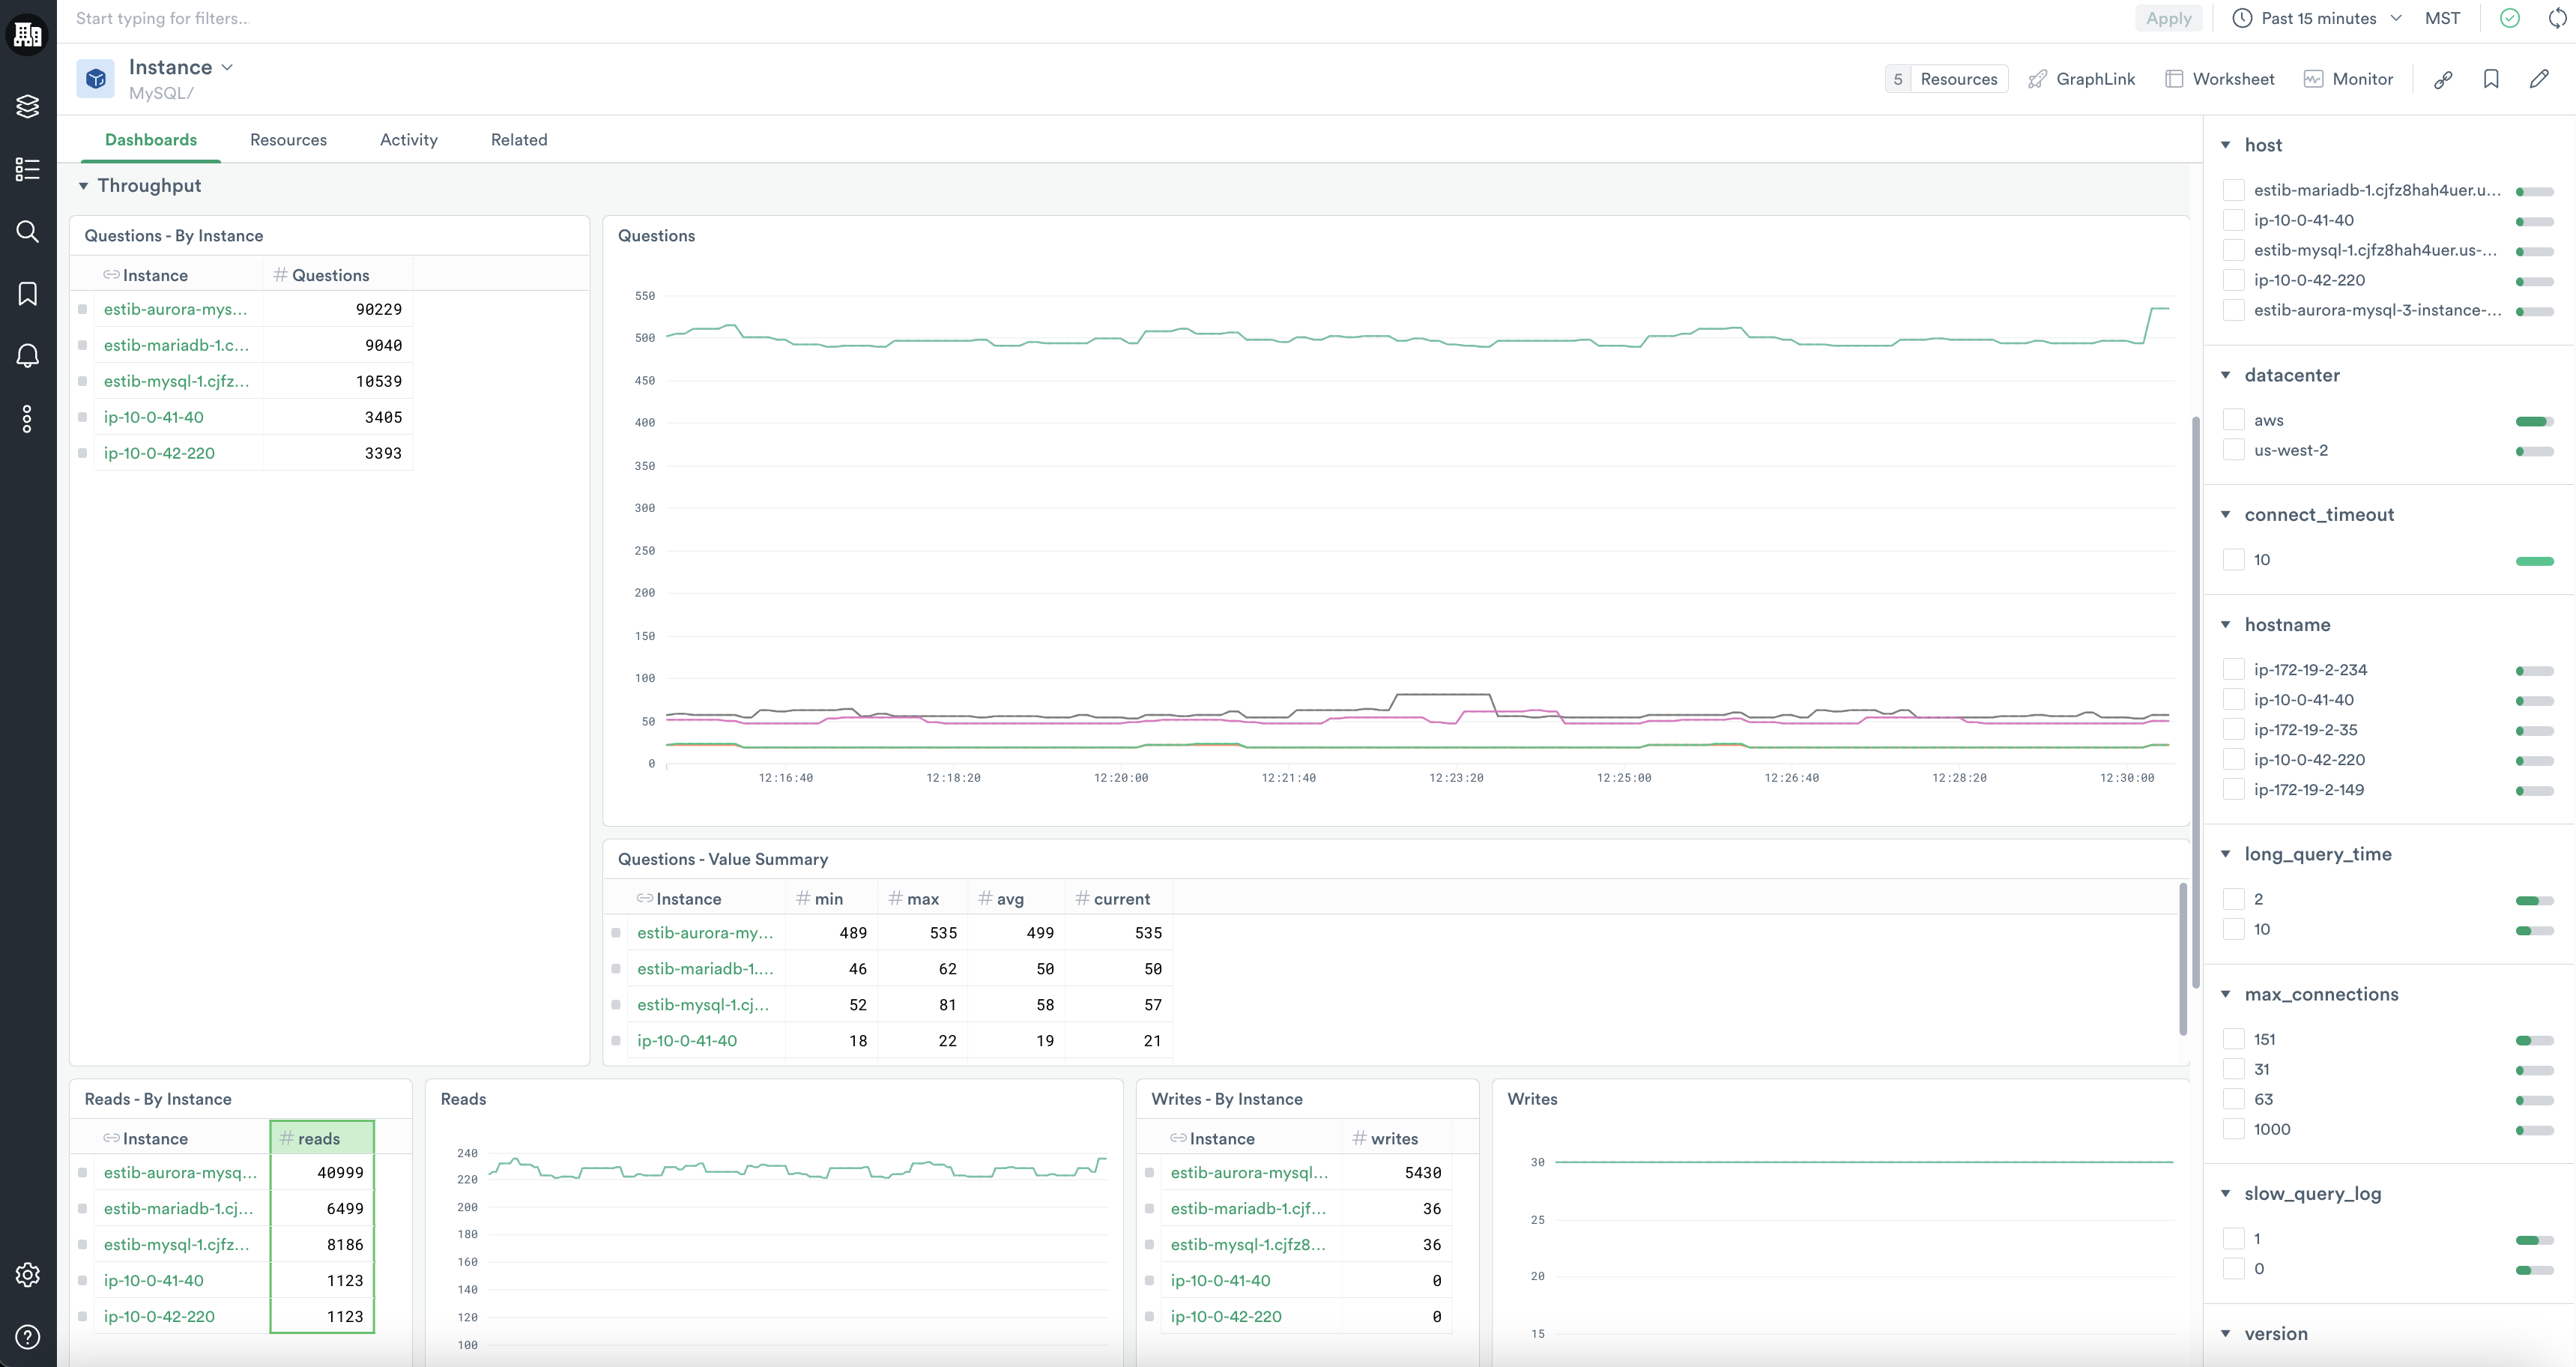
MySQL/Throughput
The MySQL/Throughput dashboard gives you a deeper view into the questions, reads, and writes on your instances overall and by instance.
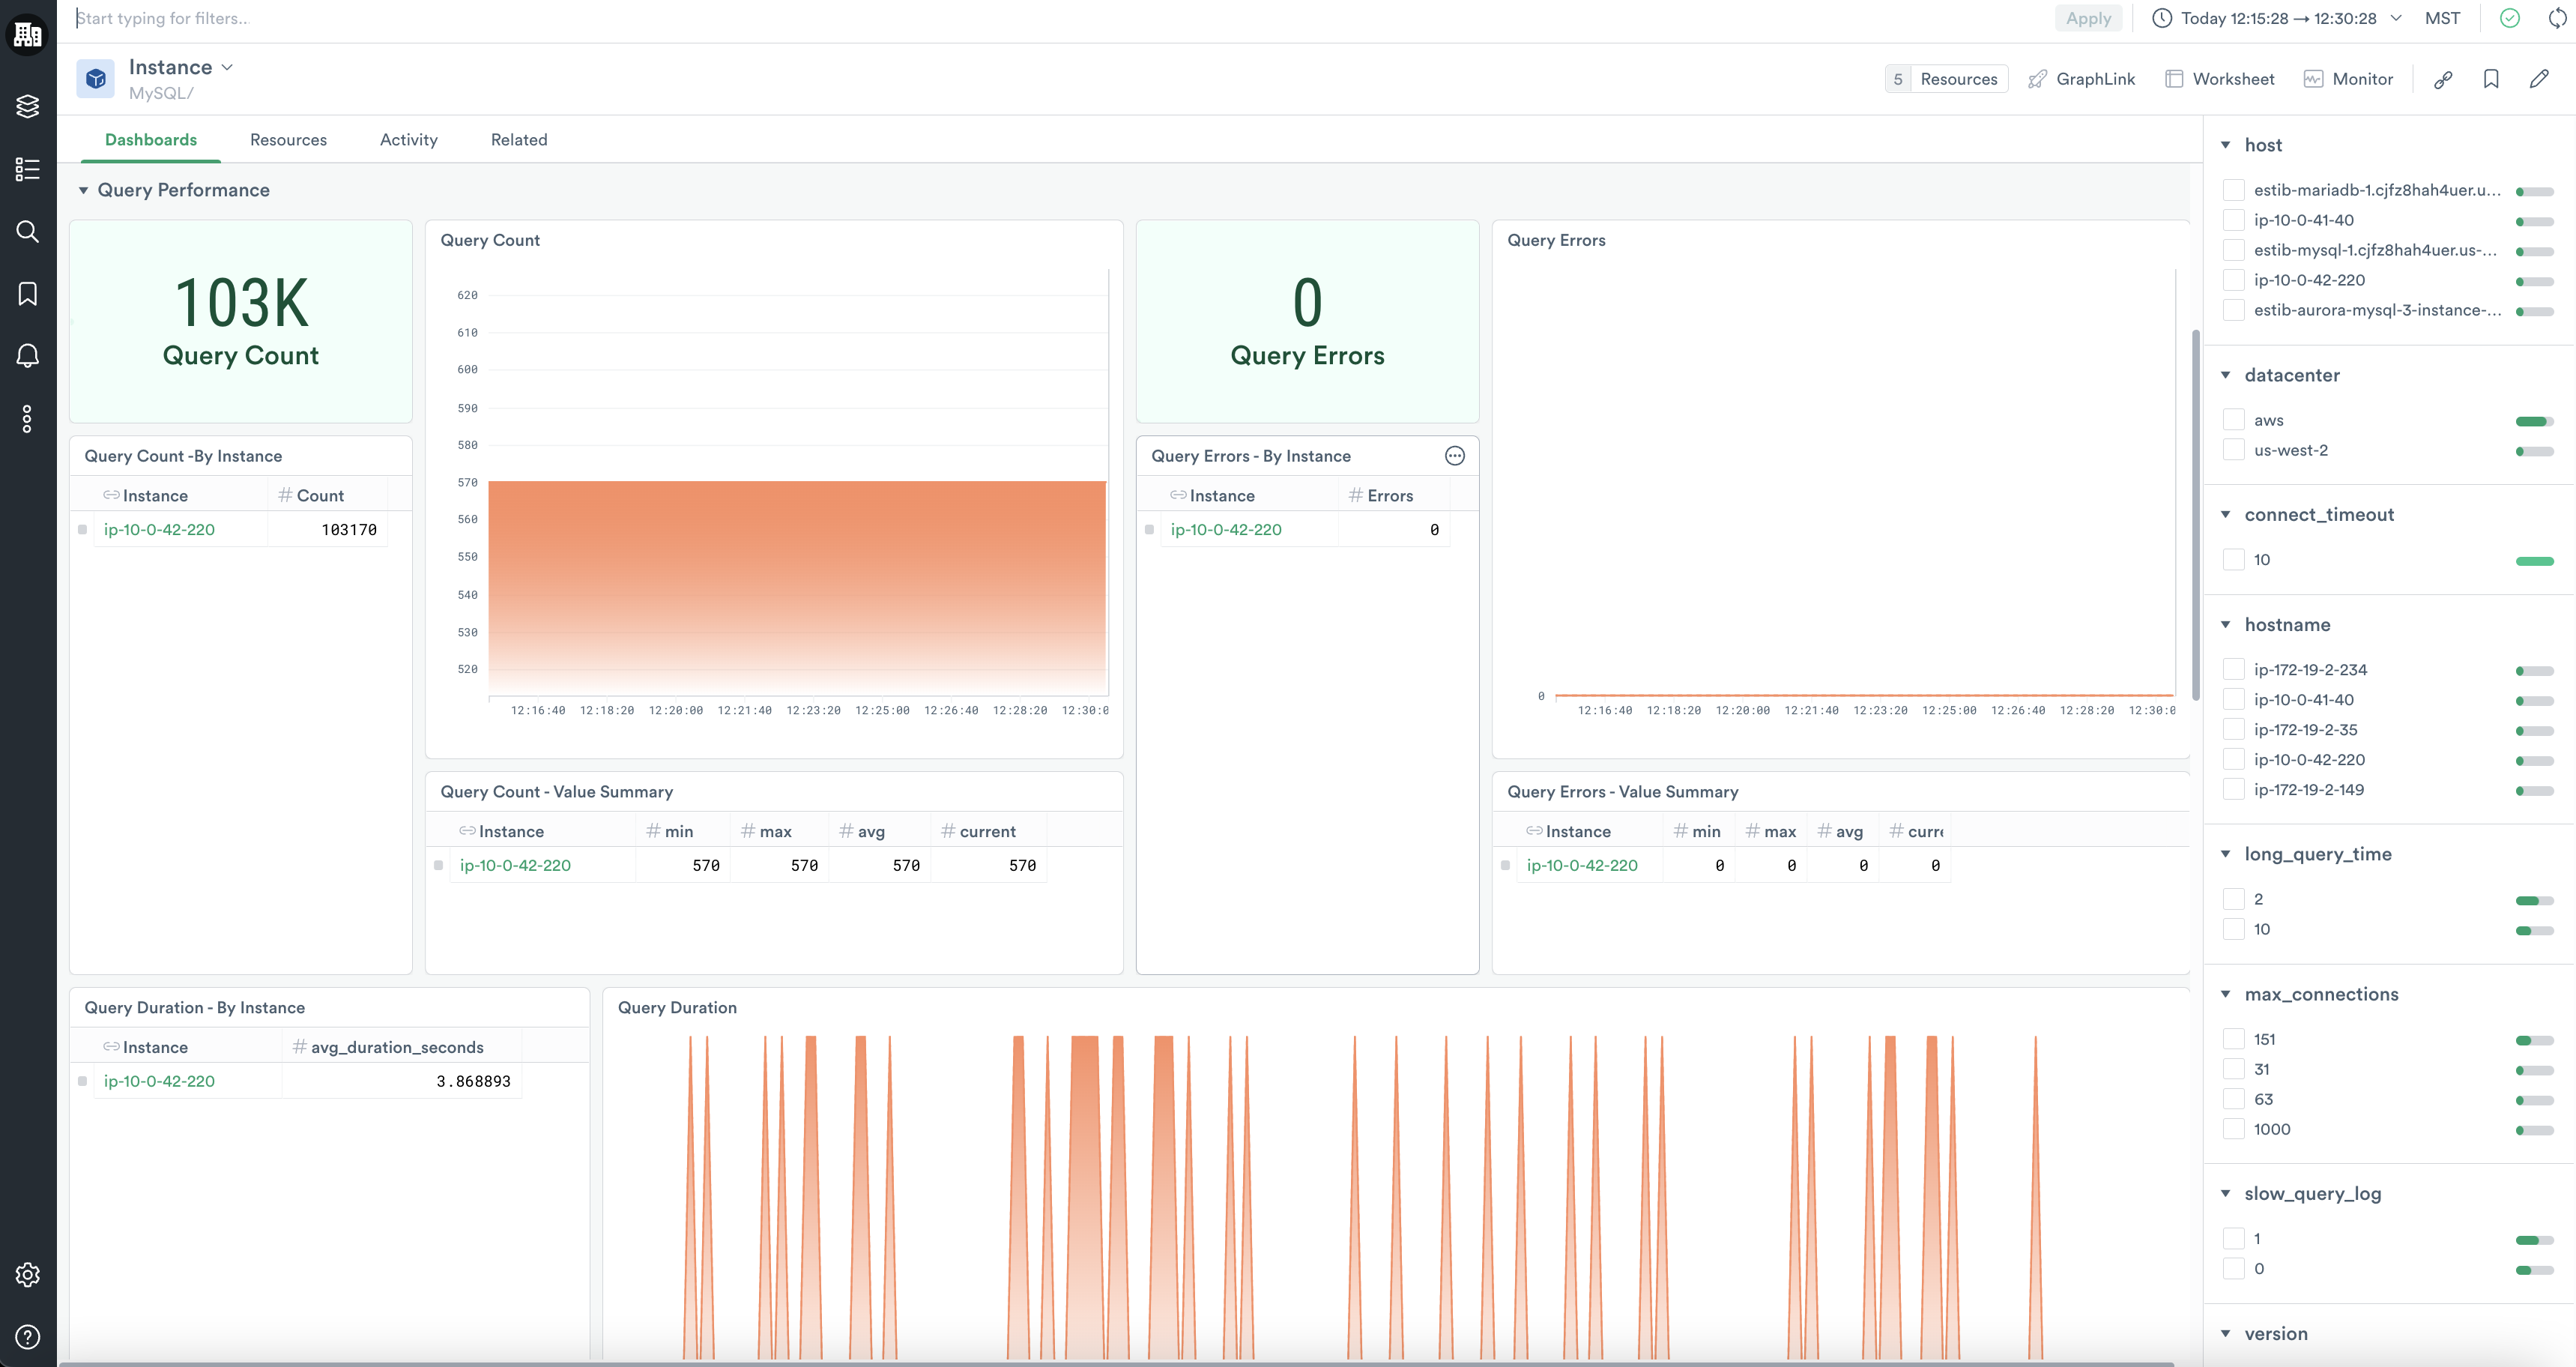
MySQL/Query Performance
With the MySQL/Query Performance dashboard, you can explore the rate and latency of queries, errors, and slow queries on your database instances. You can even inspect the queries that encountered slowness during execution.
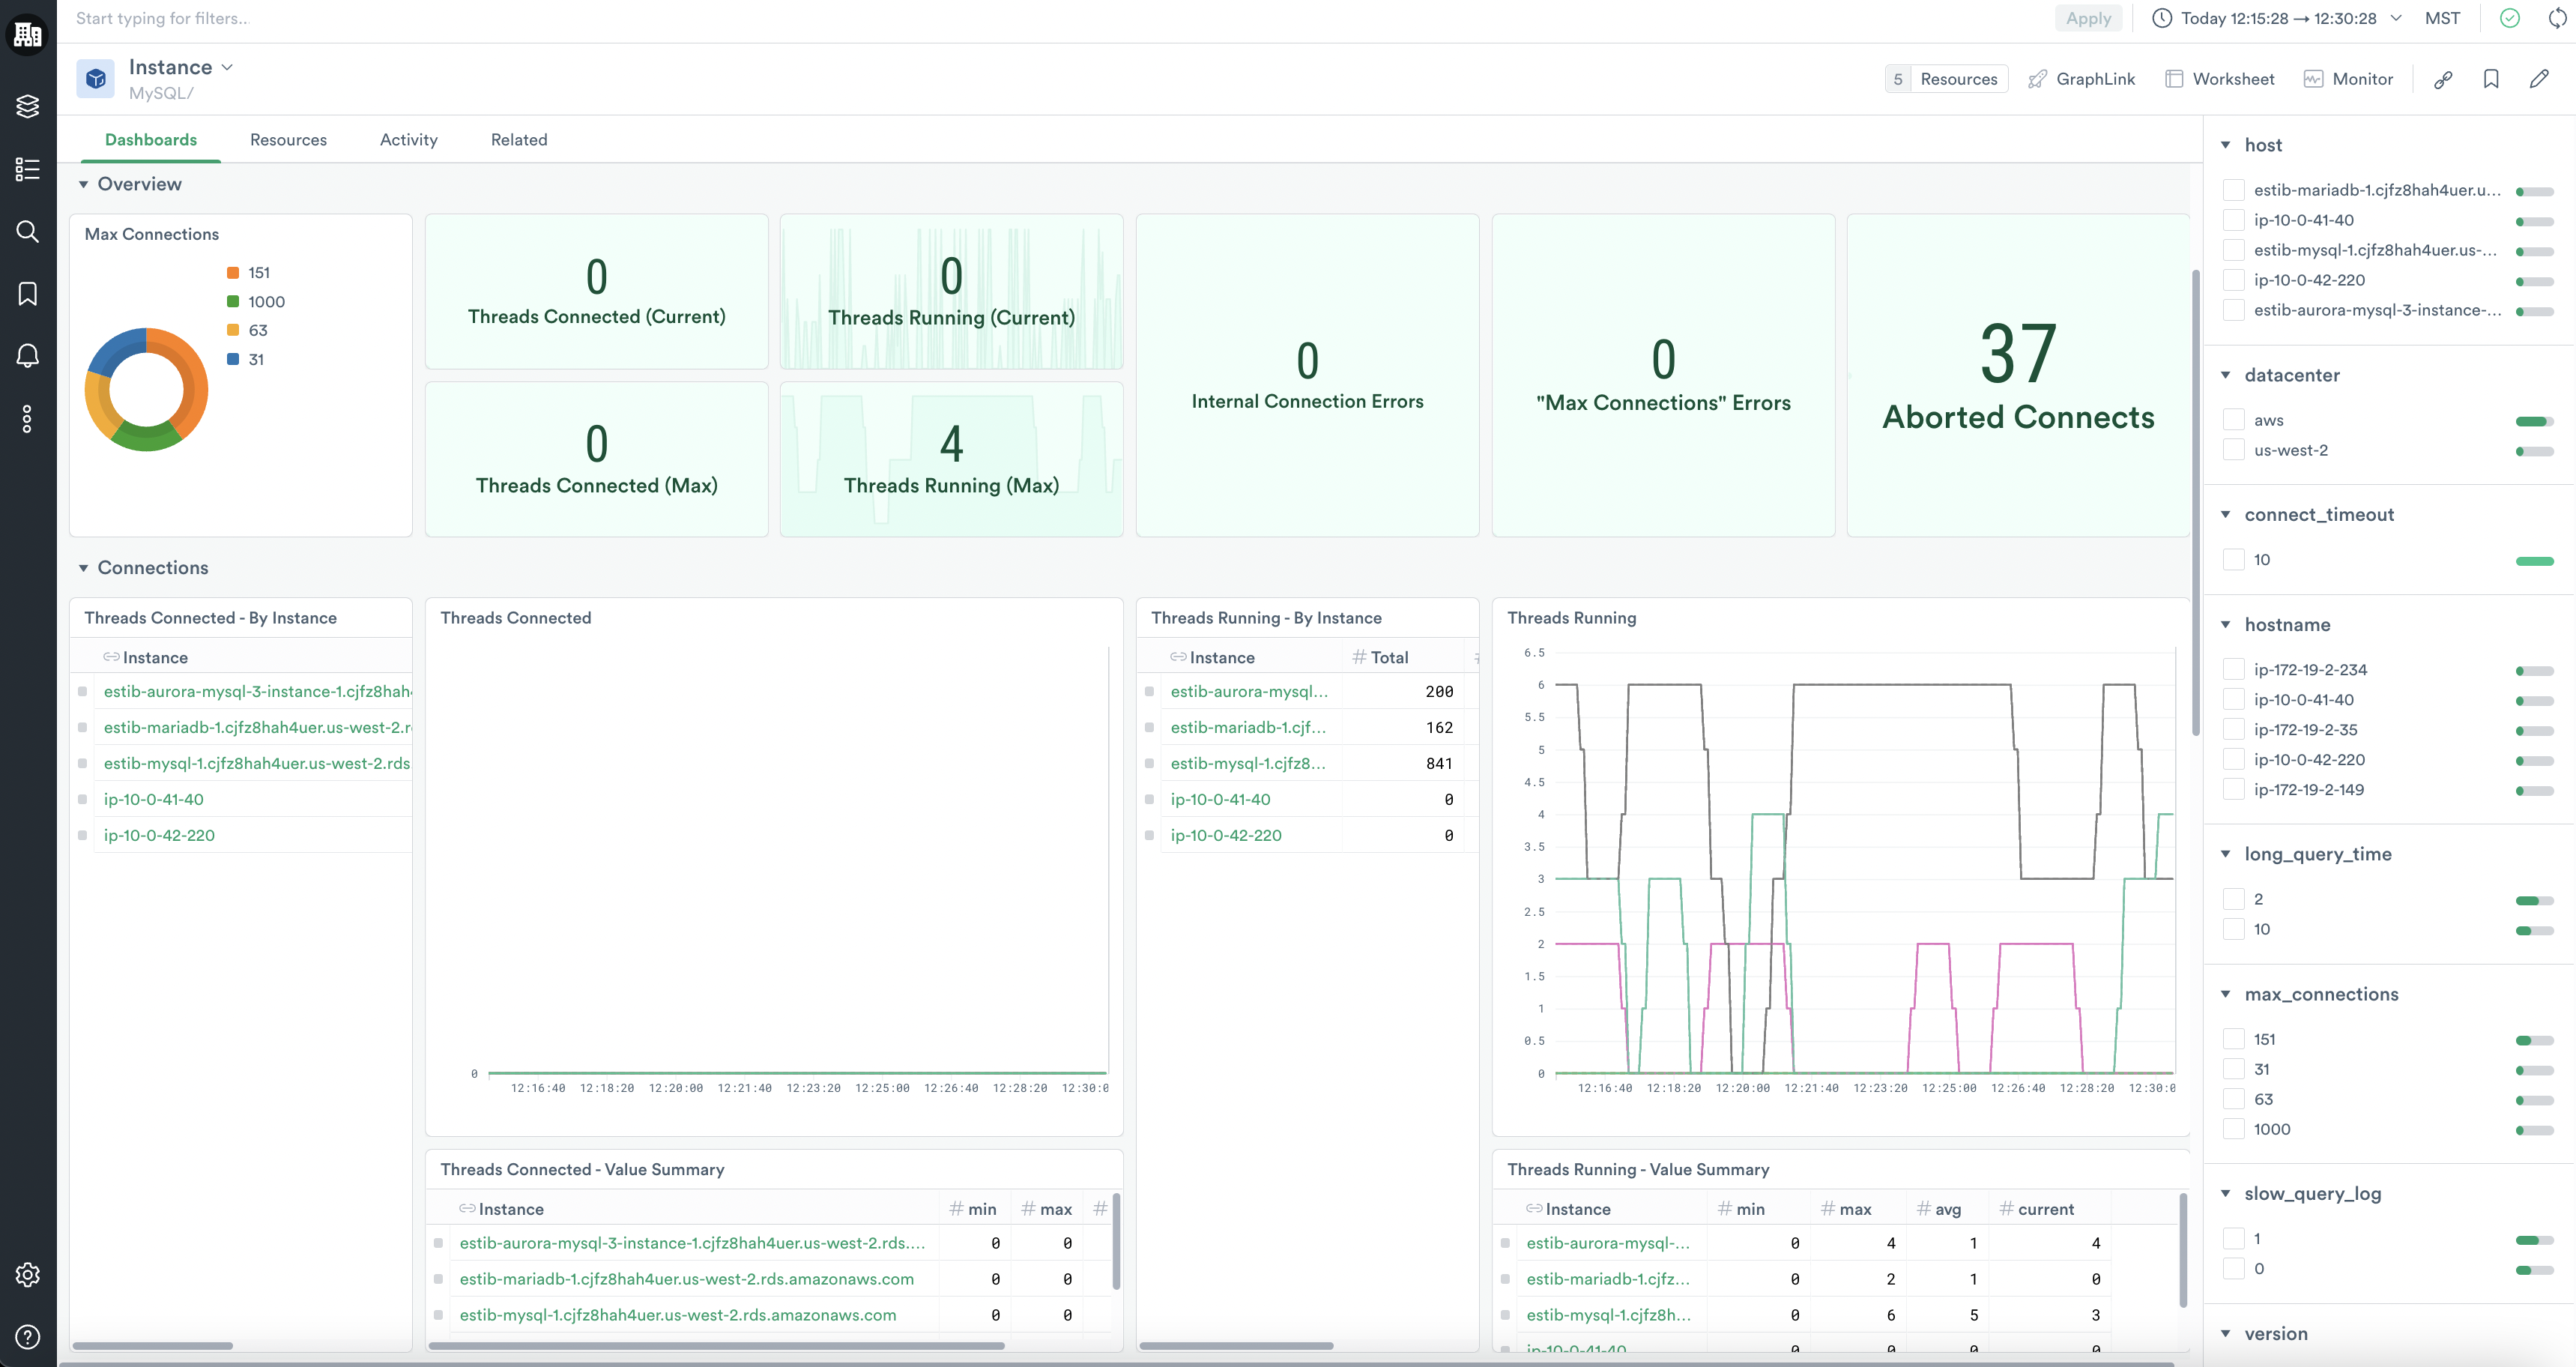
MySQL/Concurrency
The MySQL/Concurrency dashboard details the counts of connections and connection errors by instance in sum and over time.
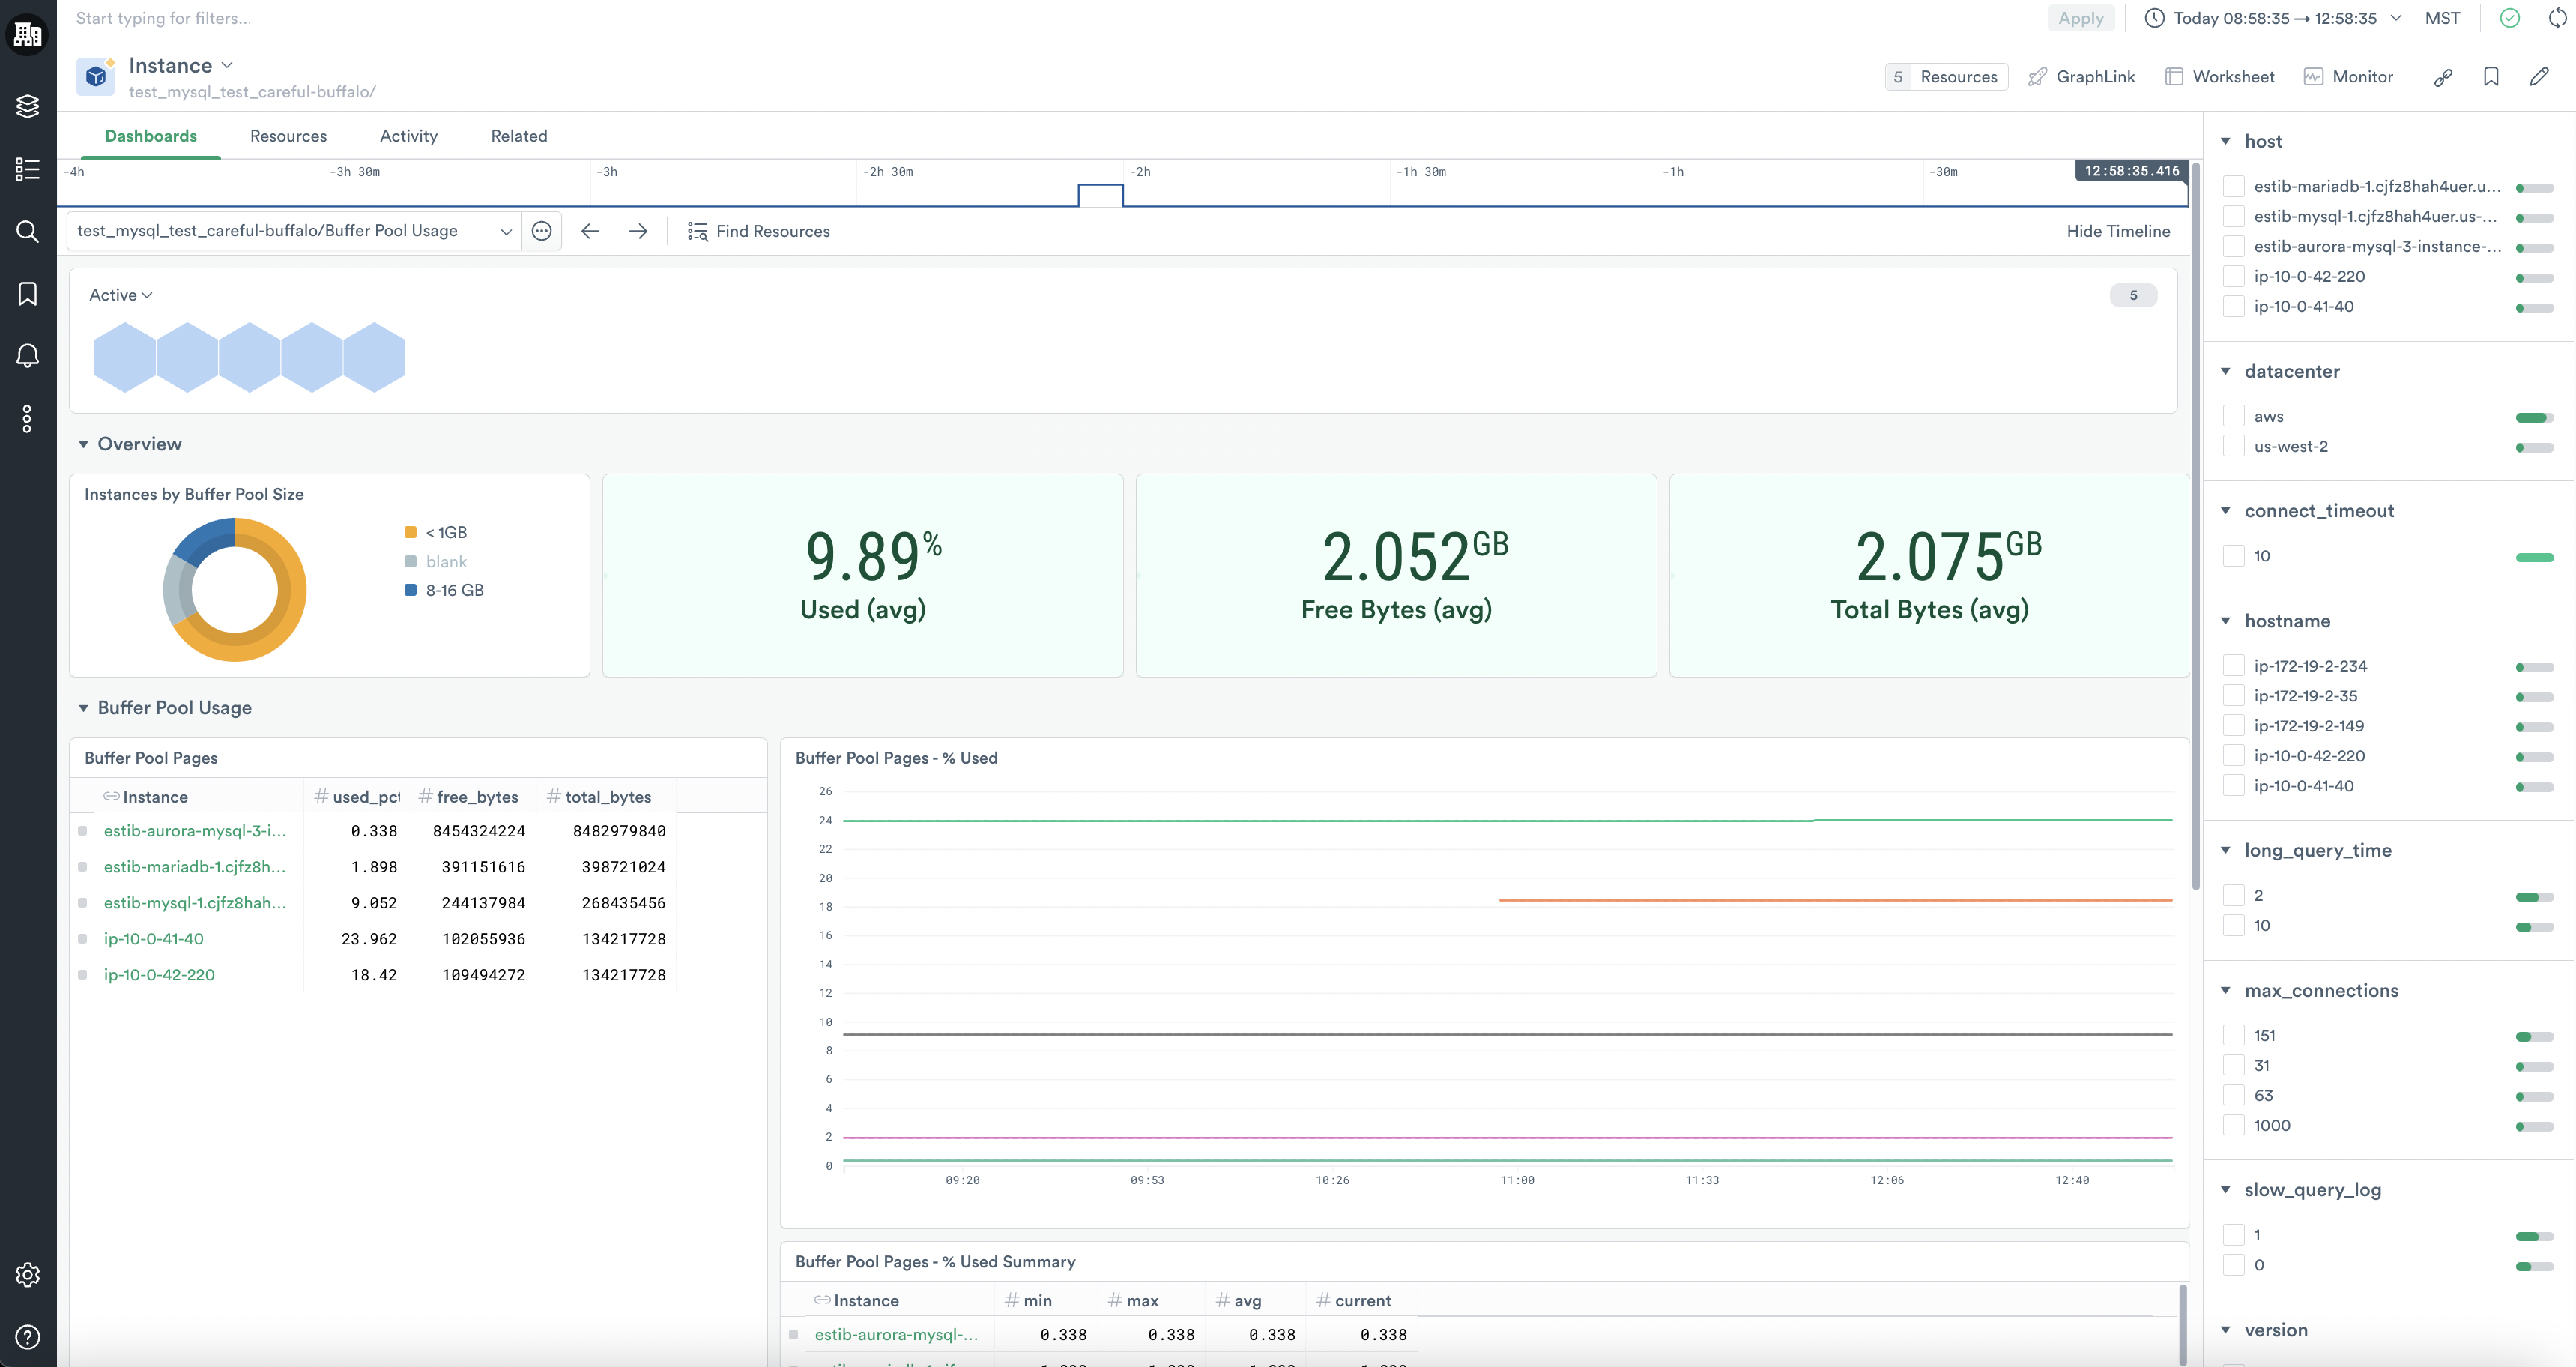
MySQL/Buffer Pool Usage
With the MySQL/Buffer Pool Usage dashboard, you can inspect how much of your buffer pool is in use as a percentage and bytes, and you can see how many reads and read requests were made on your instances' buffer pools.
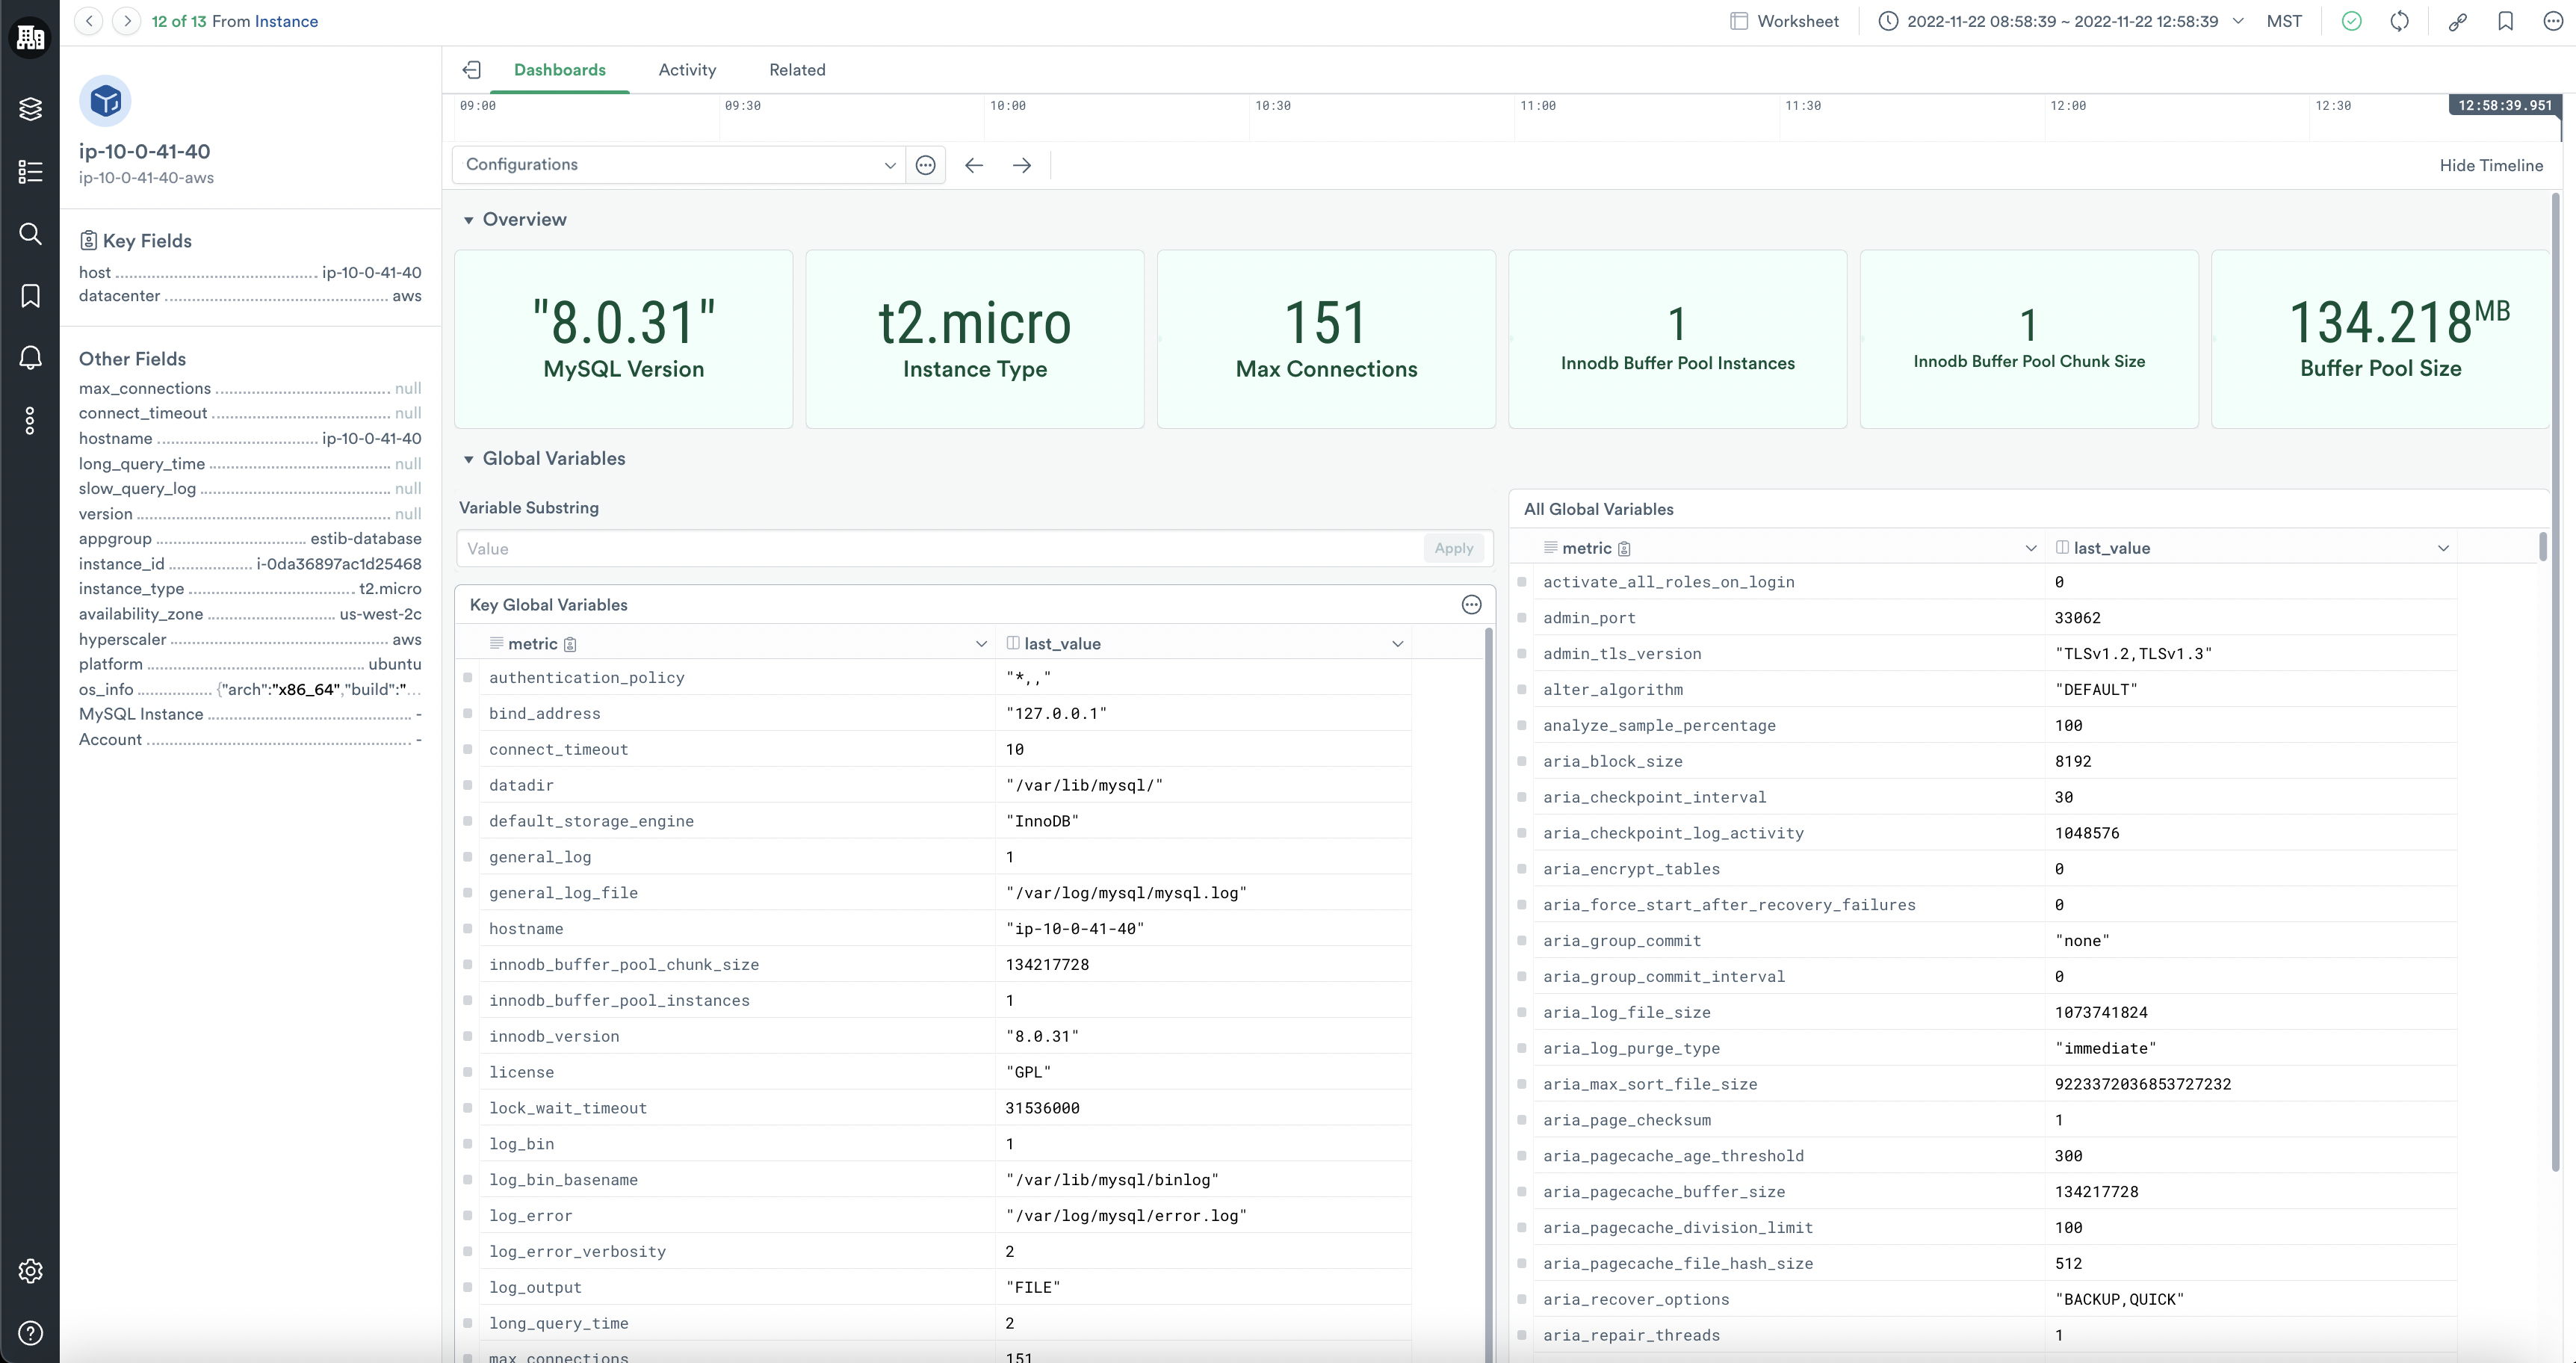
MySQL/Configurations
By clicking through a specific resource instance, you can also review the global variables of your database instance in the MySQL/Configurations dashboard without logging into the server. You can filter these variables by substring to quickly find the specific configurations of interest.
Updated 9 months ago