Trace Explorer
Learn how you can inspect trace data in the Trace Explorer.
The Trace Explorer in Observe enables you to investigate user requests and transactions by analyzing trace data. With powerful filtering and visualization tools including the flame chart and waterfall view, you can connect these requests to the underlying services, infrastructure, or other resources that processed them. Whether you’re troubleshooting errors, inspecting performance bottlenecks, or analyzing specific requests, the Trace Explorer helps you quickly pinpoint and resolve issues.
For more information on how Observe makes trace data available, see APM reference.
Access the Trace Explorer
To access the Trace Explorer, click Traces in the left navigation rail in Observe.
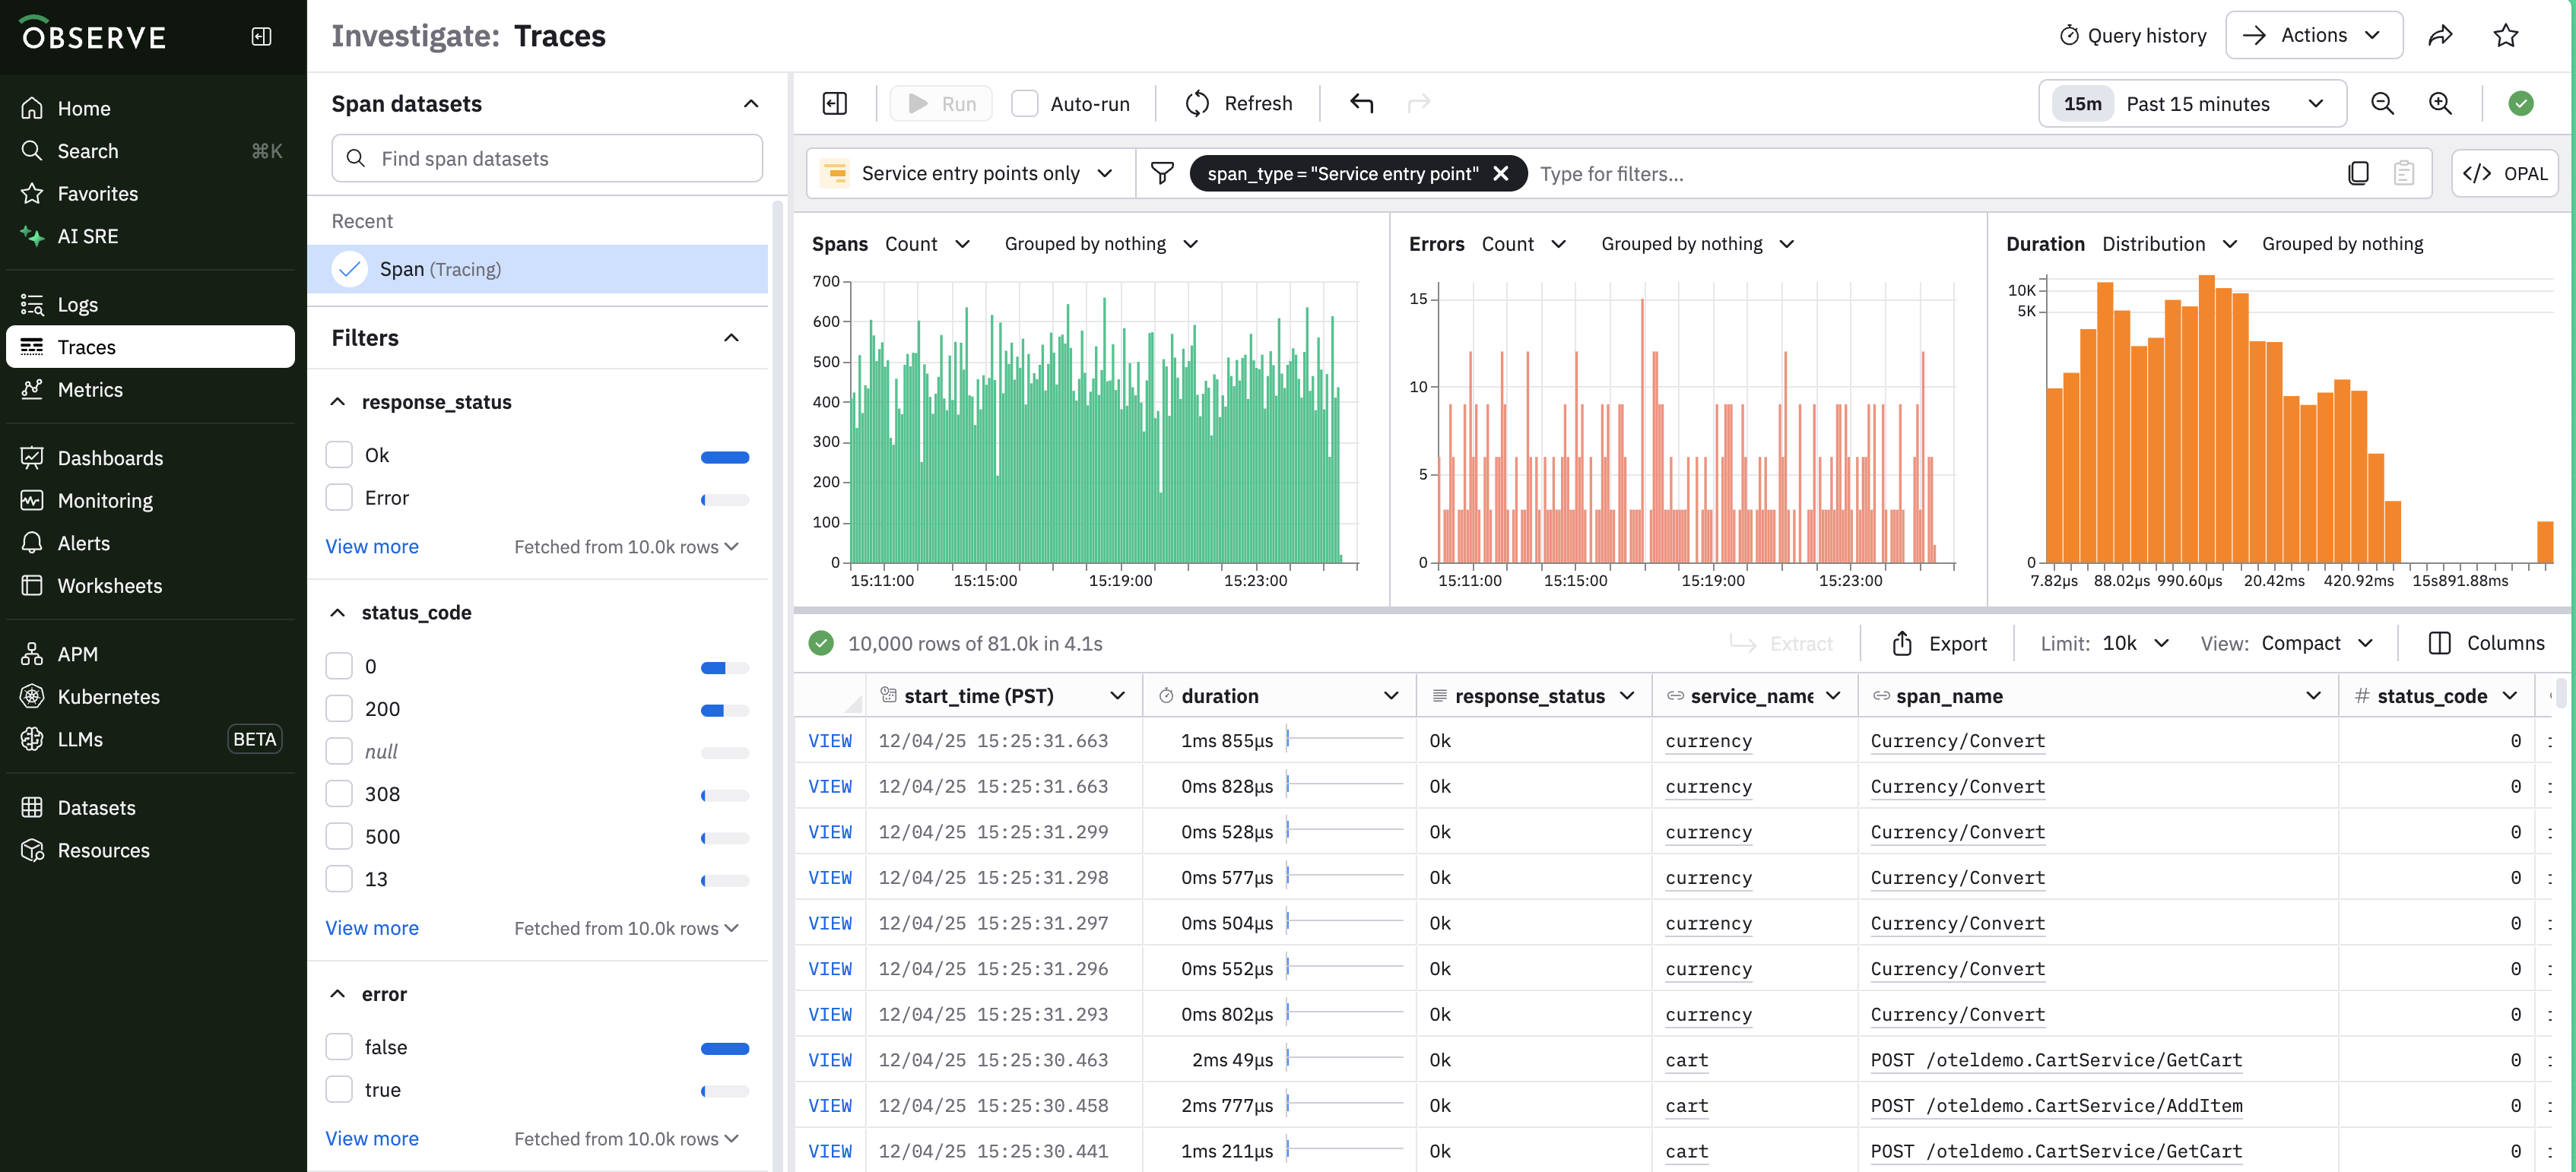
Filter what you see in the Trace Explorer
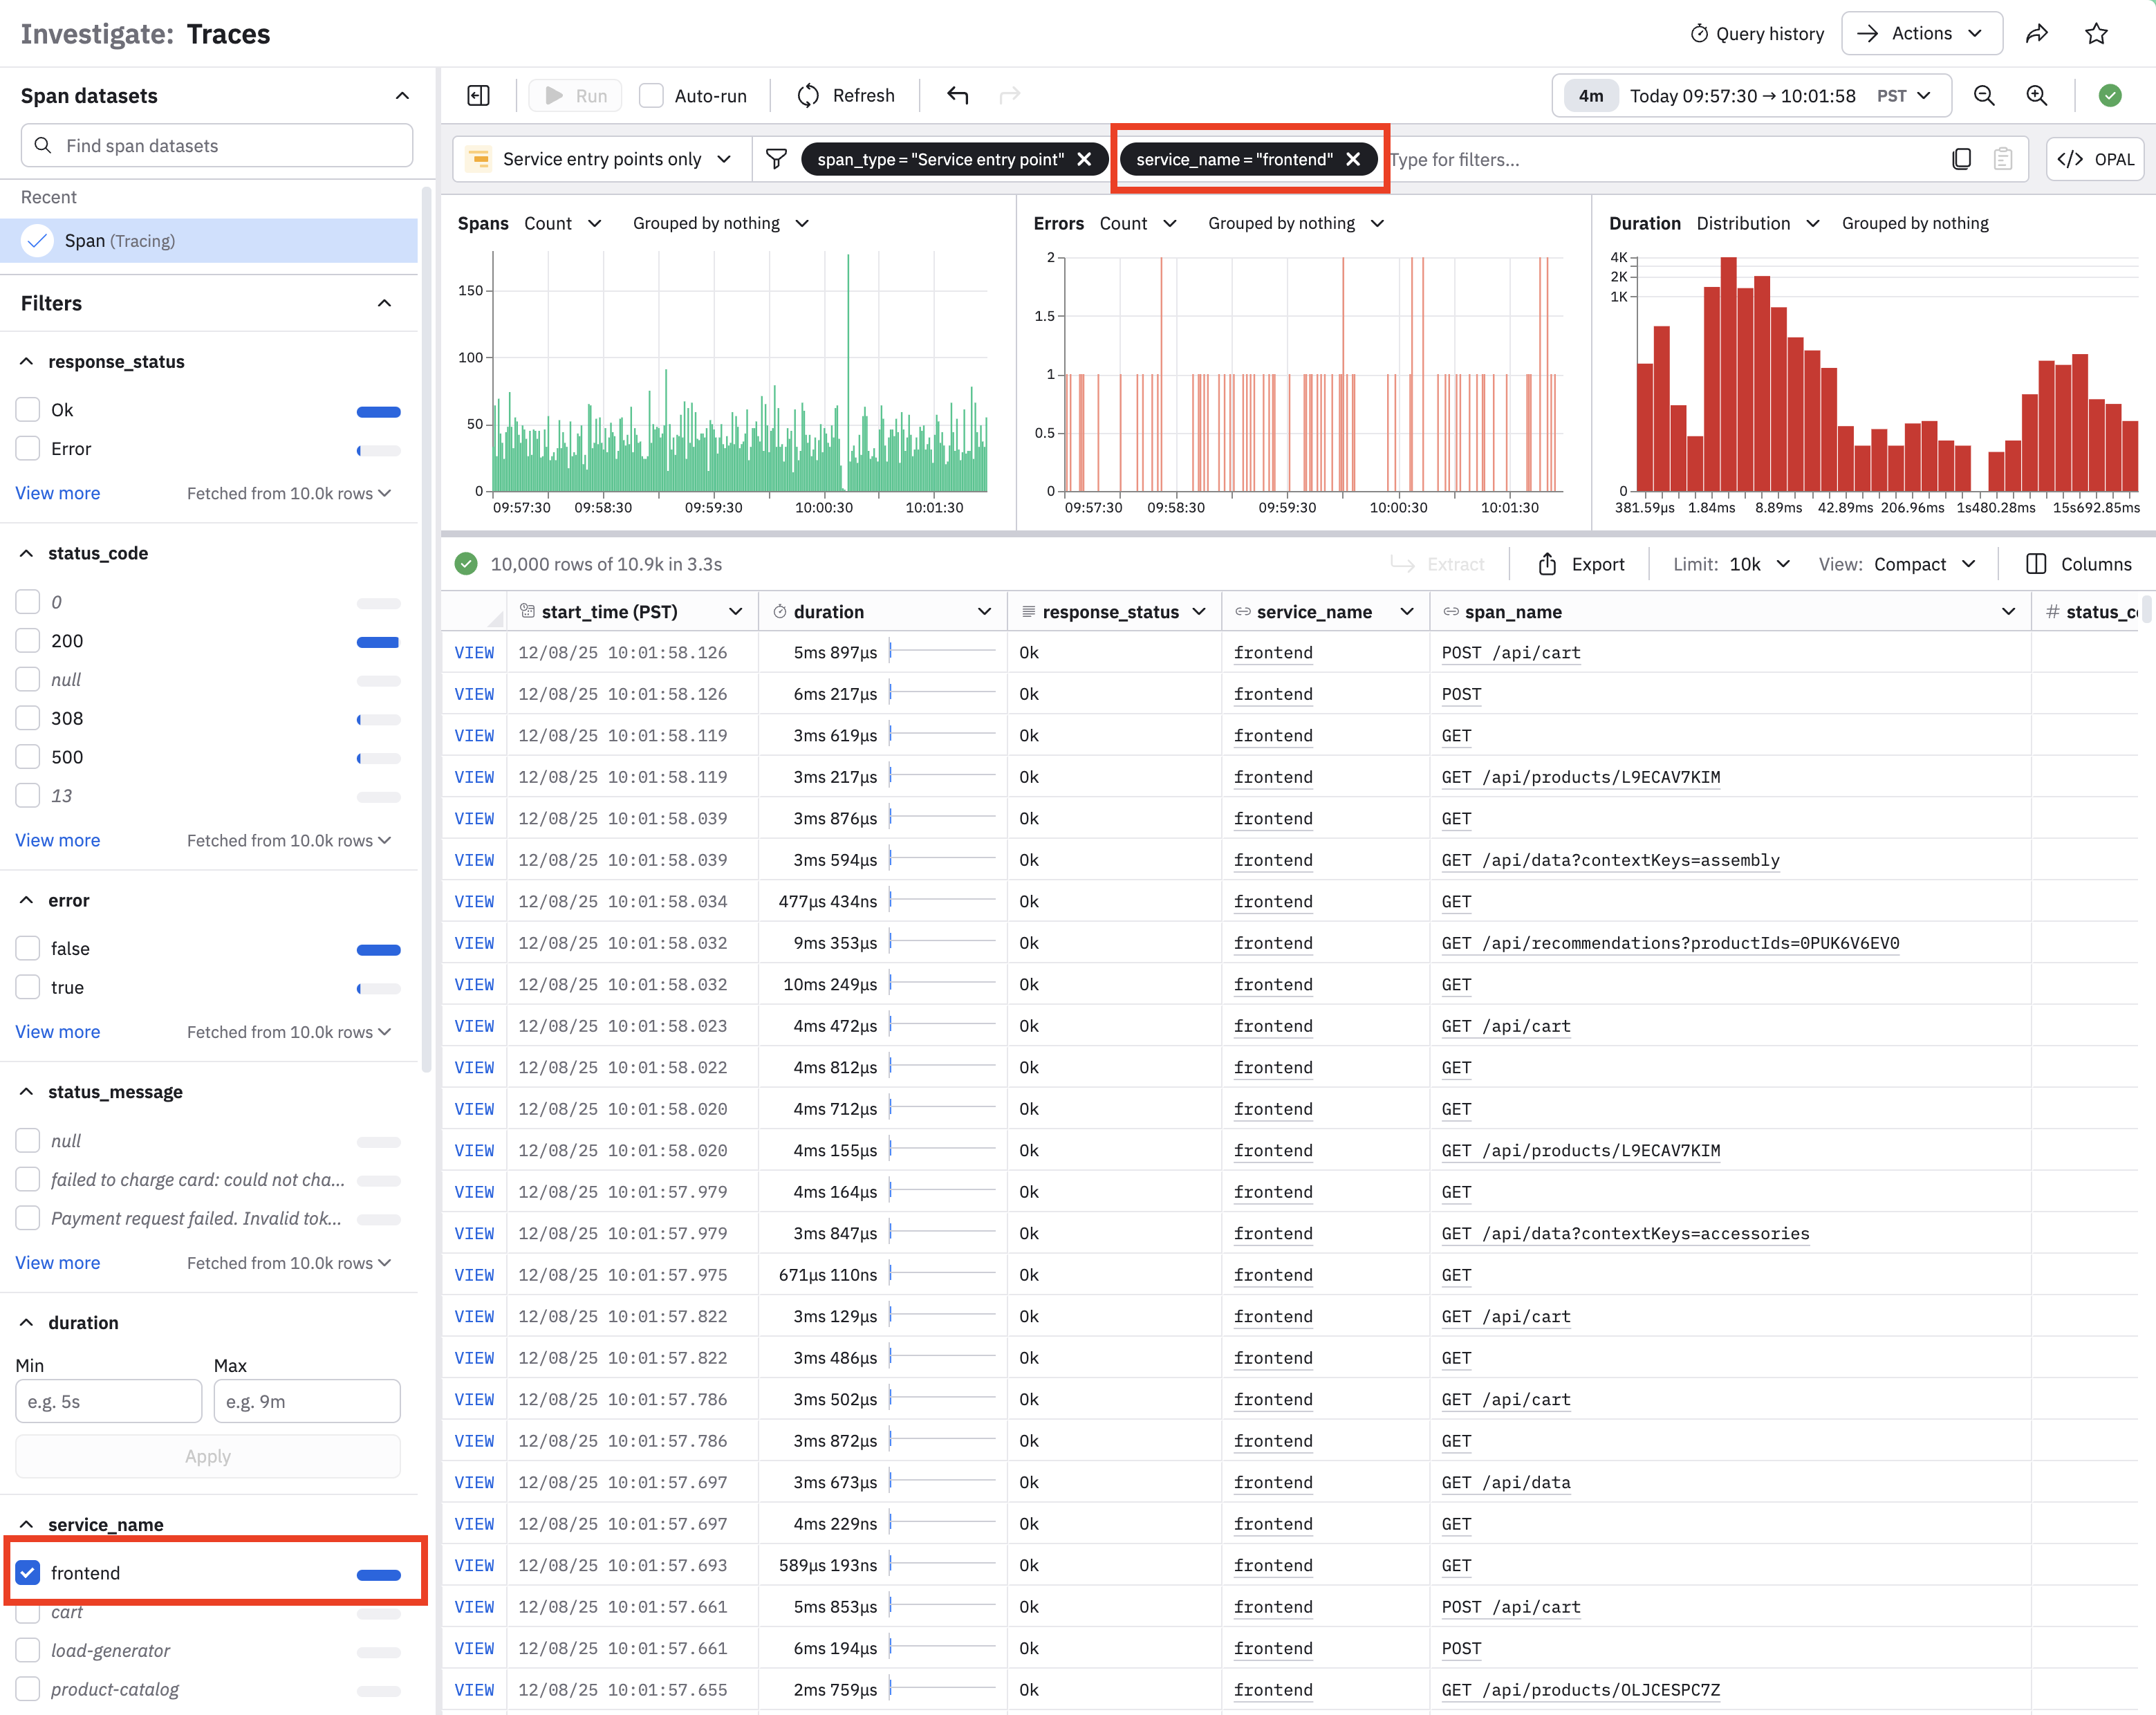
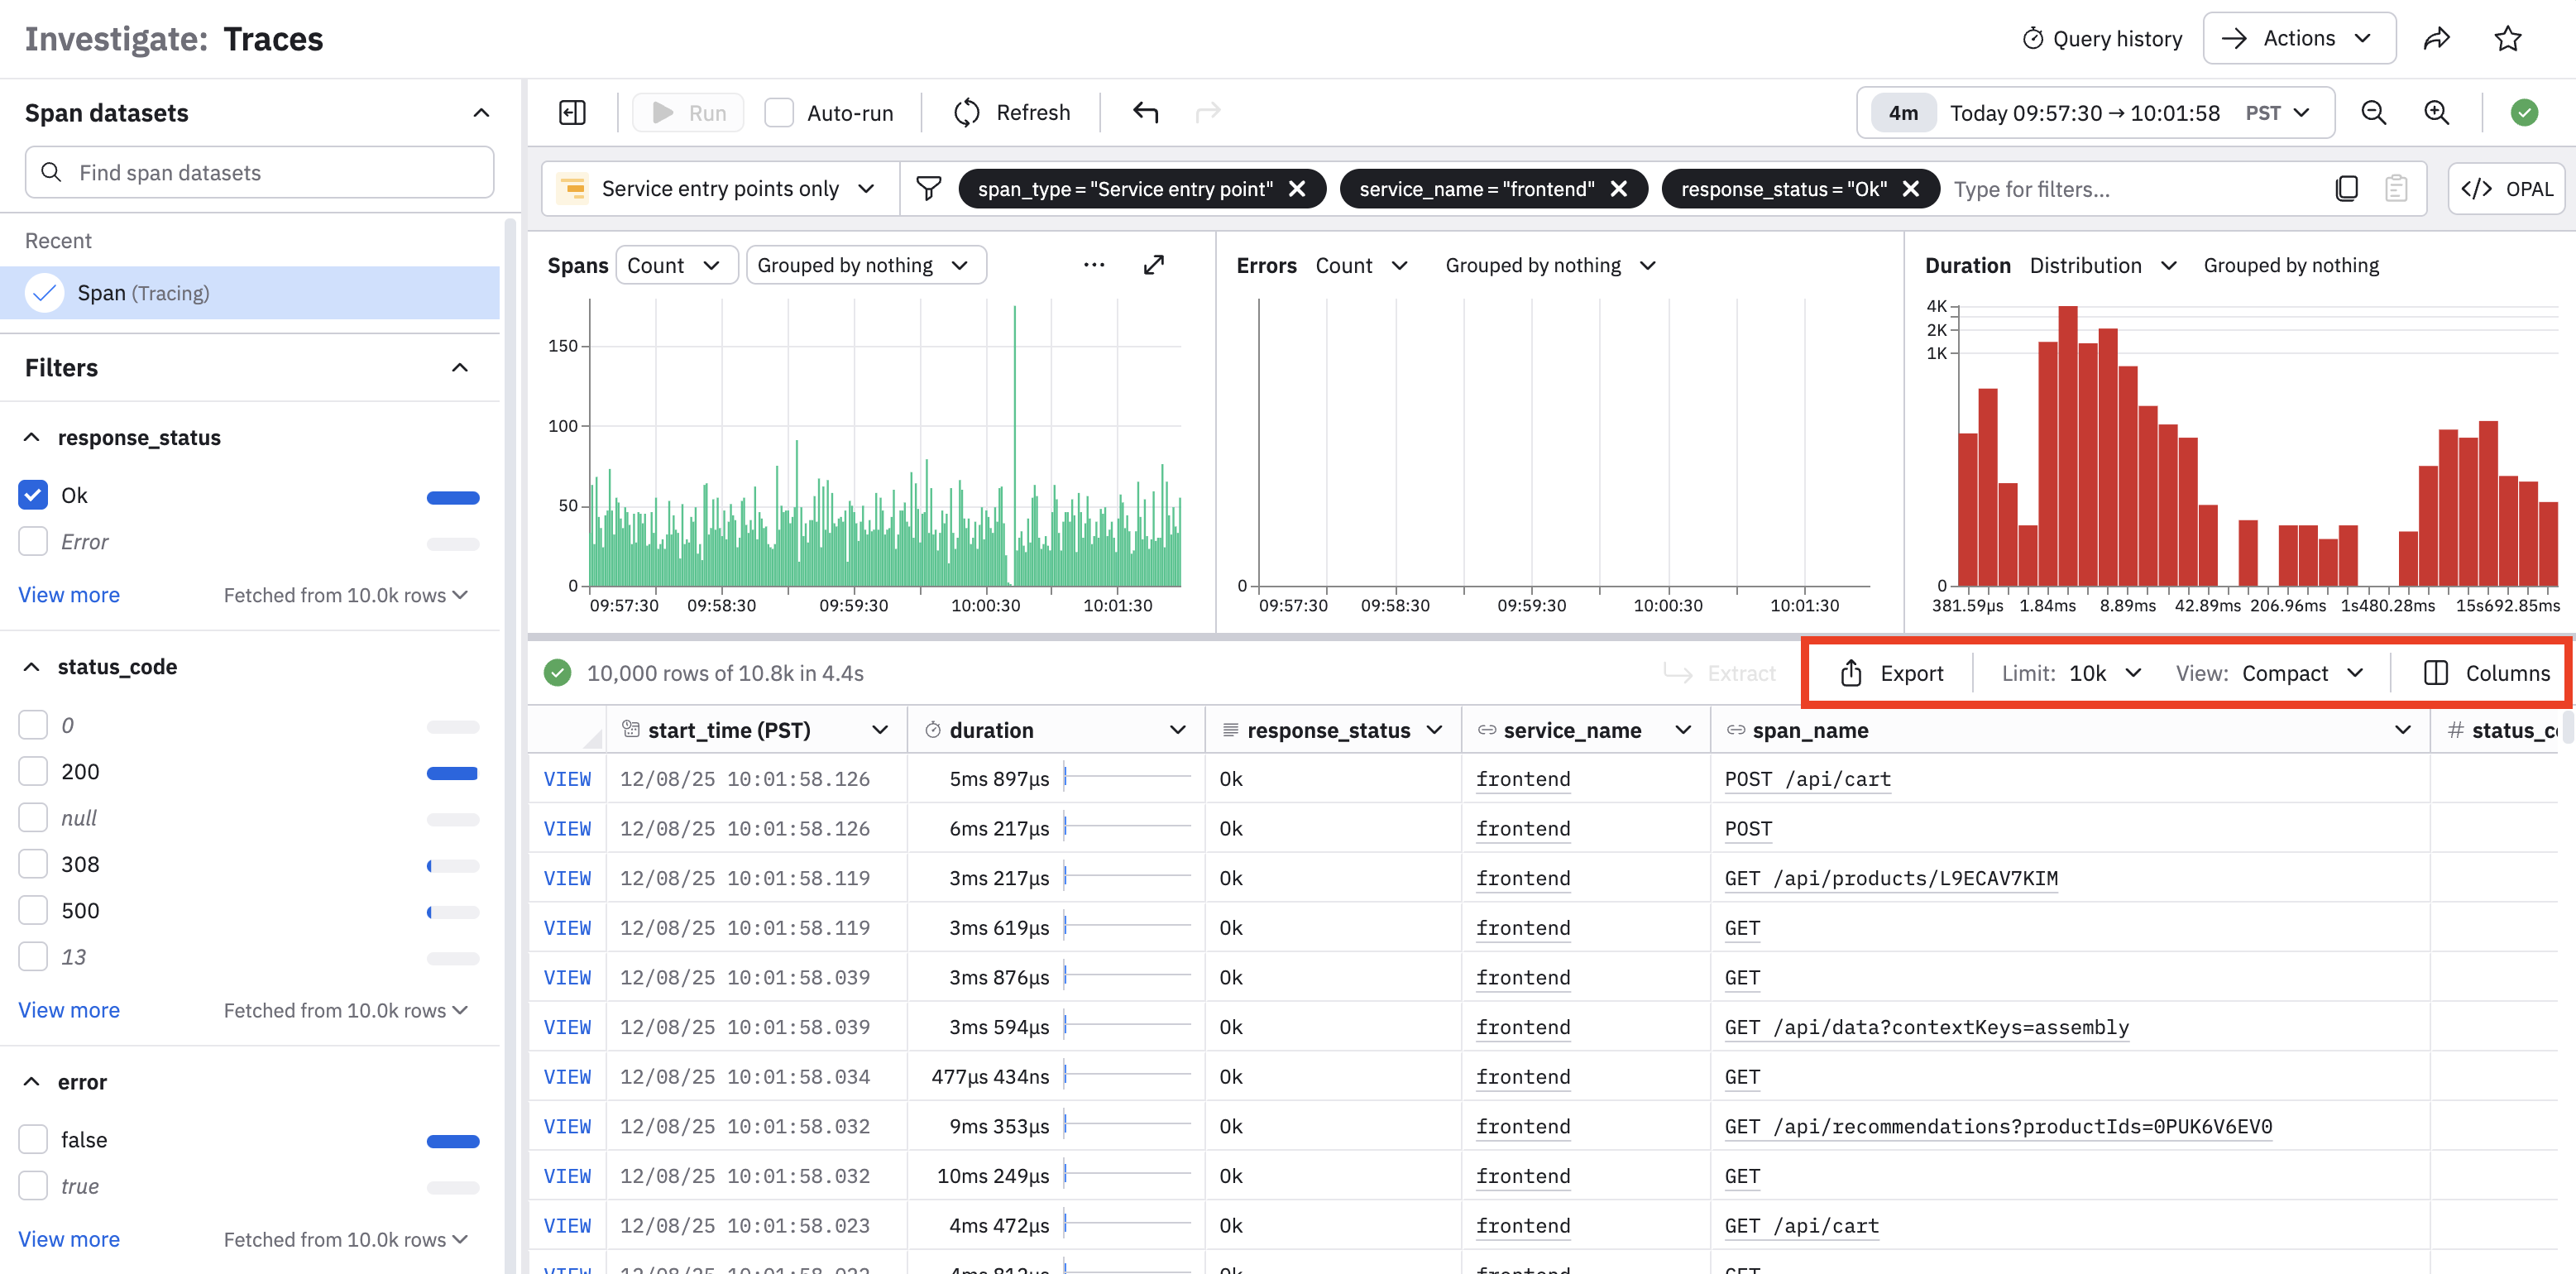
Use the query panel to filter what you see in the Trace Explorer. For example, we can view only frontend services. When you select a filter in the query panel, the query is automatically updated:
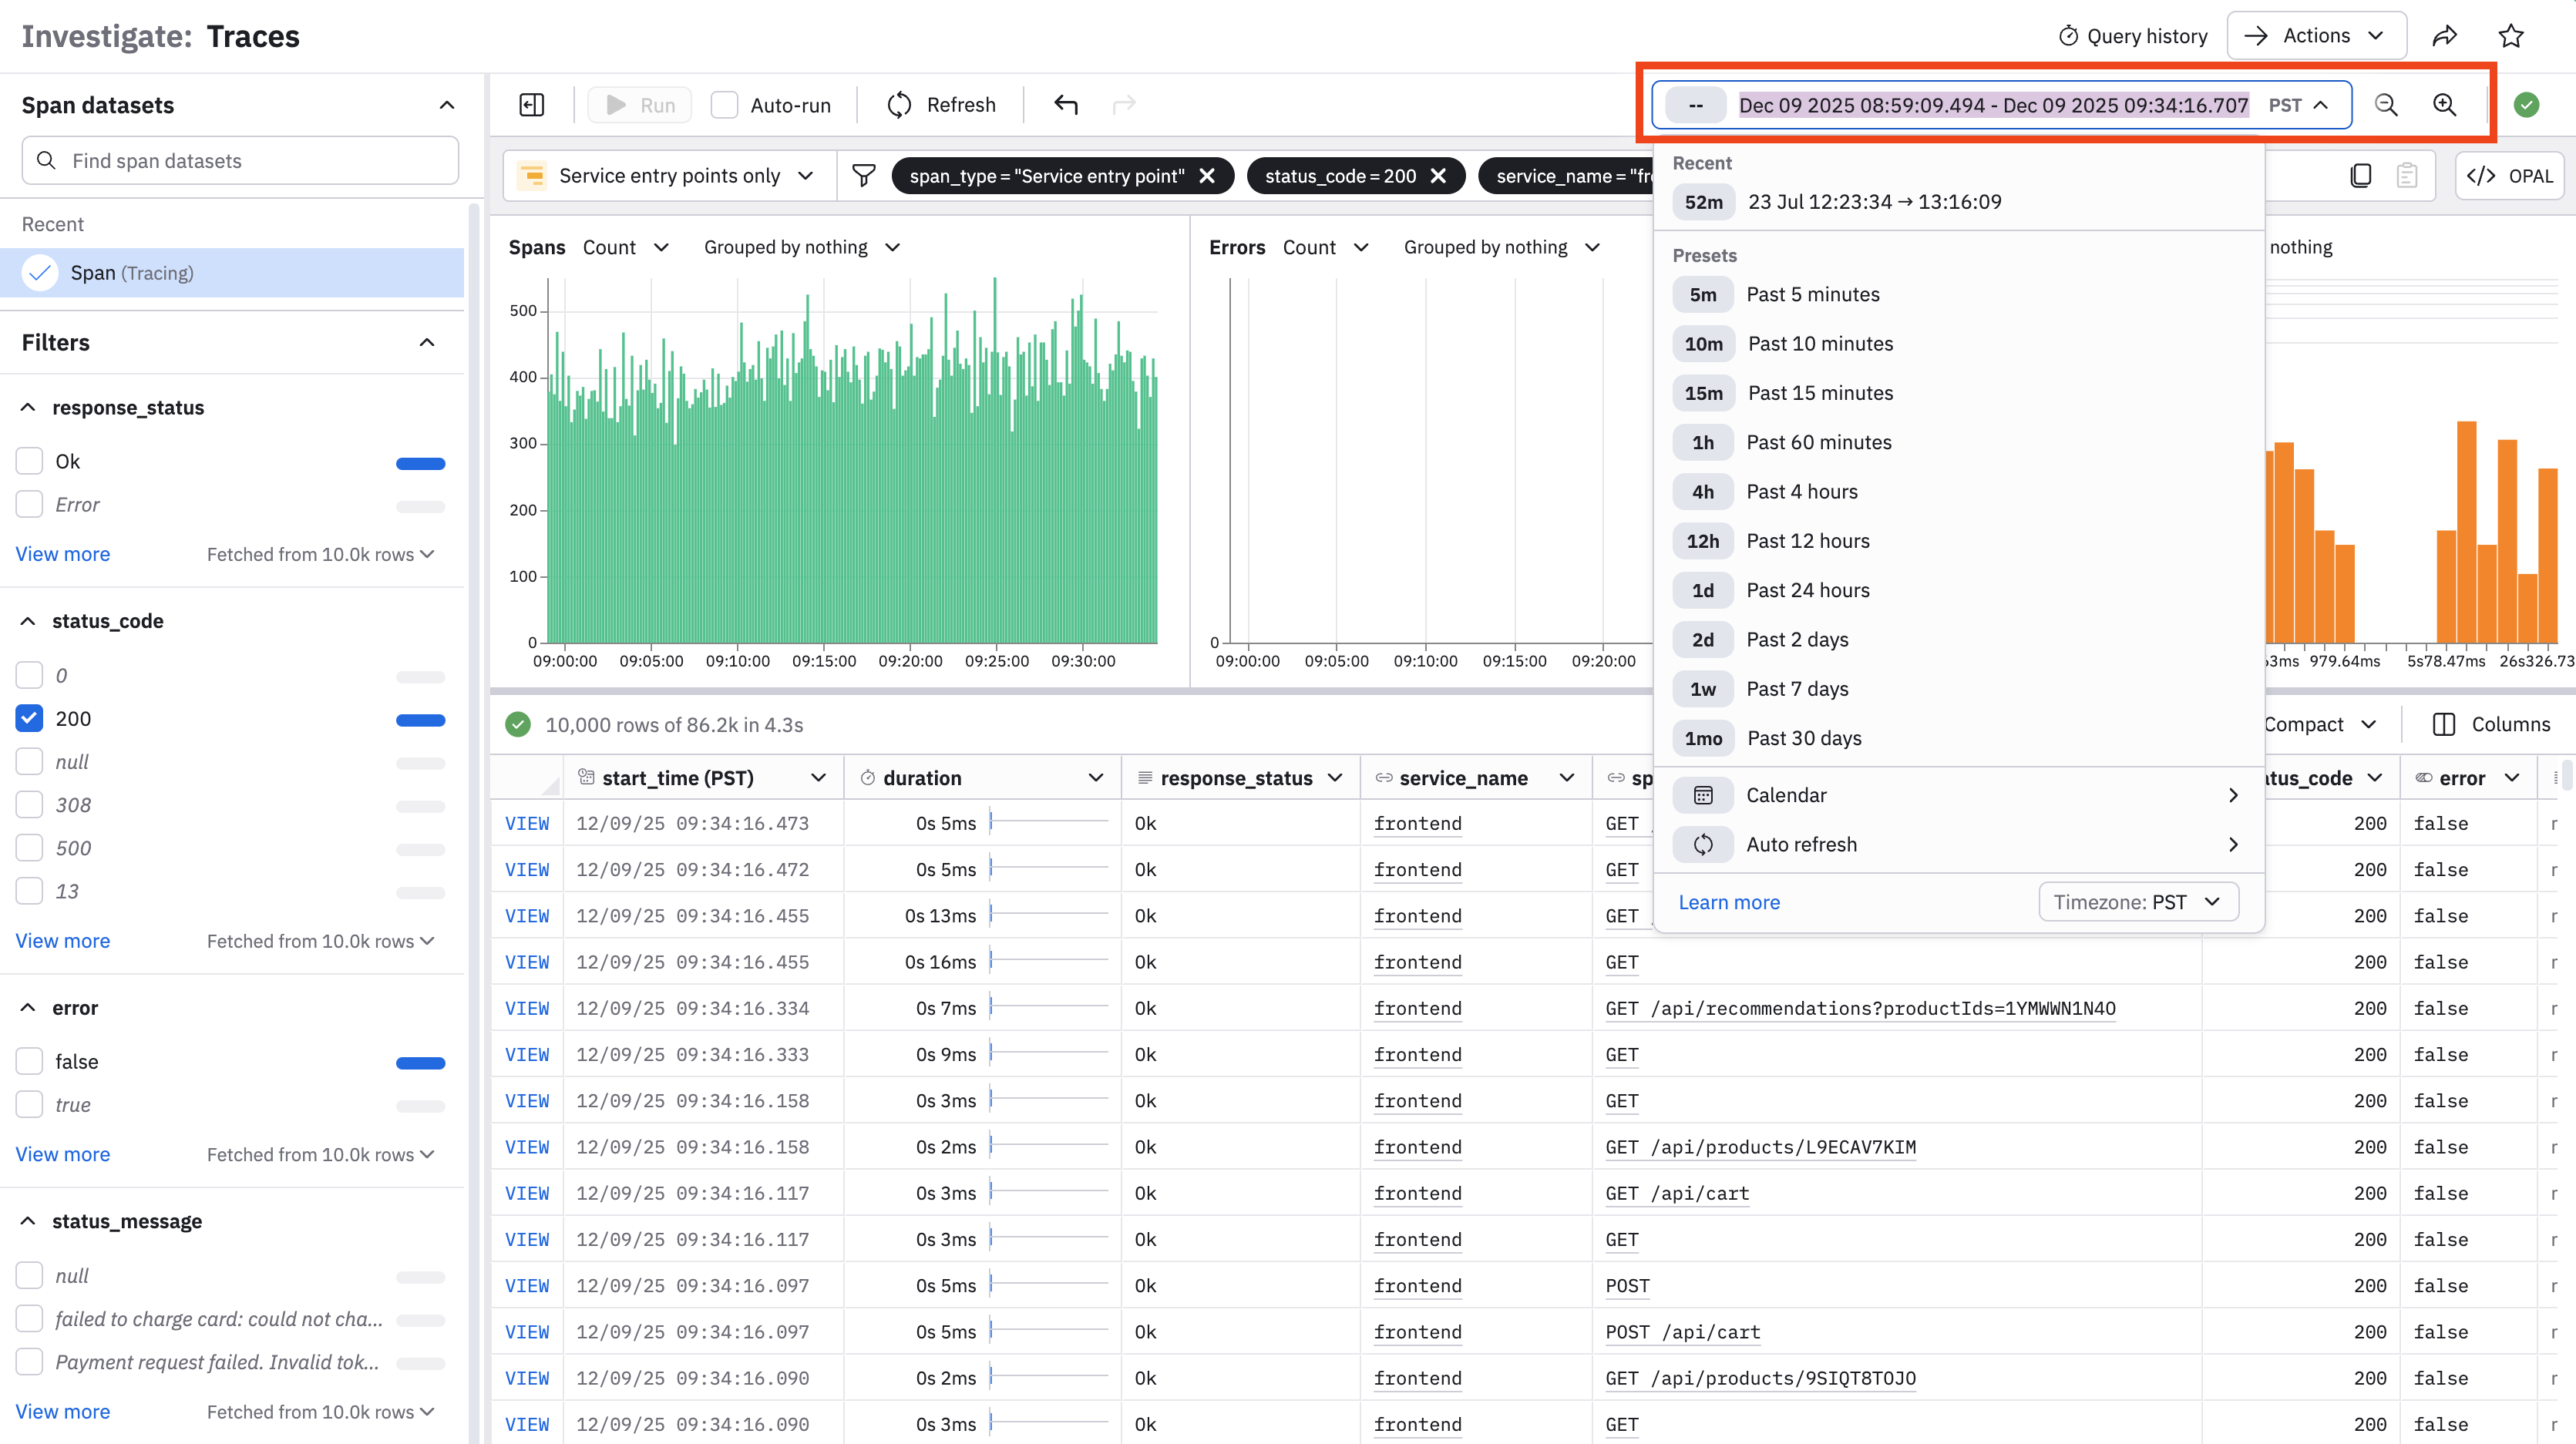
You can also adjust the time window for your query using the time-picker dropdown. Select any of the pre-populated options, or click Calendar to customize a specific time window.
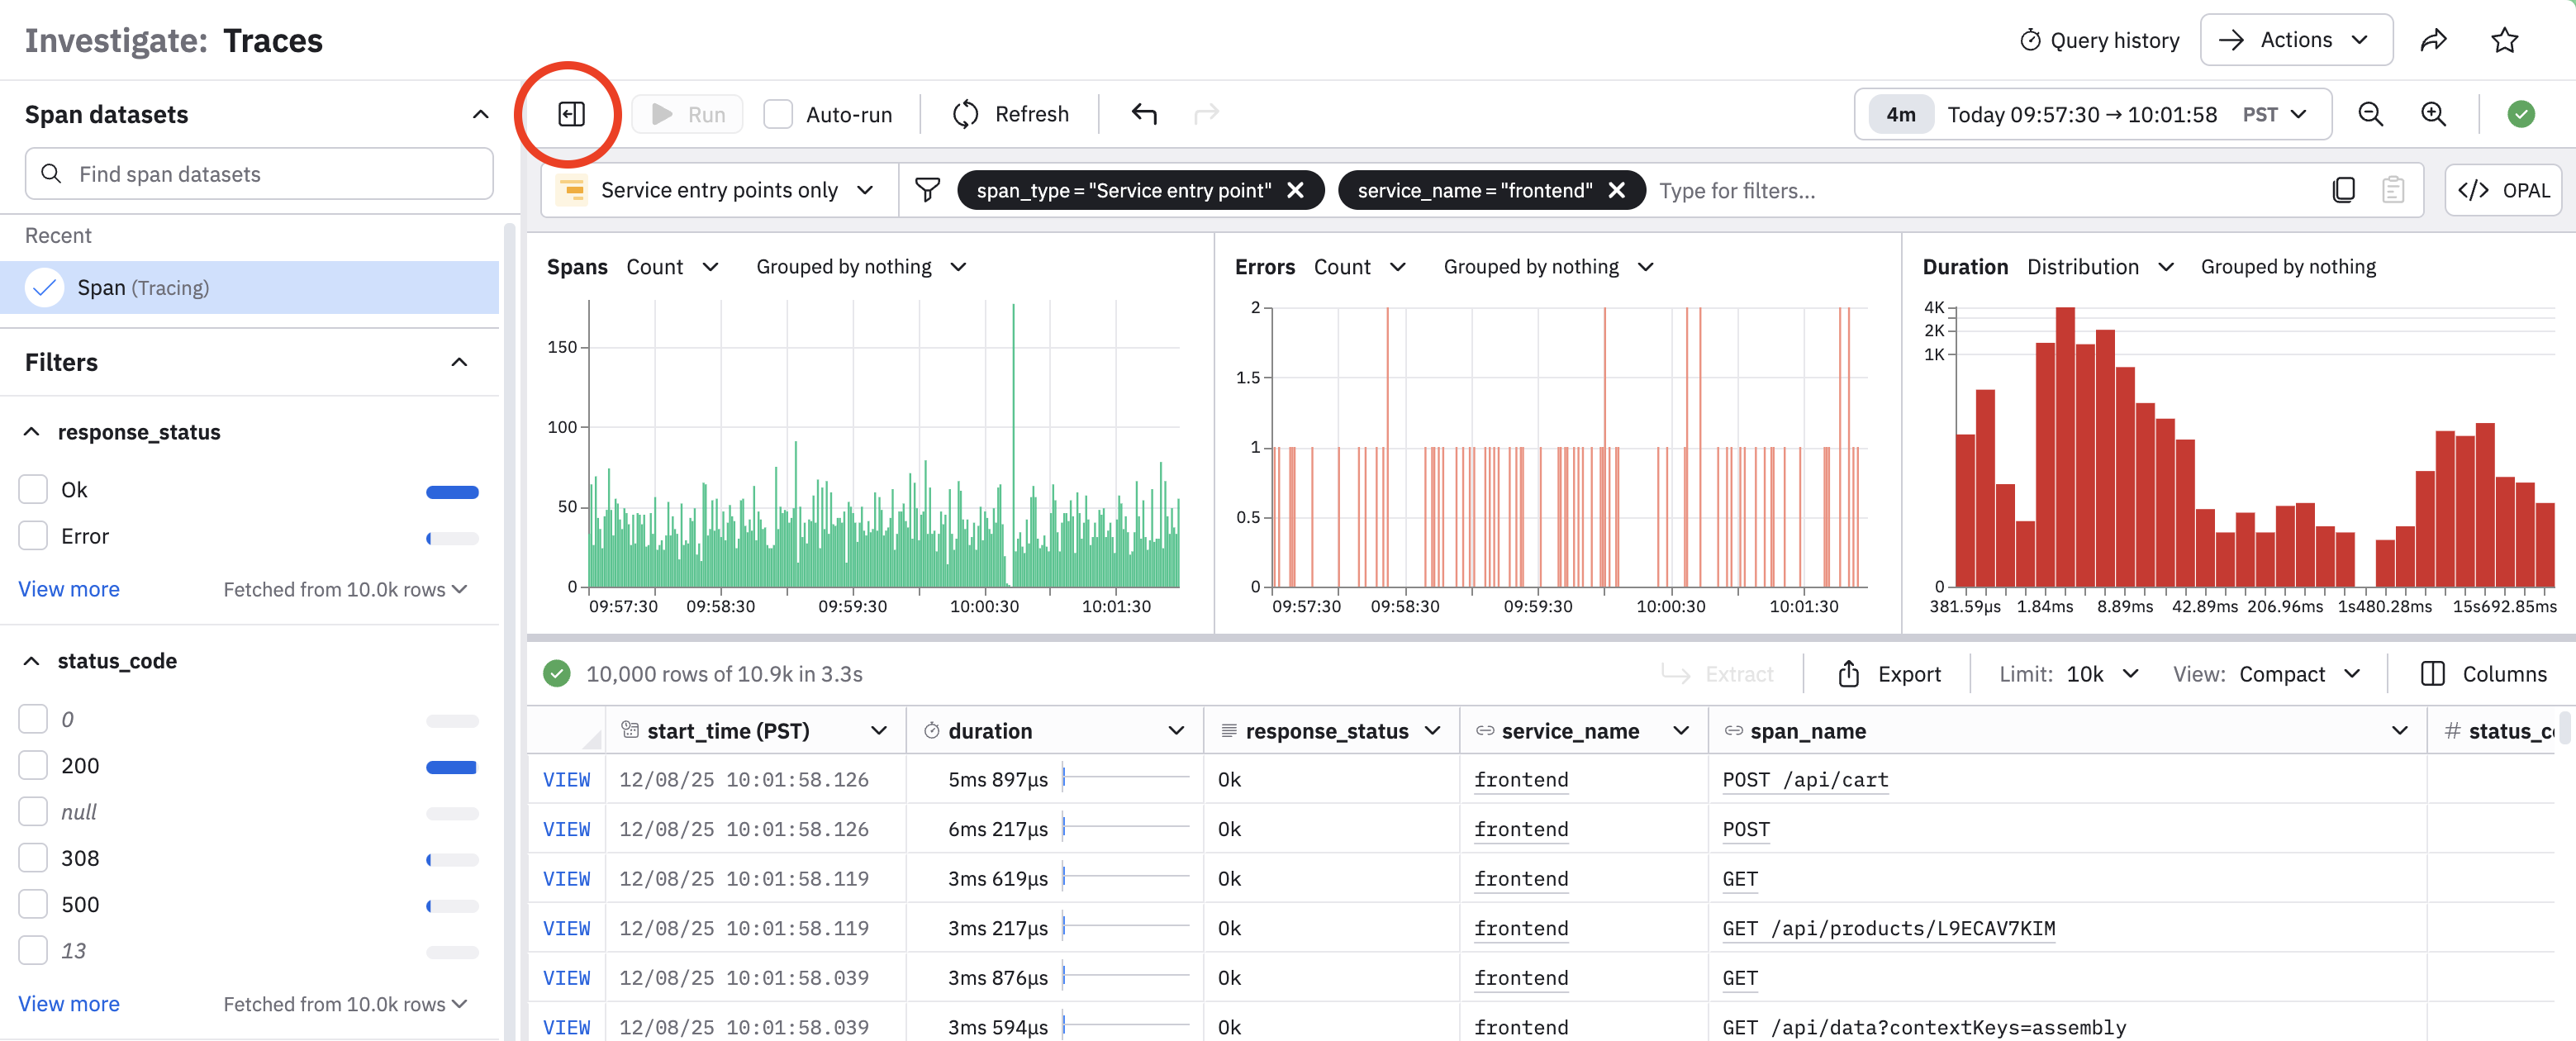
When you are done building your query, you can click toggle query panel icon () to dismiss the query panel.
Export data
To download the data displayed in Trace Explorer, click Export. You may select CSV or JSON format, and a maximum size limit (one thousand, ten thousand, or one hundred thousand rows). Note that hidden fields will be included. Use the pick_col OPAL verb to reduce the width of downloaded data.
Link directly to a trace
You may want to include direct links to specific traces from your alert payloads. To create a URL to a trace, use the following template:
https://<tenant_id>.observeinc.com/workspace/<workspace_id>/trace-inspector?traceId=<trace id>Traces accessed via direct link are fetched from the last 24 hours of data.
If you are using a Dataset other than the Span Dataset that is part of the OpenTelemetry app, you'll need to add the Dataset ID as a parameter:
https://<tenant_id>.observeinc.com/workspace/<workspace_id>/trace-inspector?spanDatasetId=<span dataset id>&traceId=<trace id>Examine trace details
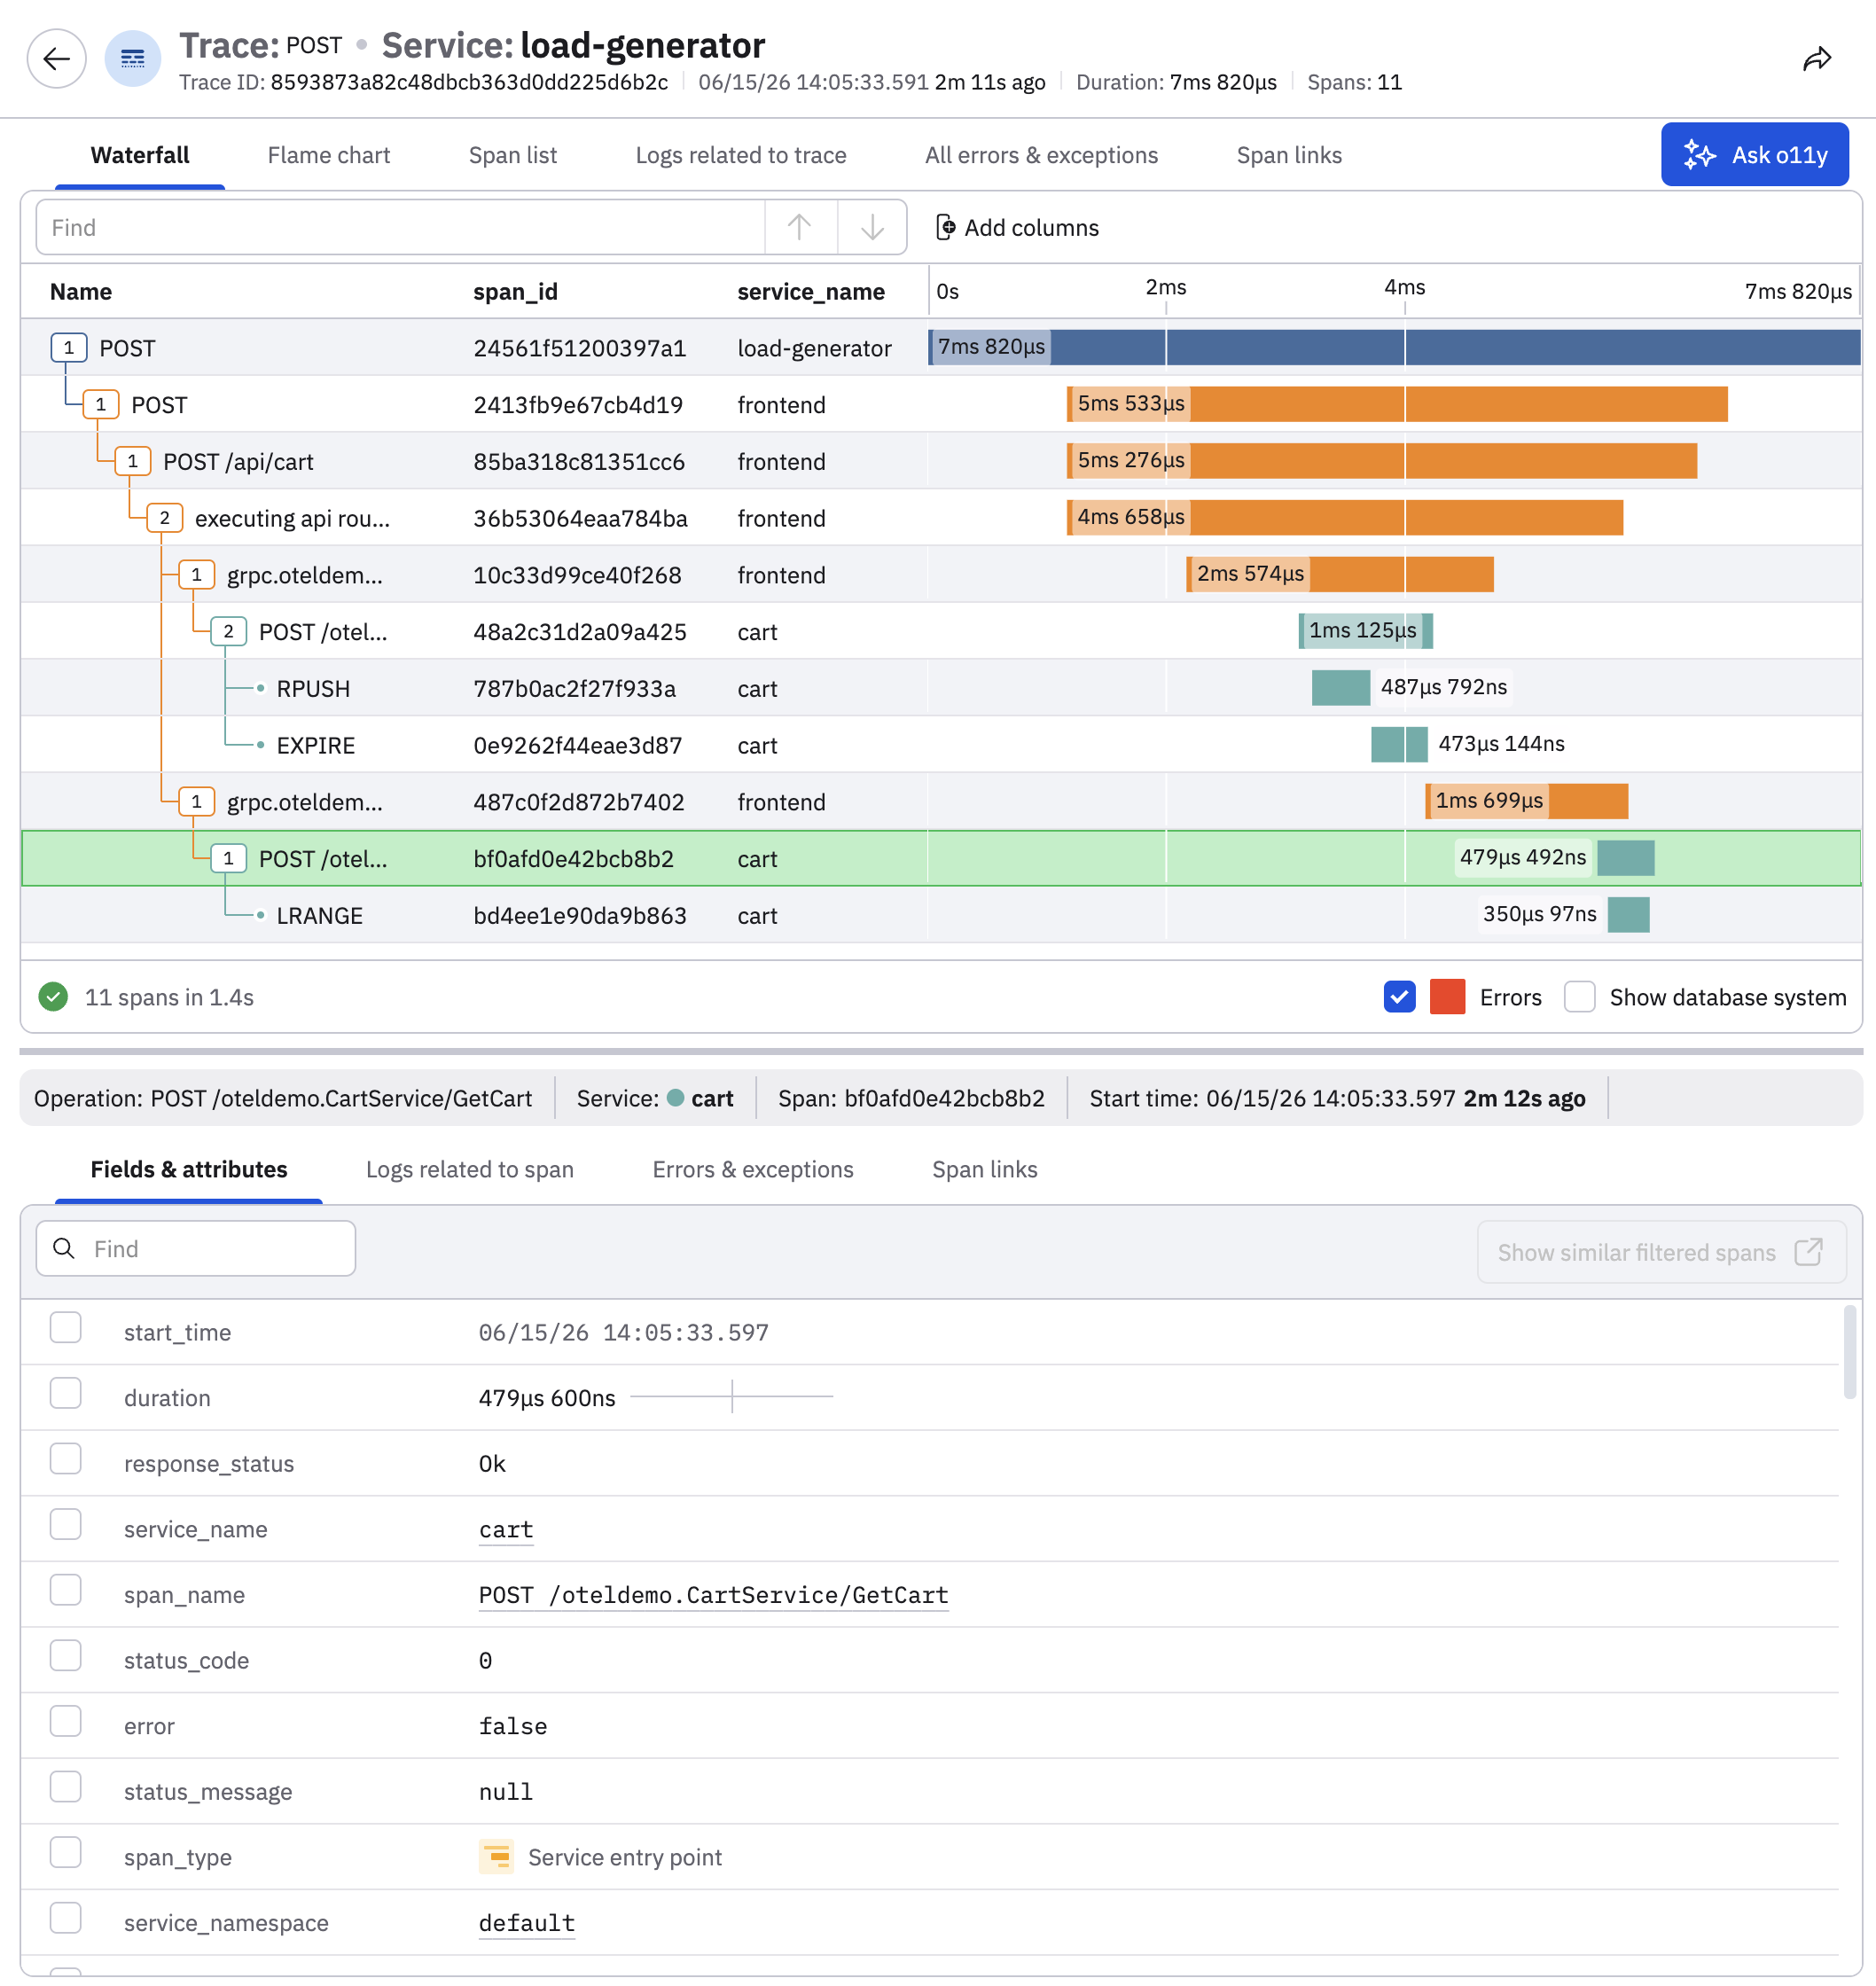
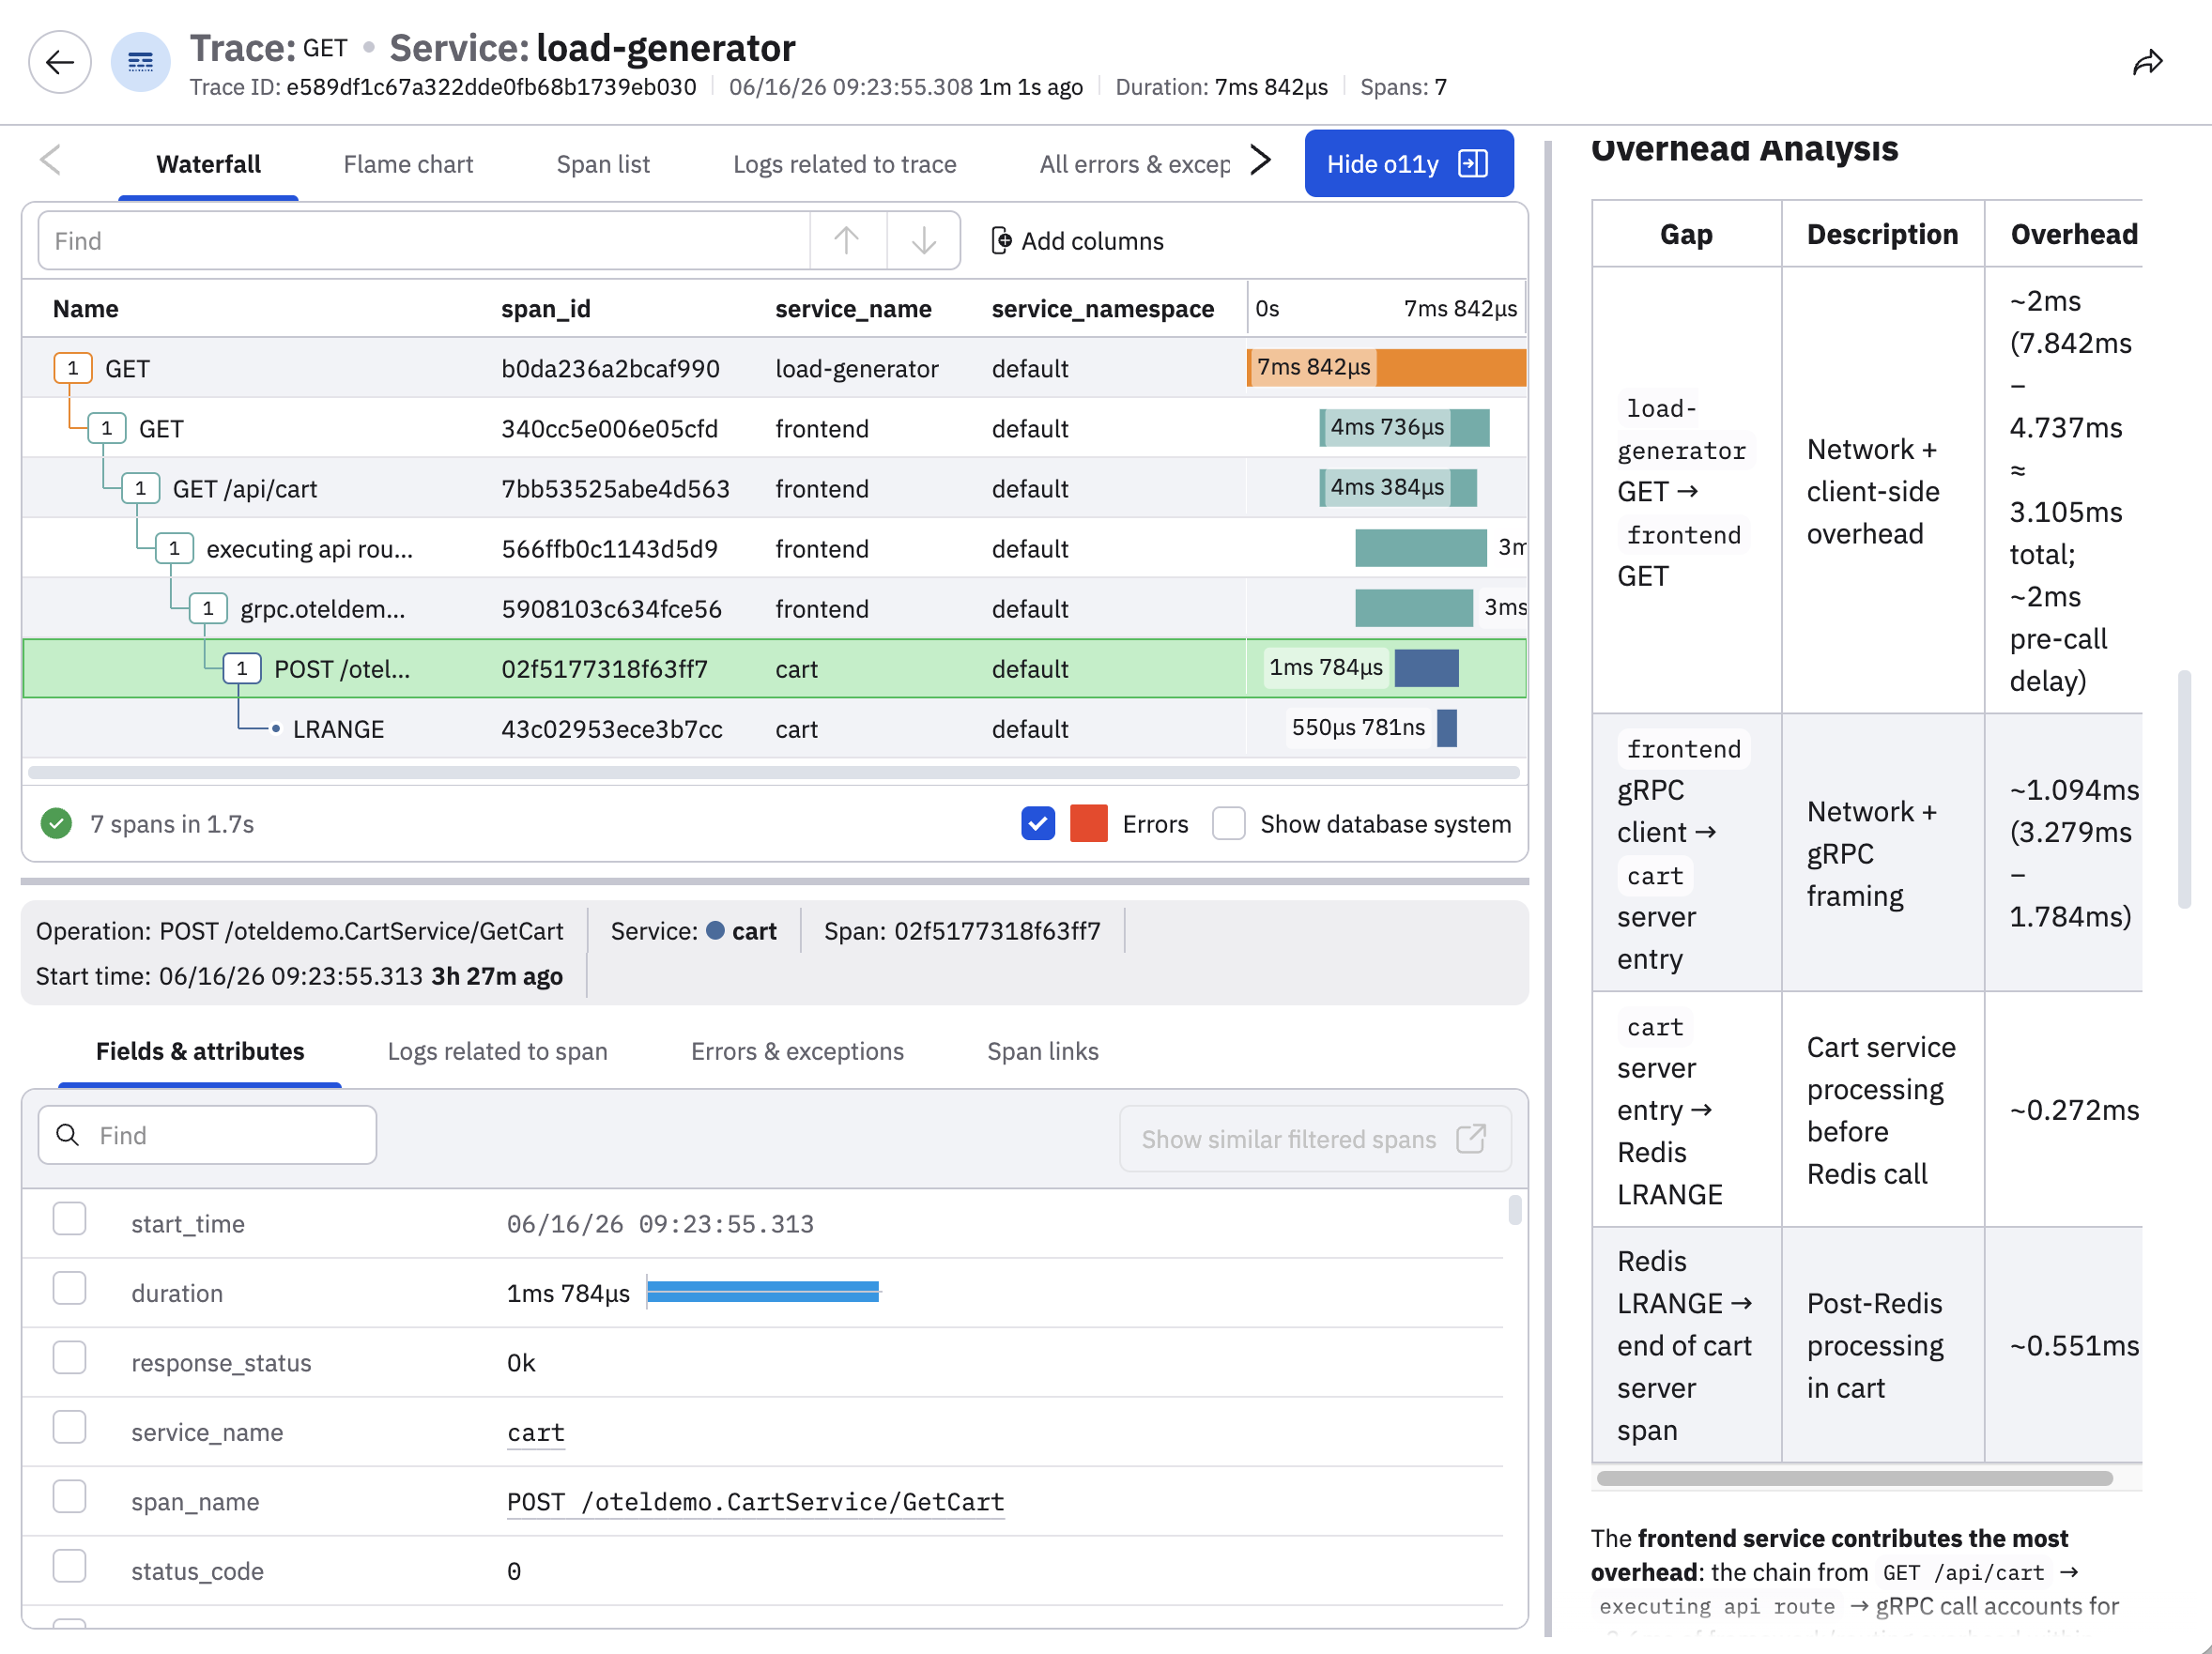
Click View for any trace in the Trace Explorer to view its details. By default, a waterfall visualization of the trace is presented:
Select any of the tabs to change the visualization:
| Column | Description |
|---|---|
| Waterfall | View a waterfall chart of the trace. See Waterfall charts. |
| Flame chart | View a flame chart of a specific span. |
| Span list | View a list of spans in the trace. |
| Logs related to trace | View a list of logs related to the trace. |
| All errors & exceptions | View all errors and exceptions for the entire trace. Errors come from the status_message field on the span data, and exceptions come from logs in the Span Event Dataset that have event_name="exception". |
| Span links | Span links allow you to correlate and link spans that might not be part of the same trace but could be related in some other ways. |
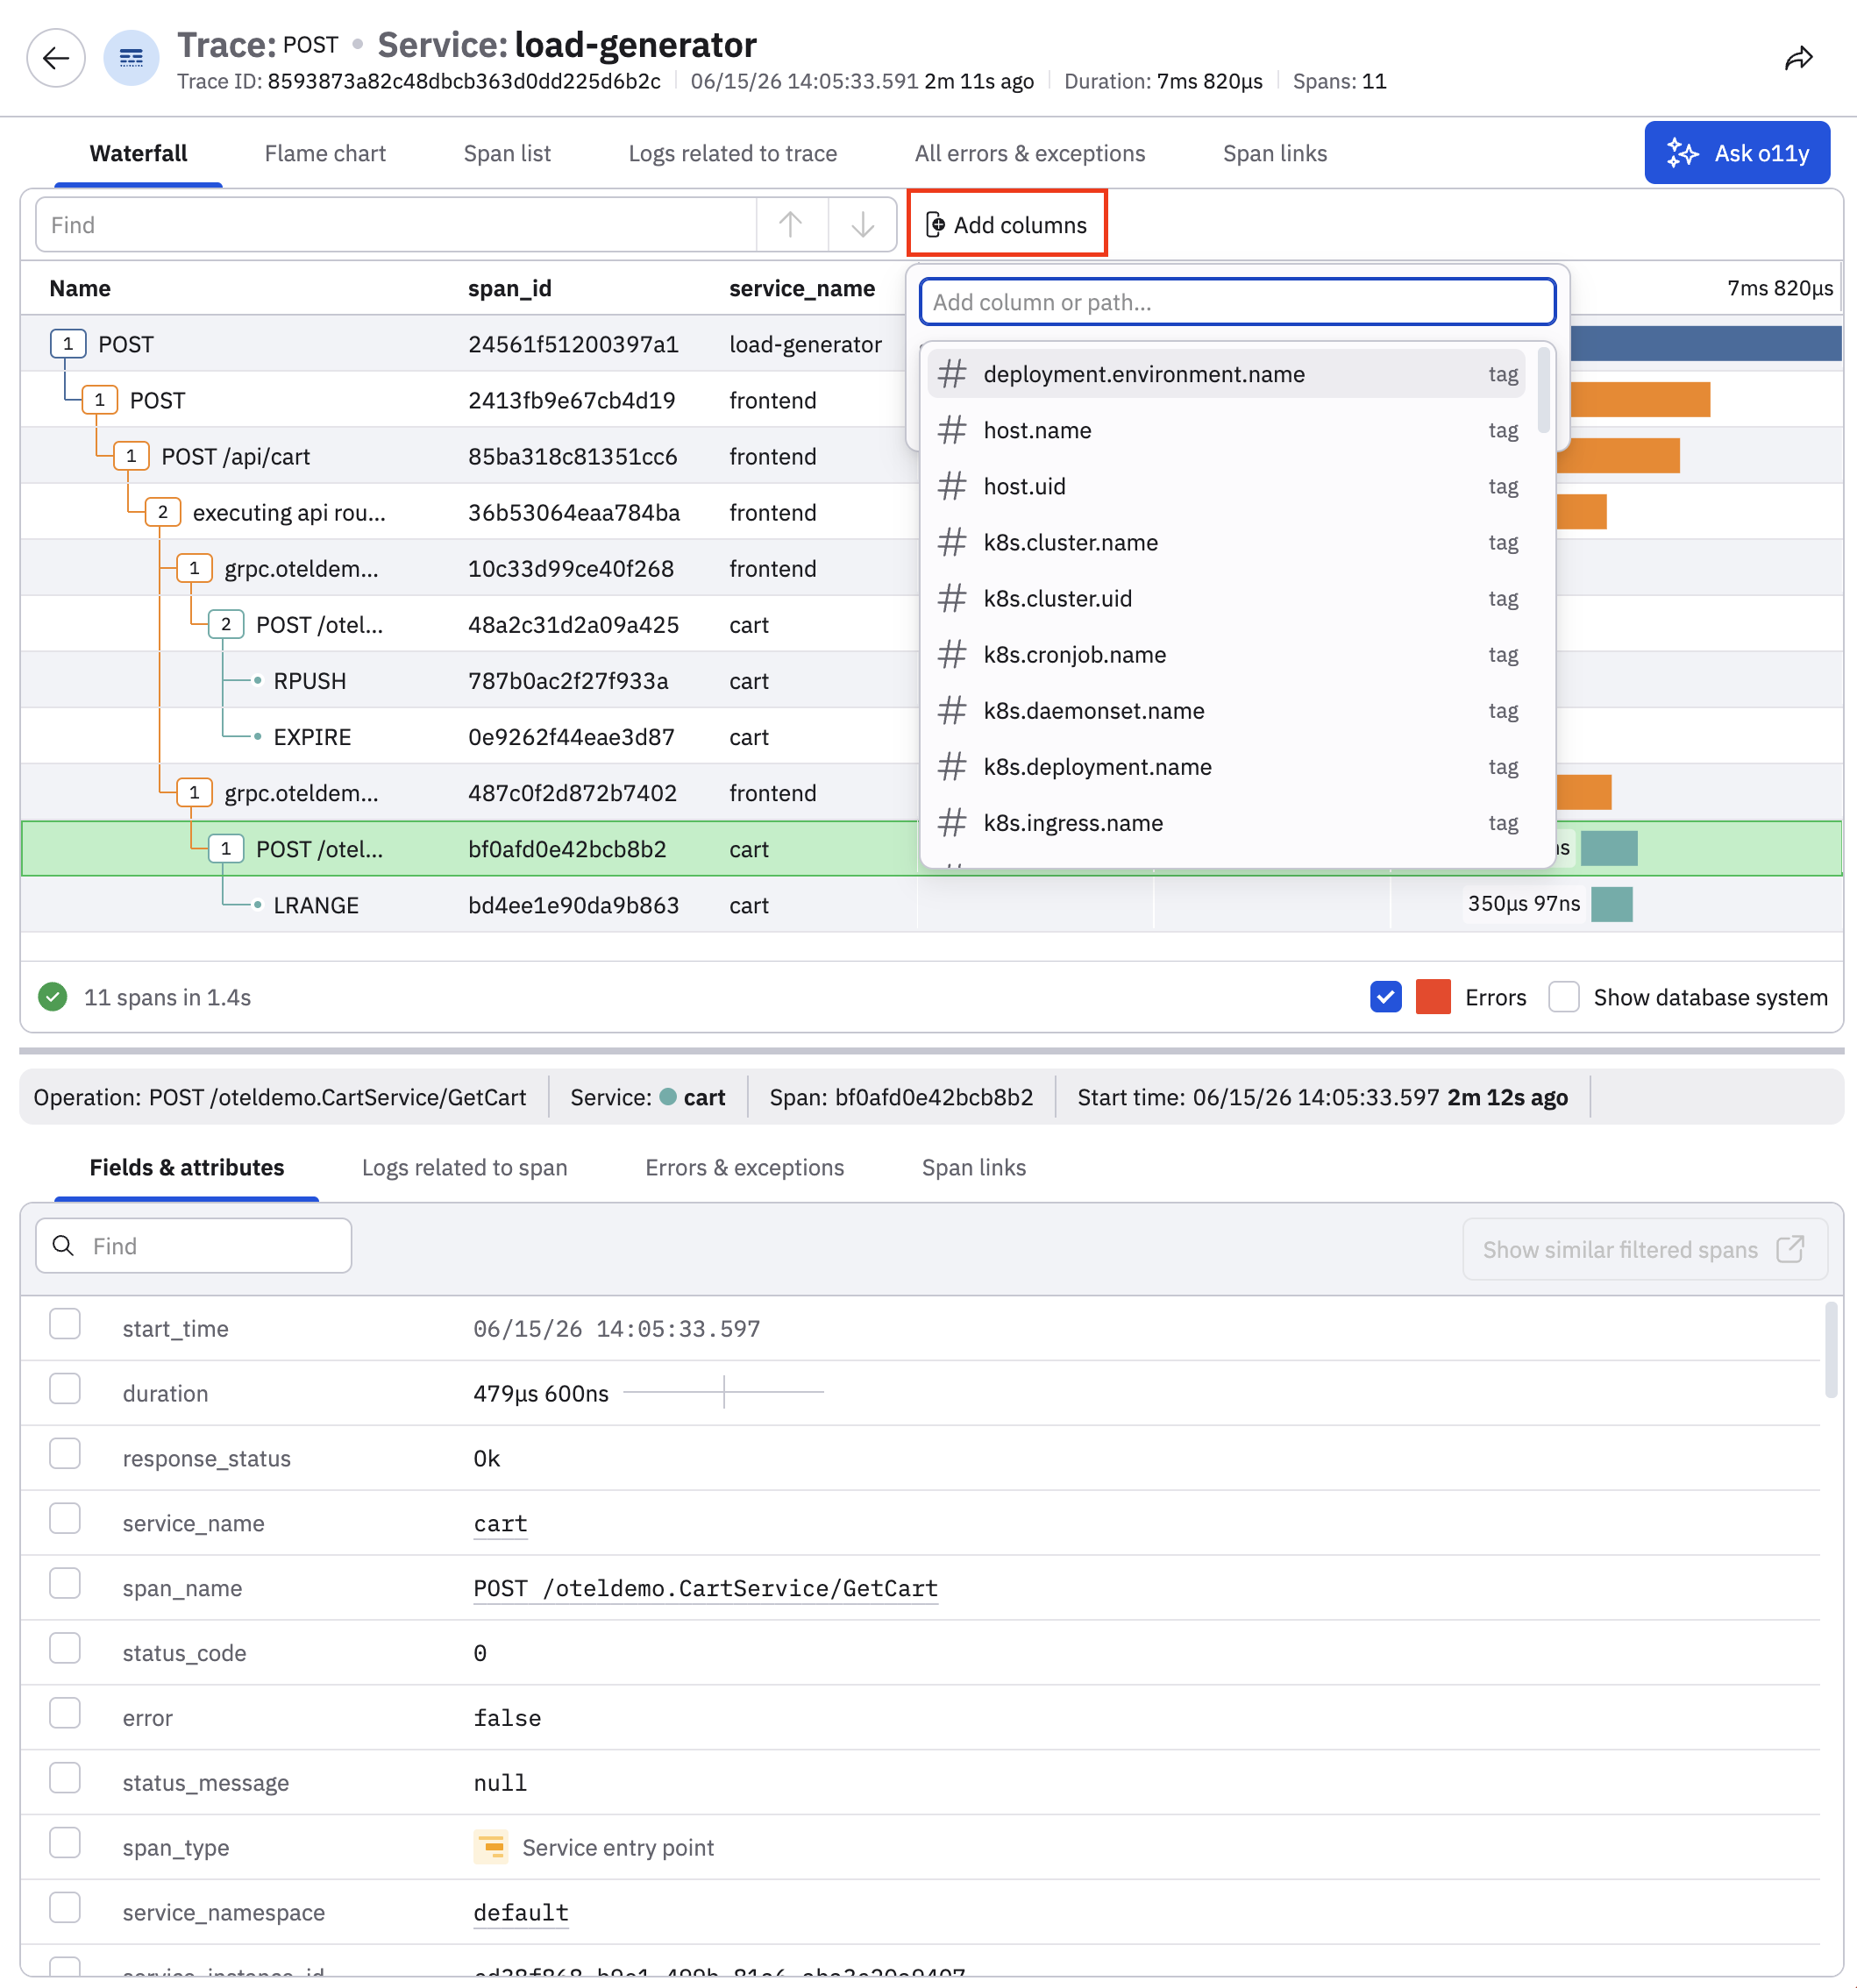
Click Add columns to add additional span attributes that are not in the default waterfall view, so that you can correlate attributes across spans without having to open multiple individual spans.
For example, you can add the service.namespace column to understand flows relative to broader business domains and organizations, or add server.address to identify when a call is going to an external service, like a third-party API.
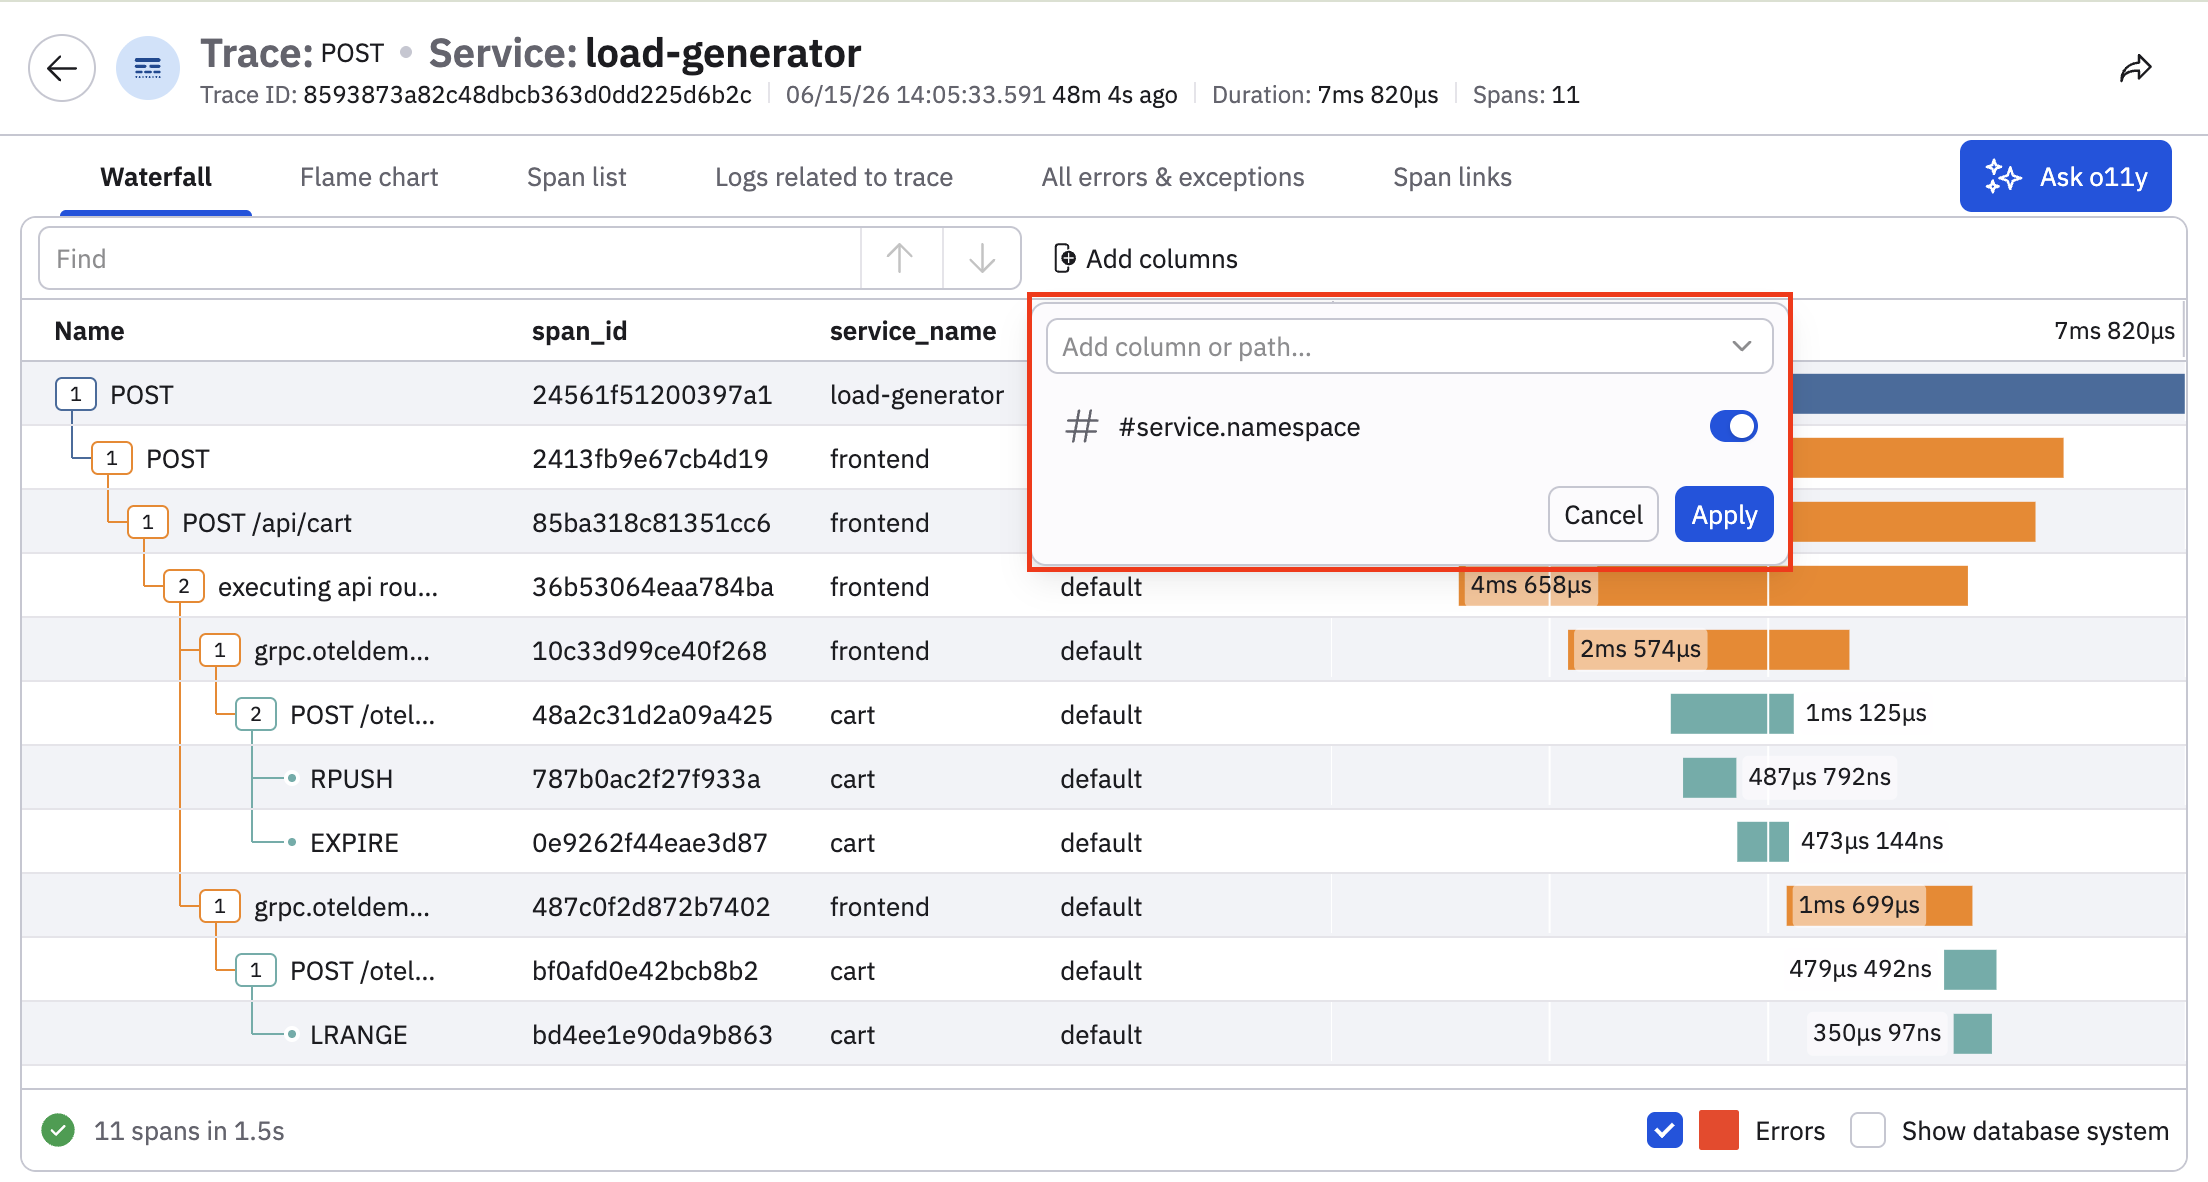
After you add additional columns, you can slide the attribute's toggle on or off to control its visibility in the chart, or delete the attribute so that it's no longer part of the chart:
Click Ask o11y to get an AI-generated summary of the trace, including some recommended actions:
Updated about 1 month ago