Usage attribution
Usage attribution helps you understand and allocate your Observe usage across teams, environments, and services. With this feature, you can answer questions such as:
- Which teams are responsible for the most log or metric volume?
- How much data does each environment or service contribute?
- Are there spikes in ingest tied to specific workloads?
Usage attribution means you no longer need to build internal custom solutions to achieve charge-back or show-back models. Such solutions often relied on naming conventions such as datastream token names, or manually built dashboards. Usage attribution brings this into the product natively, with support for standardized resource attributes like deployment.environment.name, service.name, and team.name.
See Auto-discovered attributes for a full list of auto-discovered attributes.
Limitations
The following limitations are known at this time:
- Any OpenTelemetry collector will work with usage attribution, but using the Observe Agent gives you the best results. Anything collected through the Observe Agent running on a host with the following configuration automatically adds the attributes below to its data.
resource_attributes: deployment.environment.name: prod service.name: recommendation team.name: ai - Attributes must be discoverable at ingest time, and part of the auto-discovered attributes.
- Filedrop and poller configurations are not supported at this time.
Where can I find usage attribution?
Access the Usage Attribution page using any of the following methods:
- In the left navigation rail, select Data & integrations > Usage attribution.
- In the left navigation rail, hover on your user name, then select Manage account, then click Usage attribution.
- Use to the following URL, replacing
${observe_tenant}with your observe tenant ID:
https://${observe_tenant}.observeinc.com/settings/usage-attributionHow do I turn on usage attribution?
You will need to select the attributes you are interested in tracking. In the top right, there will be a Manage tags button. Opening it will reveal a dropdown, where you can select up to three attributes. You will need admin permissions to do this.
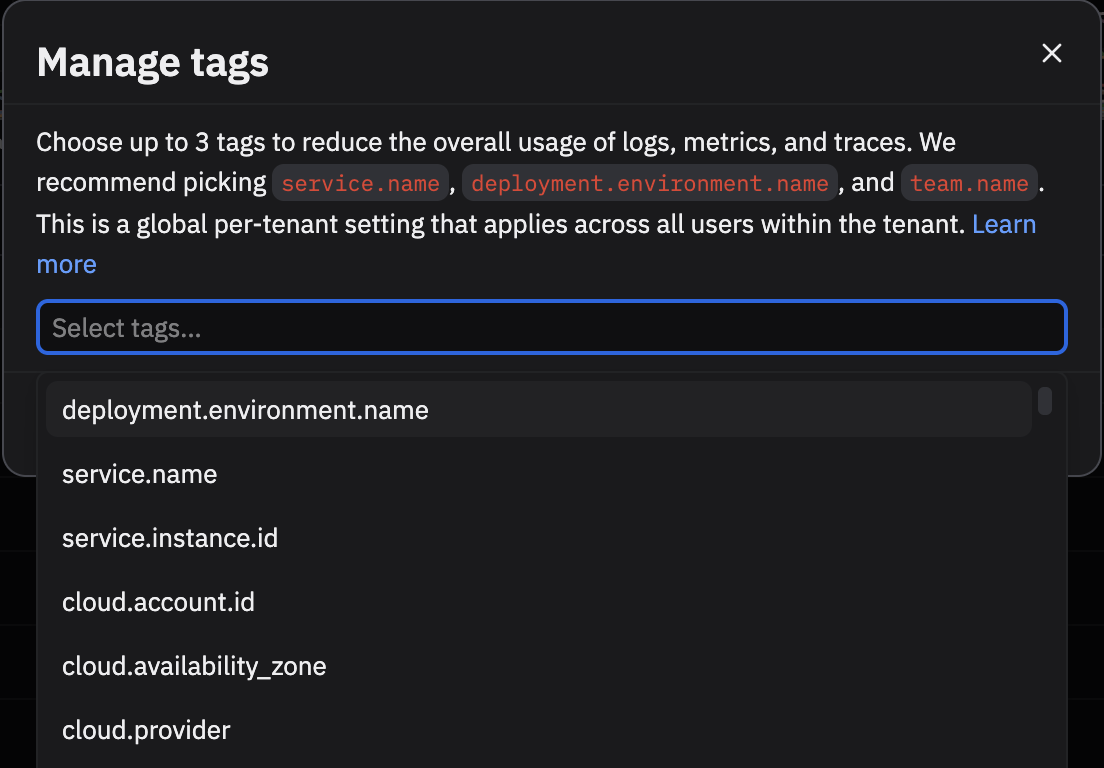
This is a global setting which is shared across the tenant. After clicking save, we will start collecting usage data on those attributes. It will take a couple minutes to reflect on the main dashboard. This will work for data collected from your own datastreams or the Add Data portal.
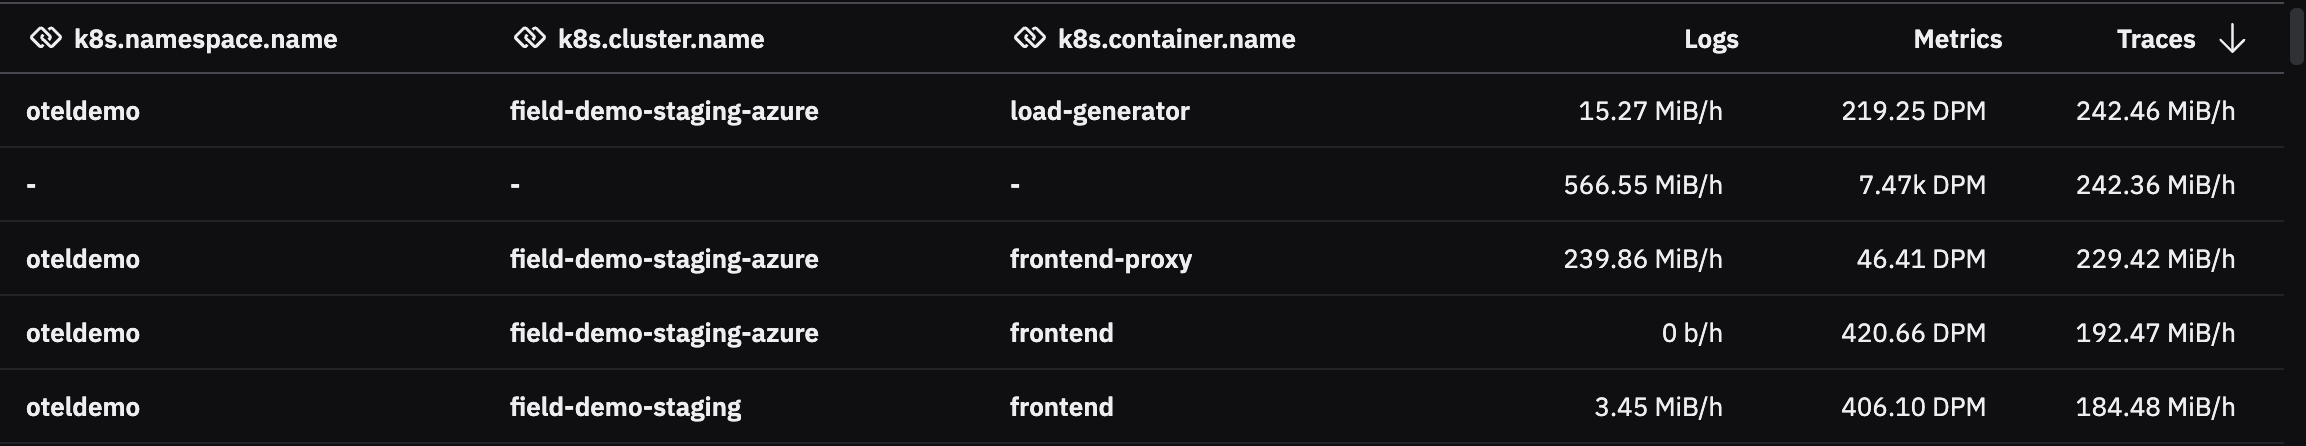
For example, if you selected service.name above, we would track usage by service. Data containing fields like FIELDS."service.name" or FIELDS."resource"."attributes"."service.name" would be included, as we search nested fields up to a certain depth. Any data without that attribute will be given the empty tag, -.
Your end result should look like the below, but with many more rows.
Recommended approach
Use the Add Data for Kubernetes and Add Data for Host (Linux, Windows, and macOS) flows with the Observe Agent. These automatically set default annotations and collect them as resource attributes. You can then slice and dice your usage by:
deployment.environment.nameservice.nameteam.name
This approach is simpler and more reliable than building ad-hoc models based on token names or dashboards.
Add team.name in Kubernetes
team.name in KubernetesAdditional configuration for team attribution is required because this concept doesn't exist in Kubernetes or Linux. You can add a team.name annotation to any Kubernetes workload. For example, if the recommendation Deployment is owned by the ai team:
- Patch the Deployment’s pod template (so new pods get the annotation):
  kubectl -n default patch deployment recommendation \\
  --type='merge' \\
  -p '{"spec":{"template":{"metadata":{"annotations":{"resource.opentelemetry.io/team.name":"ai"}}}}}'
apiVersion: apps/v1
kind: Deployment
metadata:
name: recommendation
namespace: default
spec:
template:
metadata:
annotations:
resource.opentelemetry.io/team.name: ai- Roll the Deployment so pods pick it up:
kubectl -n default rollout restart deployment recommendation
kubectl -n default rollout status deployment recommendation- Verify the annotation on a new pod:
# List the new pod(s)
kubectl -n default get pods

# Check the annotation
kubectl -n default get pod <pod-name> -o yaml | grep 'resource.opentelemetry.io/team.name'
After applying this change, the attribute is available in Observe, allowing you to break down usage by team.
Updated 7 months ago