

Mustache template reference
Observe by Snowflake Monitors allow for extensive customization via the use of the Mustache specification. In addition to supporting the standard behaviors, we also support some additional Observe by Snowflake-specific extensions.
This document describes those extensions, for the notification actions supported by Observe by Snowflake: email, webhook, Slack, and PagerDuty.
Extensions to the Mustache spec
Besides the base behavior given in the Mustache specification, the Observe by Snowflake provides extensions such as custom functions, array indexing, quoted keys in paths, fragments, and iteration helpers.
Custom function support
Observe by Snowflake added the ability to treat sections of rendered template as mutable by a function. A specific use case is to apply formatting or encoding to a single section of a template, but not the whole template. The real power is passing rendered sub-elements to the function as they may not be properly formatted for their context. The syntax is like:
{{~customize}}
This text will be {{presented}} for mutation by the `customize` function.
{{#subsection}}
This text will also be {{.}} mutated.
{{/subsection}}
{{/customize}}
Custom functions can also accept values in quoted form. For example:
{{~customize key="value"}}...{{/customize}}The following custom functions are available for monitoring:
{{~urlpathescape}}
Used in the path part of a url to ensure it is encoded properly.
{{~urlqueryescape}}
Used in the query parameters of a url to ensure it is encoded properly.
{{~truncate}}
Used to truncate long values. You must provide a limit. Captured {{value}} strings are truncated to 2048 bytes for Slack, 50,000 bytes for other action types, with the ellipsis suffix. See {{alert.values}} section.
Example:
{{~truncate limit="100" ellipsis="..."}} long text here{{/truncate}}{{~formatTime}}
Formats a timestamp using OPAL format_time specifiers.
- Required:
format, such asYYYY-MM-DD, HH24:MI, TZ, FF3 - Optional:
timezone— IANA name only. If notimezoneis specified, UTC is used.EST-style abbreviations are rejected. - Body: RFC3339, unix seconds, or unix nanoseconds ({{alert.start.rfc3339}}, {{alert.start.epochNanos}}). Empty body results in empty output.
Example, using Eastern time zone in an email subject:
{{alert.severity.level}} {{monitor.name}} at {{~formatTime format="HH24:MI TZ, MON DD" timezone="America/New_York"}}{{alert.start.rfc3339}}{{/formatTime}}{{~adjustTime}}
Shift a timestamp by a calendar expression, then optionally format it.
- Required:
by="+N unit", whereN unitcan beyear,month,day,hour,minute, orsecond; singular or plural. This field is calendar-aware, so May 31 + 1 month → June 30. - Optional:
format(same as formatTime),timezone(IANA). Without format, emits RFC3339 (nestable into formatTime).
Example:
{{~adjustTime by="+1 day" format="YYYY-MM-DD" timezone="UTC"}}{{alert.start.rfc3339}}{{/adjustTime}}Unescaped output
Mustache supports a triple-brace variant that renders content without HTML escaping:
| Syntax | Behavior |
|---|---|
{{ alert.url }} | May HTML-escape the value (for example & → &) when rendered. |
{{{ alert.url }}} | Renders the value raw, with no HTML entity encoding. |
Use {{{…}}} for URLs in the webhook URL field and other places where the rendered value must be a literal URL string:
https://example.com/alerts?id={{{alert.id}}}For URLs embedded in HTML email href attributes, double braces usually work because & is valid HTML. For webhook JSON bodies, double braces are usually sufficient because those templates use JSON escaping, not HTML escaping.
URL fields where triple braces are commonly useful:
- {{{alert.url}}}, {{{alert.dataUrl}}}, {{{alert.apmUrl}}}
- {{{alert.resources.url}}}, {{{alert.resources.explorerUrl}}}
- {{{monitor.url}}}, {{{dataset.url}}}
Iteration
A mustache section is rendered N times when the referenced field is an array of values. When the field is an array, a few additional fields will be added to the element to aid in iteration. These can be especially helpful if you are rendering things like JSON templates where "danging/trailing commas" are not permitted.
For example, to render a JSON array of the names in the captured values of an alert. Using the isFirst check, an array item can be prepended with a ", " for all but the first item in the array.
{{#alert.values}}
[{{^isFirst}}, {{/isFirst}}{{name}}]
{{/alert.values}}
Array indexing
When a section is an array, each item in the array is invoked to render the section. However, you can target a specific index using an integer identifier.
{{#array.1}}The item at index 1 is {{.}}{{//array.1}}Quoted keys in paths
Observe by Snowflake's Mustache implementation supports quoted key segments in dotted paths. By default, every . is a path separator, so {{ alert.valuesByTag.service.name.value }} walks service → name, not the single key service.name.
Wrap a segment in double or single quotes so interior dots are literal:
{{ alert.valuesByTag."service.name".value }}
{{ alert.valuesByTag.'deployment.environment.name'.value }}
Both quote styles are equivalent, so you can use whichever avoids escaping inside the tag name.
This is the correct way to address a dotted correlation tag name in {{alert.valuesByTag}} and anywhere else a map key contains a dot character (.).
Escape inside quoted keys
Inside a quoted segment, only the following escapes are recognized:
| Escape sequence | Description |
|---|---|
\\ | Literal backslash character |
\" | Escape inside a double quoted segment |
\' | Escape inside a single quoted segment |
You don't need to escape dots inside quotes. Any other backslash escape is a parse error.
Empty keys are valid. For example: {{ obj."" }} and {{ obj.'' }}.
Parse-time rules and gotchas
Malformed quoted paths fail at template parse time when the Monitor action is saved or previewed, not silently at send time:
| Rule | Detail |
|---|---|
| Section open/close must match exactly | {{#alert.valuesByTag."service.name"}}…{{/alert.valuesByTag."service.name"}}Same quotes on both tags. Mixing "…" on open and '…' on close is a missing closing tag error. |
| No trailing junk after a closing quote | {{ alert."key".field }} is valid; extra characters immediately after "key" before the next . or }} are a parse error. |
| Closing delimiter cannot appear inside the key | With default }} delimiters, a literal }} inside a quoted key truncates the tag and yields an unterminated quote error. |
| Unterminated quotes | A segment that opens " or ' without a matching close is a parse error. |
Quoted keys work in variables, sections, and inverted sections. For example:
{{ alert.valuesByTag."service.name".value }}

{{#alert.valuesByTag."k8s.namespace"}}
namespace={{value}}
{{/alert.valuesByTag."k8s.namespace"}}

{{^alert.valuesByTag."k8s.namespace"}}no-namespace{{/alert.valuesByTag."k8s.namespace"}}
Alternative for correlation tags: iterate {{#alert.tags}} when you need every tag or prefer not to quote — see {{alert.tags}}.
Fragments
This is not so much an extension, as a change in terminology worth mentioning. At the API level, we accept a JSON object fragments which are the same concept as mustache partials. These are accessed in the calling template using the partials syntax. So, if you add a fragment object like:
    "fragments": {
        "fruit": "<b>apple</b>",
        "vegetable": "{{veggie}}"
    }
Then you can access them in your template like:
Today, I really want to eat {{>fruit}} and skip eating {{>vegetable}}You may note that the fruit fragment is allowed to contain formatting and will not be escaped and you may also note that the vegetable is still a full featured template itself and will attempt lookups and rendering on the fly using the same options as the main template.
Top-level objects
Monitor notification actions expose the following top-level objects:
{{monitor}}— Details about the Monitor that fired.{{alert}}— Details about the alarm event.{{dataset}}— Details about the affected Dataset.
For all of the following examples, they are shown with the full path to the object, and all of the sub fields of that section.
{{monitor}} section
{{monitor}} sectionThe {{monitor}} object returns Metadata about the Monitor that fired the notification. Use these fields for runbook links, Monitor identity in ticket subjects, or routing context.
Rendering {{monitor}} directly prints the monitor name (same as {{monitor.name}}).
| Field | Description |
|---|---|
{{monitor.name}} | Monitor display name. |
{{monitor.description}} | Free-text description from the monitor settings. Empty string if none was set. |
{{monitor.id}} | Monitor object ID as a string (numeric Observe by Snowflake object ID, e.g. 41234567). |
{{monitor.type}} | Monitor rule kind: Count, Promote, Threshold, or Anomaly (PascalCase, matches the rule type in the UI). |
{{monitor.icon}} | URL of the monitor’s icon (iconUrl in the API). Empty string if no custom icon is configured. |
{{monitor.url}} | HTTPS link to open this monitor in the Observe by Snowflake console. Pattern: https://{domain}/workspace/{workspaceId}/{type}-monitor/{id}?monitorVersion={version} ( {type} is the lowercased rule kind, e.g. threshold-monitor). |
{{monitor.variables}} | Map of pre-rendered custom variable strings. See {{monitor.variables}} section below. |
Example:
[{{monitor.name}}]({{monitor.url}}) ({{monitor.type}}): {{monitor.description}}{{monitor.variables}} section
{{monitor.variables}} sectionThe Observe by Snowflake UI supports title and message variables that can be referenced in inline and shared actions. These variables are similar to Fragments/Partials in that they can reference the rest of the variables in this document. Because they are variables, they will be encoded at the place they are used, so you can use plain text in the variable and depending on how it is used in your action, it will be appropriately encoded.
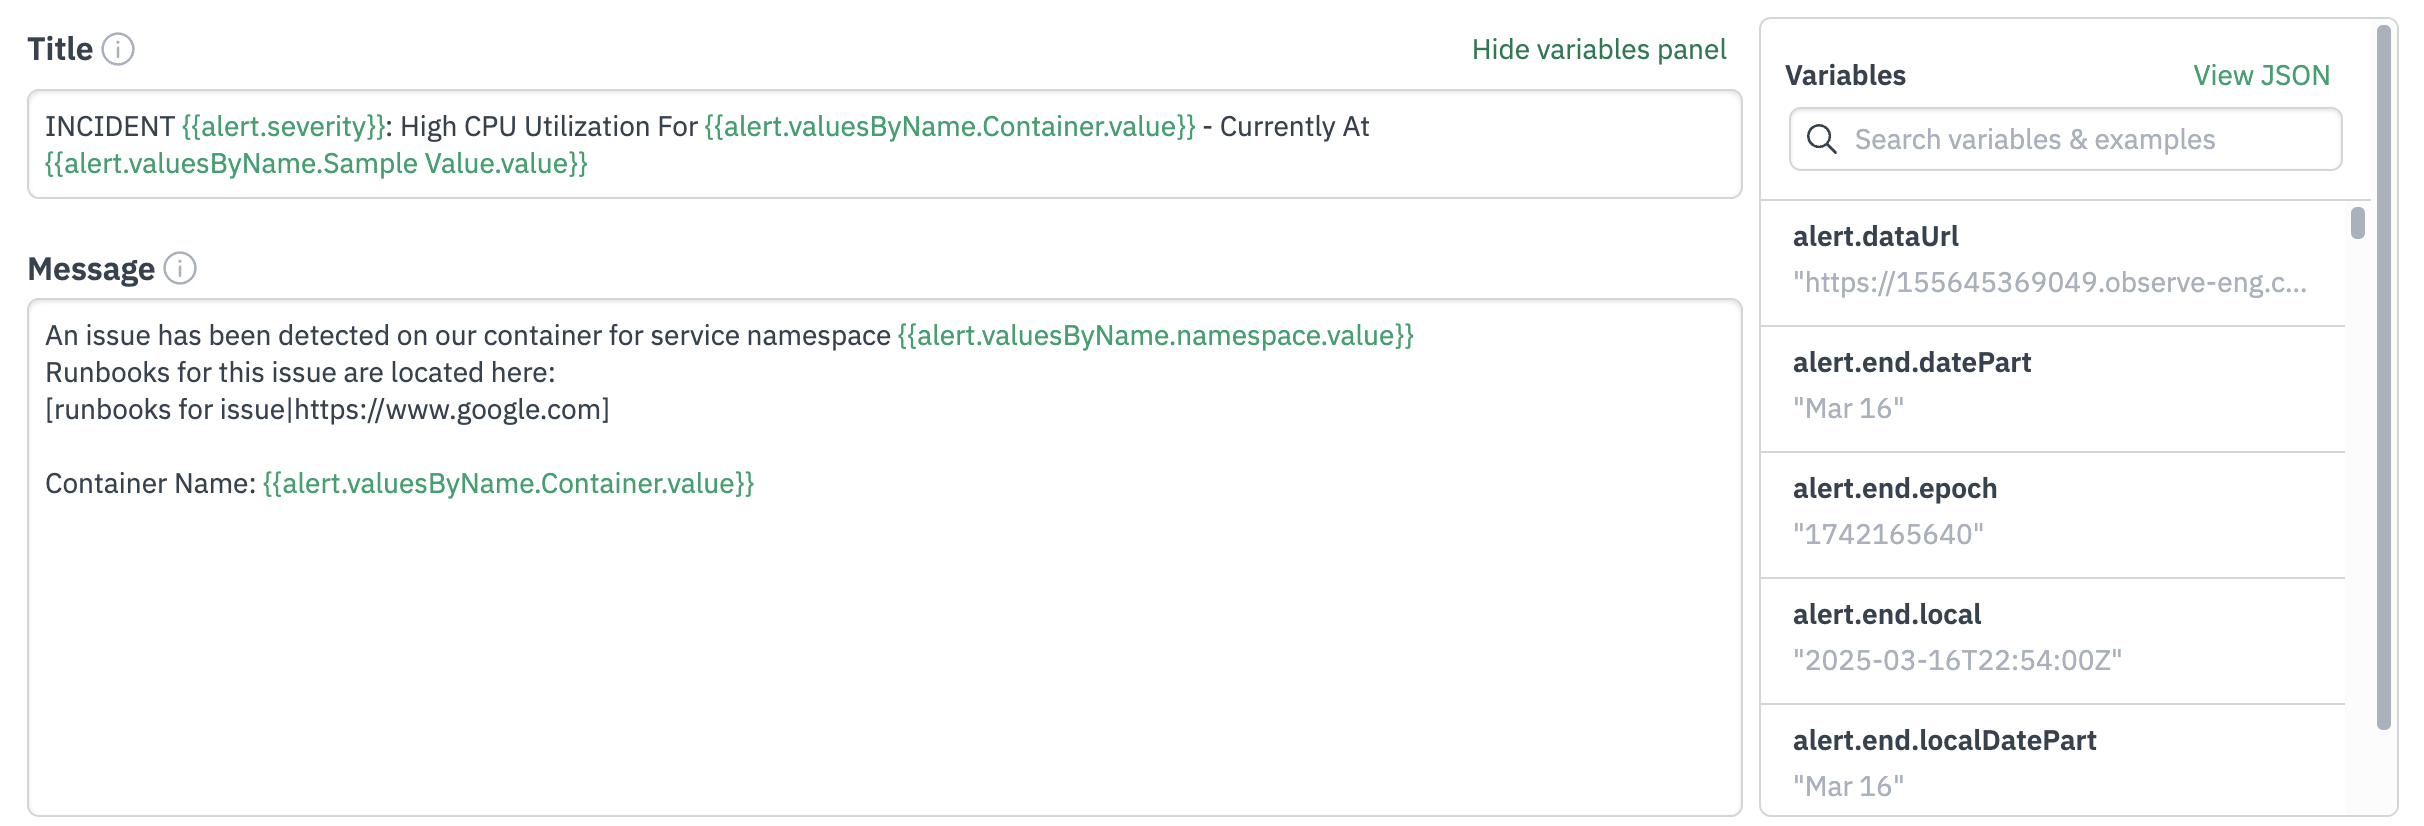
For example lets take a threshold monitor that monitors container CPU utilization, and has the following content for the {{monitor.variables.title}} and {{monitor.variables.message}} sections respectively.
Title:
INCIDENT {{alert.severity}}: High CPU Utilization For {{alert.valuesByName.Container.value}} - Currently At {{alert.valuesByName.Sample Value.value}}Message (formatting examples provided for Slack and JIRA):
An issue has been detected on our container for service namespace {{alert.valuesByName.namespace.value}}
Runbooks for this issue are located here:
[runbooks for issue|https://www.google.com]

Container Name: {{alert.valuesByName.Container.value}}
An issue has been detected on our container for service namespace {{alert.valuesByName.namespace.value}}
Runbooks for this issue are located here:
[runbooks for issue](https://www.google.com)
Container Name: {{alert.valuesByName.Container.value}}You can then reference the above as variables in an action. To continue with our example, we will add a webhook shared action with the following JSON payload.
{"fields": {
        "summary": "{{monitor.variables.title}}",
        "issuetype": {
            "id": "10002"
        },
        "project": {
            "key": "SCRUM"
        },
        "description": {
            "type": "doc",
            "version": 1,
            "content": [
                {
                "type": "paragraph",
                "content": [
                    {
                    "text": "{{monitor.variables.message}}",
                    "type": "text"
                    }
                ]
                }
            ]
        }
    }
}
The resulting preview in your monitor will look similar to the following (formatting examples provided for Slack and JIRA):
{"fields": {
        "summary": "INCIDENT Error: High CPU Utilization For fluent-bit - Currently At 10.6752",
        "issuetype": {
            "id": "10002"
        },
        "project": {
            "key": "SCRUM"
        },
        "description": {
            "type": "doc",
            "version": 1,
            "content": [
                {
                "type": "paragraph",
                "content": [
                    {
                    "text": "An issue has been detected on our container for service namespace observe-110491371772\nRunbooks for this issue are located here:\n[runbooks for issue|https://www.google.com]\n\nContainer Name: fluent-bit",
                    "type": "text"
                    }
                ]
                }
            ]
        }
    }
}
{"fields": {
"summary": "INCIDENT Error: High CPU Utilization For fluent-bit - Currently At 10.6752",
"issuetype": {
"id": "10002"
},
"project": {
"key": "SCRUM"
},
"description": {
"type": "doc",
"version": 1,
"content": [
{
"type": "paragraph",
"content": [
{
"text": "An issue has been detected on our container for service namespace observe-110491371772\nRunbooks for this issue are located here:\n[runbooks for issue](https://www.google.com)\n\nContainer Name: fluent-bit",
"type": "text"
}
]
}
]
}
}
}In this example, you can expect that your message will have newlines and quotes escaped for use in the text field of this JSON document.
{{alert}} section
{{alert}} sectionThe {{alert}} block returns context about the specific alarm event that triggered this notification — times, severity, captured match data, links, and (when configured) service attribution. Unlike {{monitor}}, there is no useful direct render for {{alert}} alone; always use fully qualified paths such as {{alert.severity}} or {{alert.start.localTimePart}}.
| Field | Description |
|---|---|
{{alert.timestamp}} | Time the match was evaluated for this notification. Renders as RFC3339 (UTC); same subfields as Time fields. |
{{alert.start}} | When the matching condition started in the source data. Same subfields as Time fields. |
{{alert.end}} | When the matching condition ended in the source data. Empty while the alarm is still active ({{alert.isActive}} is true). Same subfields as Time fields. |
{{alert.detectedStart}} | When Observe by Snowflake first detected the alarm as active (platform detection time). Same subfields as Time fields. |
{{alert.detectedEnd}} | When Observe by Snowflake last detected the alarm as inactive. Empty while active. Same subfields as Time fields. |
{{alert.isActive}} | Boolean. true while the matching condition is still triggering; false after it clears. |
{{alert.id}} | Alarm ID as a UUID string (distinct from {{monitor.id}}, which is the monitor's numeric object ID). |
{{alert.url}} | HTTPS link to this alert in the Observe by Snowflake console. Pattern: https://{domain}/workspace/{workspaceId}/alert?monitorId=…&alarmId=…&alertStartTime=… (and alertEndTime=… when resolved). |
{{alert.severity}} | Alarm severity. Renders as {{alert.severity.level}}. See {{alert.severity}} section. |
{{alert.type}} | Notification event type (new, reminder, or ended). Renders as {{alert.type.friendly}}. See {{alert.type}} section. |
{{alert.dataUrl}} | Link to explore the filtered data context that produced this alert (/workspace/{workspaceId}/alert-data?…). |
{{alert.apmUrl}} | APM dependency-map URL when the monitor has a service binding and the alarm resolved to a service triplet; empty otherwise. Gate with {{#alert.apmUrl}}…{{/alert.apmUrl}}. |
{{alert.values}} | Iterable list of captured column values from the match. See {{alert.values}} section and Captured value layout. |
{{alert.valuesByName}} | Same captured values as {{alert.values}}, keyed by display name (map lookup). No isFirst / isLast. |
{{alert.tags}} | Iterable list of correlation tags captured on the alert (for example service.name). Never appears under values / valuesByName. |
{{alert.valuesByTag}} | Same correlation tags as {{alert.tags}}, keyed by bare tag name. Use quoted keys when the tag contains dots. |
{{alert.resources}} | Iterable list of linked resources (dashboard/explorer URLs). See {{alert.resources}} section. |
{{alert.resourcesByLink}} | Same resources as {{alert.resources}}, keyed by link label (for example Pod, User). |
Exxample:
{{#alert.type.isNewAlarm}}
[{{monitor.name}}] {{alert.severity.level}} at {{alert.start.localTimePart}}, {{alert.start.localDatePart}}
{{/alert.type.isNewAlarm}}
{{#alert.apmUrl}}View in APM: {{alert.apmUrl}}{{/alert.apmUrl}}
{{alert.start}} section
{{alert.start}} sectionAll alert time fields ({{timestamp}}, {{start}}, {{end}}, {{detectedStart}}, {{detectedEnd}}) share the same subfields and timezone resolution.
This variable can be rendered directly, which prints the rfc3339 value or using one of the sub fields.
{{rfc3339}}: The RFC3339 Format (like 2024-06-01T12:34:56Z){{timePart}}: Just minutes and seconds (like 12:34 UTC){{datePart}}: Just the date without the year (like Jun 01){{epoch}}: Unix seconds since epoch in UTC (like 1717244636){{epochNanos}}: Unix nanoseconds since epoch in UTC (for example 1717244636123456789){{local}}: Similar torfc3339, but in the configured local timezone.{{timezone}}: The IANA timezone string.{{localTimePart}}: Similar totimePart, but in the configured local timezone (like 12:34 EDT).{{localDatePart}}: Similar todatePart, but in the configured local timezone.
| Subfield | Timezone | Example use |
|---|---|---|
rfc3339, epoch, epochNanos | UTC | Webhooks/APIs that localize themselves |
timePart, datePart | UTC (labelled "UTC") | Short UTC display |
local, localTimePart, localDatePart, timezone | Resolved local TZ | Email/Slack human-readable times |
Rendering {{alert.start}} directly prints RFC3339 (UTC), not local time. Use {{alert.start.localTimePart}} or {{alert.start.localDatePart}} for localized display.
The local fields are a best-guess for cases where your notification does not have built-in timestamp localization support. For example, some webhooks can use a RFC3339 (or ISO8601) timestamp or a Unix epoch value and will format to the user's application dynamically. Some destinations, like email, do not have this ability so a best-guess local time is generated. The ordering of this best-guess is as follows:
- The configured timezone of the monitor creator if this user is active and a timezone has been saved to their settings.
- The configured timezone for your organization in Observe by Snowflake
- UTC
Example:
{{alert.start.localTimePart}}, {{alert.start.localDatePart}} {{alert.start.timezone}}Example output:
08:34 EDT, Jun 01 America/New_York
Example for Slack-style subject lines:
{{monitor.name}} at {{alert.start.localTimePart}}, {{alert.start.localDatePart}}{{alert.end}} section
{{alert.end}} sectionSame as {{alert.start}}.
{{alert.detectedStart}} section
{{alert.detectedStart}} sectionSame as {{alert.start}}.
{{alert.detectedEnd}} section
{{alert.detectedEnd}} sectionSame as {{alert.start}}.
{{alert.timestamp}} section
{{alert.timestamp}} sectionSame as {{alert.start}}
{{alert.severity}} section
{{alert.severity}} sectionThis variable can be rendered directly, which prints the same as level or using the sub fields below.
{{level}}: One of Critical, Error, Informational, Warning, or NoData{{isCritical}}: True when the{{level}}is critical.{{isError}}: True when the{{level}}is error.{{isWarning}}: True when the{{level}}is warning.{{isInformational}}: True when the{{level}}is info.{{isNoData}}: True when the severity{{level}}is NoData.
{{alert.type}} section
{{alert.type}} sectionThis variable can be rendered directly, which prints the same as friendly or using the sub fields below.
{{eventType}}: One of NewAlarm, Reminder, AlarmConditionEnded{{friendly}}: A more user-friendly version of eventType: New Alarm, Reminder, and Alarm Ended{{isNewAlarm}}: Indicates if the event type is NewAlarm{{isReminder}}: Indicates if the event type is Reminder{{isAlarmEnded}}: Indicates if the event type is AlarmConditionEnded
Notifications use three event types. Render {{alert.type}} for the human-readable label, or branch on the boolean flags:
| When | eventType | friendly | Use in templates |
|---|---|---|---|
| First firing | NewAlarm | New Alarm | {{#alert.type.isNewAlarm}} |
| Repeat while active | Reminder | Reminder | {{#alert.type.isReminder}} |
| Condition cleared | AlarmConditionEnded | Alarm Ended | {{#alert.type.isAlarmEnded}} |
{{alert.type.eventType}} returns the machine value, such as AlarmConditionEnded, not AlarmEnded. End/resolution notifications are sent only when the Monitor action has end notifications enabled.
{{alert.values}} section
{{alert.values}} sectionThis variable can be enumerated as a section. Each entry is a captured column value from the monitor match. You can filter by type (for example, only group-by values with {{type.isGroupBy}}).
Entries include plain column paths, aggregation outputs, promote columns, and link columns (by link label). Correlation tags are not included — use {{alert.tags}} or {{alert.valuesByTag}} instead. Link columns also appear under {{alert.resources}} with URLs; see Captured value layout.
Correlation tags are not included in {{alert.values}} or {{alert.valuesByName}}. Use {{alert.tags}} and {{alert.valuesByTag}} instead.
Some additional notes about captured value names:
- Threshold monitors expose Last Detected Value; templates can also use Sample Value.
- Anomaly monitors expose Percentage.
- Count monitors expose Count (prettified name).
- Duration/timestamp column types are prettified in string output. For example, durations as Go duration strings, and timestamps as RFC3339Nano).
{{#alert.values}}
Each Column Name: {{name}}
{{/alert.values}}

{{#alert.values}}
    {{#type.isGroupBy}}Grouped By {{name}} : {{value}}{{/type.isGroupBy}}
{{/alert.values}}{{type}}: The type contains sub fields you can use to test why the value was captured. A value can be multiple types.{{name}}: A rendered name for the captured column value{{value}}: The captured value in string form{{isFirst}}: Indicates if this is the first in the iteration{{isLast}}: Indicates if this is the last in the iteration
Captured value layout
When a Monitor fires, captured match data is split across the following template areas:
| Kind of data | Template fields | Notes |
|---|---|---|
| Plain column paths and aggregations | {{alert.values}}, {{alert.valuesByName}} | Group-by columns, aggregation outputs (for example count), promote columns, and link columns |
| Correlation tags | {{alert.tags}}, {{alert.valuesByTag}} | OpenTelemetry-style tags such as service.name. Never appear under values or valuesByName. See Correlation tags. |
| Linked resources | {{alert.resources}}, {{alert.resourcesByLink}} | One entry per link column in the match. Always populated when the monitor groups by a link. |
Link columns appear in two places: under {{alert.resources}} (with URLs) and also under {{alert.values}} / {{alert.valuesByName}} (name and dereferenced label only). Use {{alert.resources}} when you need dashboard or explorer links; use {{alert.values}} when you want a flat list of all captured names and values.
Correlation tags use their bare tag name (for example service.name) as name in {{alert.tags}} and as the map key in {{alert.valuesByTag}}.
{{alert.values.type}} section
{{alert.values.type}} sectionThis subtype that has "is*" flags for each of the types a value can be. These are not necessarily exclusive.
{{isGroupBy}}: The value is used in the grouping.{{isAggregation}}: The value is part of the aggregation calculation.
{{alert.valuesByName}} section
{{alert.valuesByName}} sectionYou can access the same elements as {{alert.values}}, but using a lookup by their unique name. All of the same fields exist except for the iteration fields isFirst and isLast.
This produces the same output in the previous example where {{alert.values.name}} is equal to value captured from "Flavor" column.
{{#alert.valuesByName.Flavor}}
My favorite ice cream flavor is {{value}}
{{/alert.valuesByName.Flavor}}
Make sure valuesByName keys don't contain dots, as Mustache treats dots as path separators.
It's OK to have spaces in the column name, such as Sample Value in the following example:
{{#alert.valuesByName.Sample Value}}{{value}}{{/alert.valuesByName.Sample Value}}Link column labels, such as Pod, are valid lookup keys. Correlation tag names, such as service.name are not lookup keys. In such cases, use {{alert.valuesByTag}} with quoted key syntax, or iterate {{#alert.tags}}.
{{alert.resources}} section
{{alert.resources}} sectionEach linked resource from a Monitor link column grouping exposes four string fields. Use {{alert.resources}} to iterate all resources; use {{alert.resourcesByLink.<Label>}} to look up one resource by its link label (for example Pod, User).
| Subfield | Applies to | Description |
|---|---|---|
{{alert.resources.label}} | Both | Link column label — the name of the link definition on the monitor (for example Pod, User). |
{{alert.resources.value}} | Both | Human-readable dereferenced resource name. Rendering a resource item directly (for example {{.}} inside {{#alert.resources}}) prints this field. |
{{alert.resources.url}} | Both | HTTPS link to the resource dashboard in the Observe by Snowflake console. |
{{alert.resources.explorerUrl}} | Both | HTTPS link to the resource explorer for the same resource, with alert-time filters applied. |
{{alert.resources.isFirst}} | resources only | true on the first item when iterating {{#alert.resources}}. |
{{alert.resources.isLast}} | resources only | true on the last item when iterating {{#alert.resources}}. |
{{alert.resourcesByLink}} has the same four data fields (label, value, url, explorerUrl) but no isFirst / isLast.
URLs longer than 2048 characters are replaced with a sanity-limit error string.
Example: iterate all resources:
{{#alert.resources}}
[{{label}}] {{value}}
Dashboard: {{url}}
Explorer: {{explorerUrl}}
{{/alert.resources}}
Example: lookup by link label:
{{#alert.resourcesByLink.Pod}}
Pod {{value}}
Dashboard: {{url}}
Explorer: {{explorerUrl}}
{{/alert.resourcesByLink.Pod}}
Link columns appear in two places: under {{alert.resources}} / {{alert.resourcesByLink}} (with label, value, url, and explorerUrl) and under {{alert.values}} / {{alert.valuesByName}} (name and dereferenced label only, no URLs). Use {{alert.resources}} when you need dashboard or explorer links; use {{alert.values}} for a flat name/value list.
{{alert.resourcesByLink}} section
{{alert.resourcesByLink}} sectionYou can access the unique resource specified by the link label. This has all the same fields as {{alert.resources}} except the iteration context fields isFirst and isLast.
{{#alert.resourcesByLink.User}}
Render this for user {{value}}
{{/alert.resourcesByLink.User}}
{{alert.tags}} section
{{alert.tags}} sectionCorrelation tags are always surfaced under {{alert.tags}} or {{alert.valuesByTag}}, never under {{alert.values}} or {{alert.valuesByName}}.
The Monitor must group by correlation tag in order for these fields to be populated. See Link dashboards to your alert messages for an example.
Each element has the same shape as {{alert.values}} entries:
| Field | Description |
|---|---|
{{type}} | isGroupBy / isAggregation flags |
{{name}} | Bare tag name (for example, service.name) |
{{value}} | Resolved tag value (prettified like other captured values) |
{{isFirst}} / {{isLast}} | Iteration helpers |
Example:
{{#alert.tags}}
{{name}}: {{value}}
{{/alert.tags}}
{{alert.valuesByTag}} section
{{alert.valuesByTag}} sectionSame fields as {{alert.tags}}, but map lookup by bare correlation tag name, not isFirst / isLast.
Tag names often contain dots, such as service.name, which Mustache would otherwise treat as nested path segments. Use quoted key syntax to address a single literal key:
{{alert.valuesByTag."service.name".value}}Do not write {{alert.valuesByTag.service.name.value}} for a tag named service.name, which resolves a nested service > name path, not the correlation tag.
Example of a section with a quote key:
{{#alert.valuesByTag."k8s.namespace"}}
namespace={{value}}
{{/alert.valuesByTag."k8s.namespace"}}
Single quotes also work:
{{alert.valuesByTag.'deployment.environment.name'.value}}For missing tags, use inverted sections. Make sure the open and close tags match perfectly, including the quote style:
{{^alert.valuesByTag."k8s.namespace"}}no-namespace{{/alert.valuesByTag."k8s.namespace"}}{{dataset}} section
{{dataset}} sectionDataset identity for dataset-health notifications — when a transform is suspended and a bound action fires (email, webhook, Slack, or PagerDuty). This namespace is not populated for normal monitor alert templates; referencing {{dataset.*}} in a monitor action renders empty on monitor alerts.
Rendering {{dataset}} directly prints the dataset name (same as {{dataset.name}}).
| Field | Description |
|---|---|
{{dataset.name}} | Dataset display name. For monitor-backed generated datasets, this may look like monitor/individual 42599094. |
{{dataset.id}} | Dataset object ID as a string (numeric ID, for example 555). |
{{dataset.url}} | HTTPS link to the dataset (or monitor) in the Observe by Snowflake console. Empty when the API host or workspace is unknown. |
URL behavior:
| Dataset kind | {{dataset.url}} pattern |
|---|---|
| Regular dataset | https://{domain}/workspace/{workspaceId}/dataset/{datasetId} |
| Monitor-backed dataset | https://{domain}/workspace/{workspaceId}/monitor-v2/{monitorId} (links to the owning monitor, not the generated dataset) |
Example:
Transform suspended: {{dataset.name}} ({{dataset.id}})
Open: {{dataset.url}}
When {{dataset}} is available
{{dataset}} is availableDataset health notifications are sent when a Dataset transform is suspended and the Dataset has bound Monitor v2 actions configured. These notifications reuse the same Mustache machinery as monitor actions, but populate a synthetic template dictionary:
| Namespace | What you get |
|---|---|
{{dataset.*}} | Real dataset identity (name, id, url). Prefer this for dataset-health templates. |
{{alert.*}} | Synthetic event: type.friendly is Dataset suspended; valuesByName includes Reason, Mode, and Dataset; isActive is true while suspended. |
{{monitor.*}} | Synthetic monitor: name is Dataset unhealthy: {dataset name}, type is datasetHealth, url matches {{dataset.url}}. For back-compat with templates that only reference {{monitor.*}}. |
Example: webhook body using both namespaces:
{
  "event": "{{alert.type.friendly}}",
  "dataset": {
    "name": "{{dataset.name}}",
    "id": "{{dataset.id}}",
    "url": "{{dataset.url}}"
  },
  "reason": "{{alert.valuesByName.Reason.value}}",
  "mode": "{{alert.valuesByName.Mode.value}}"
}
Example: email subject using {{dataset}} only:
{{alert.type.friendly}}: {{dataset.name}}{{alert.valuesByName}} on dataset-health notifications
{{alert.valuesByName}} on dataset-health notificationsIn addition to {{dataset.*}}, the following captured values are available:
| Key | Description |
|---|---|
Reason | Human-readable suspend reason (for example transform timed out). |
Mode | Acceleration mode that suspended: Ongoing or Backfilling. |
Dataset | Same string as {{dataset.name}} (legacy/alternate access path). |
Example:
Mode: {{alert.valuesByName.Mode.value}}
Reason: {{alert.valuesByName.Reason.value}}
Updated about 1 month ago