Service management
Learn how to investigate and troubleshoot your services, databases, and message brokers using the Service Explorer.
Service management in Observe APM provides powerful tools to visualize, monitor, and understand your system’s architecture and performance. Service management automatically discovers services, databases, and message brokers from your OpenTelemetry data, offering insights into their health and relationships.
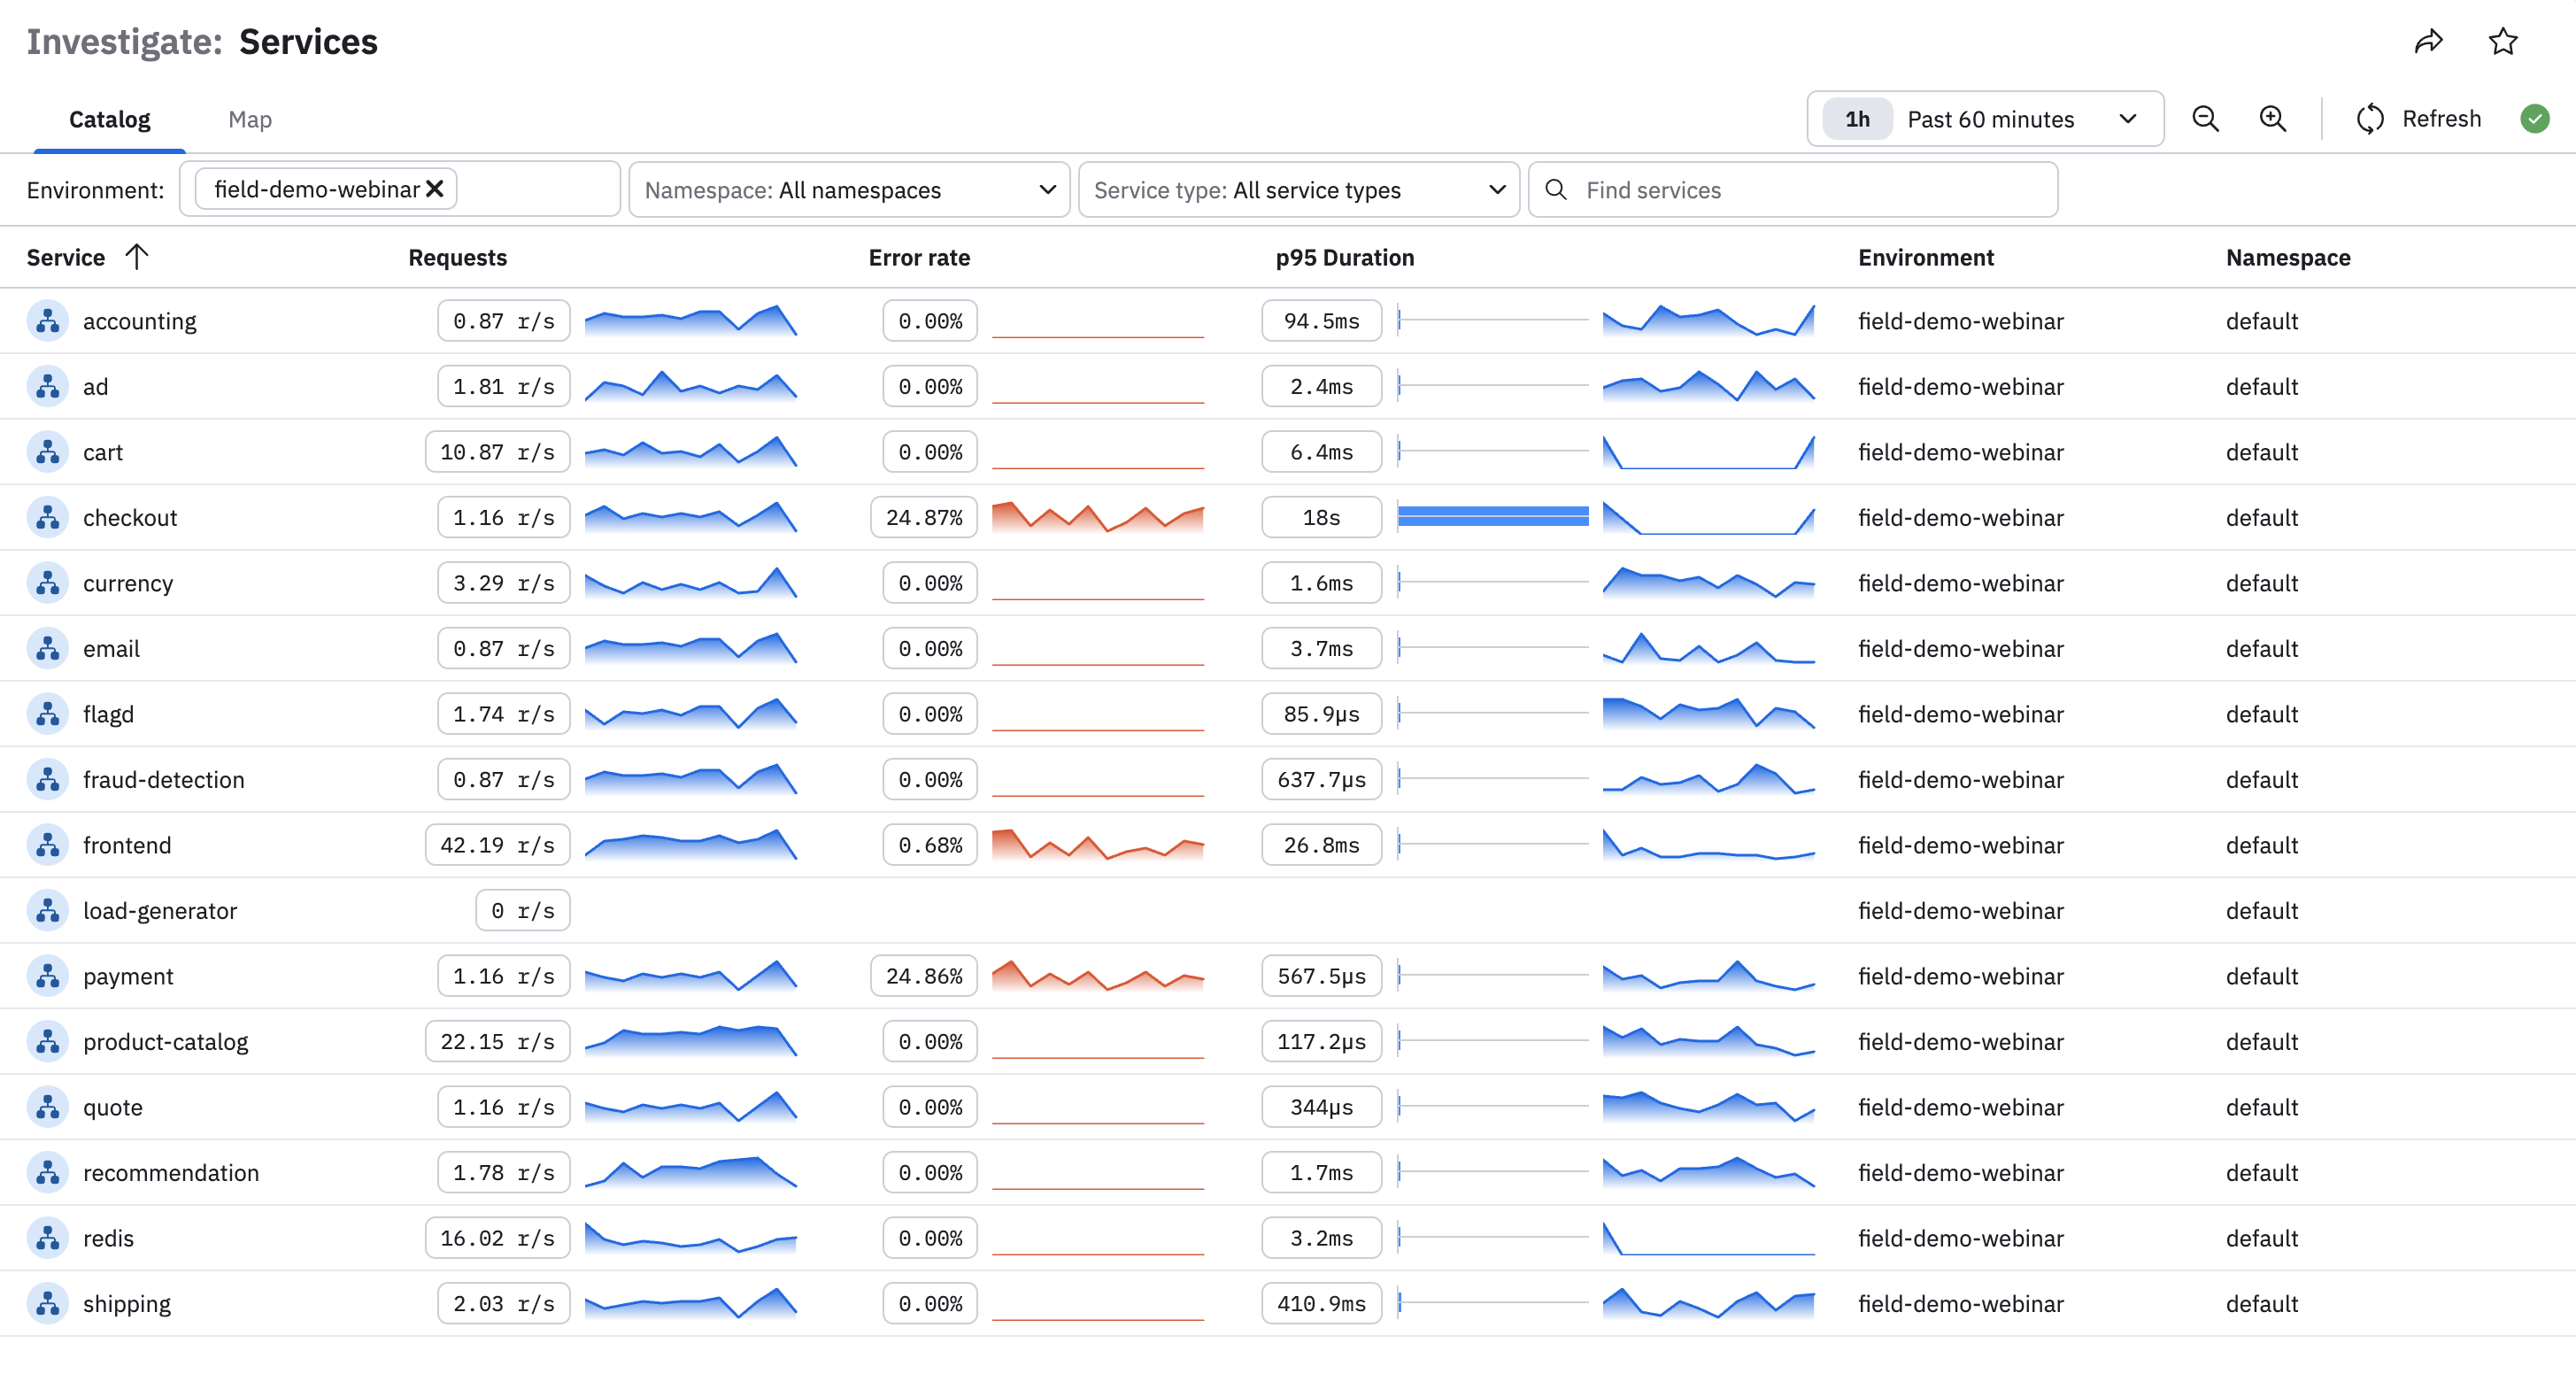
Service catalog
The Service Catalog is a comprehensive list of all services, databases, and message brokers detected in your environment. For each service, it displays critical request rate, errors, and duration (RED) metrics, so you can quickly identify which services might require attention. This view acts as your central hub for exploring the health and activity of your system.
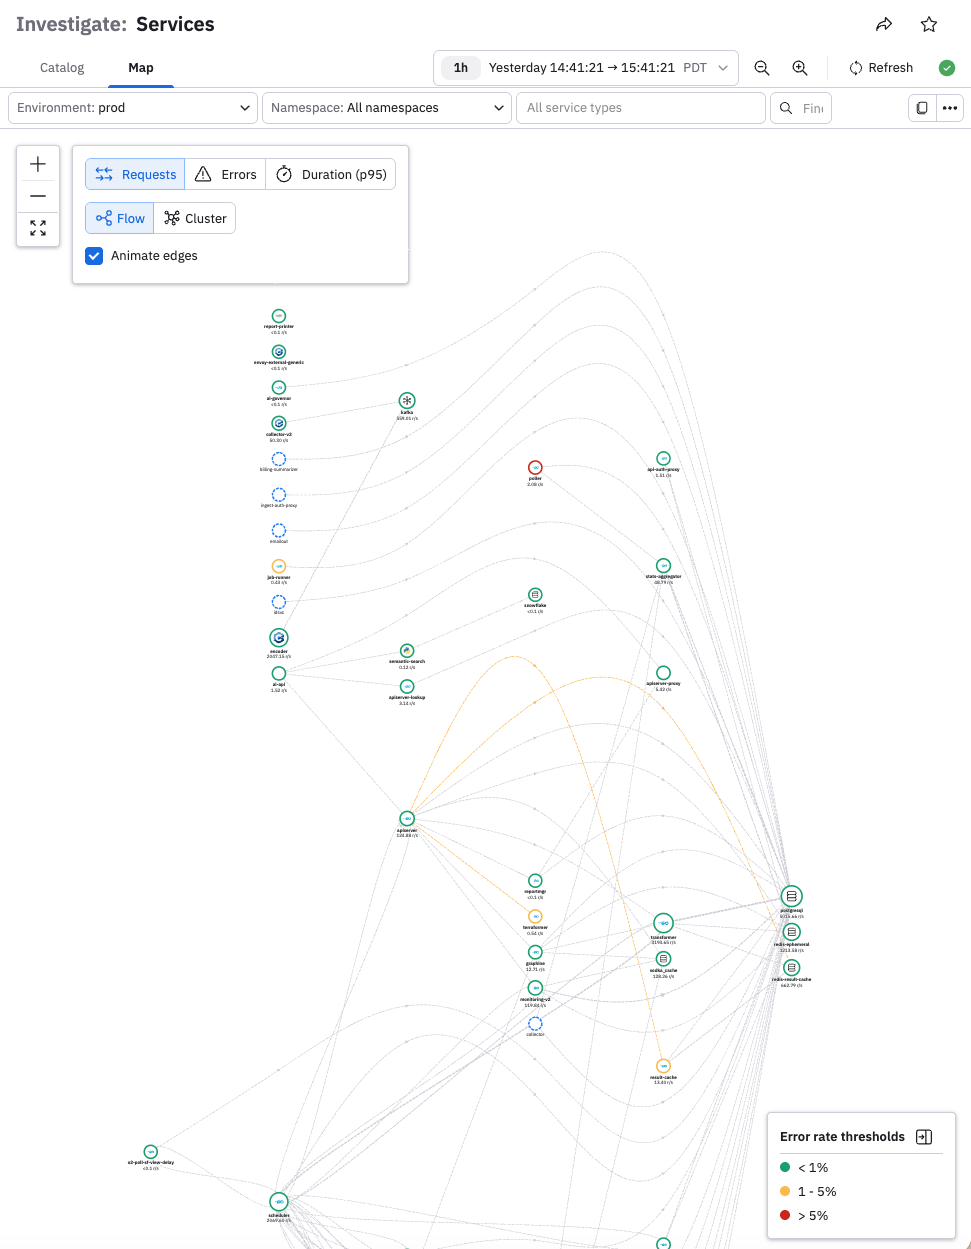
Service map
The Service Map visually represents the communication relationships between services, databases, and message brokers, showing how traffic flows through your system. It overlays RED metrics on both services and the connections (edges) between them, making it easy to identify bottlenecks, errors, or latency issues within dependencies.
These features are designed to streamline debugging, performance optimization, and overall service management by providing a clear, data-driven view of your architecture in real-time.
Services and edges show up on the service map if they have reported data in the last 7 days.
OpenTelemetry data used for service management
APM service management uses the data and relationships in the Span Dataset to discover services, databases, and message brokers.
| Service management capability | Underlying OpenTelemetry data |
|---|---|
| Service naming | The service.name in the span’s resource attributes. |
| Service catalog filtering | The service.namespace, deployment.environment or deployment.environment.name in the span's resource attributes. |
| Service RED metrics | Spans with the type of SERVER. |
| Service-to-service edges | Parent/child spans with different service.name resource attributes. |
| Service-to-database edges | Child spans of type CLIENT with db.* attributes. |
| Database naming | db.* attributes. For example, query statements are read from db.statements. If the db.statements attribute is not set, then the queries are not known to Observe. |
| Database operations | The span_name is used to identify database operations. |
| Message broker | messaging.* attributes, such as messaging.system and messaging.operation.name are required by OTel convention. The messaging.destination.name attribute is required for queue-level visibility. |
Updated about 2 months ago