Fleet Management
Manage the Observe Agent instances across your infrastructure from a single place.
What is Fleet Management?
Fleet Management gives you a single place to understand the deployment and health of Observe Agents across your entire environment—Linux, Windows, MacOS and Kubernetes clusters. It is designed to help Observe users quickly diagnose common problems and gather the right information before contacting Support.
Problems Fleet Management helps to solve
Fleet Management can help you answer the following common questions:
Is the Observe Agent healthy?
The Fleet Management surfaces the following metrics:
- Auth check status
- Endpoint connectivity
- Data flow health (logs, metrics, traces)
- Configuration issues
- Version drift
- Workload readiness (Kubernetes)
If something is wrong, Fleet Management shows the symptom and the next likely cause.
Observe Agent status
Fleet Management calculates one of the following statuses for each of the agents being monitored:
| Status | Description |
|---|---|
| Healthy | The agent is healthy and configured correctly. Heartbeats are being received and error rates are within normal ranges. |
| Shutdown | The agent was shut down gracefully and Observe received a shutdown heartbeat. |
| Error | The agent is unhealthy and needs attention. There are multiple subchecks that run that are aggregated to this status. Specifically, there are 2 subchecks that run:
|
| Unknown | The agent has not reported its status via heartbeat for longer than the 90m validity period. The agent may have shut down but did not send a shutdown heartbeat or it may have crashed/stopped reporting for other reasons that should be investigated. |
If the Observe Agent is not healthy what’s the next thing I should look at?
Fleet Management guides users through a structured troubleshooting workflow:
- Authentication Errors (401 / 403)
- Endpoint Errors (400 / 404 / 500)
- Data Flow Errors (logs, metrics, traces)
- Configuration Issues (multiline, recombine, etc.)
Prerequisites
Fleet Management requires Observe Agent version 2.12.0 or higher or Helm chart for Agent 0.82.0 or higher. Use the following commands to verify your Observe Agent and Helm chart versions:
  $ observe-agent version
  observe-agent version: 2.12.0
  observe-agent config file: /etc/observe-agent/observe-agent.yaml
$ helm list -A | grep -i observe-agent
observe-agent observe 2 2026-01-26 22:44:39.022957853 +0000 UTC deployed agent-0.82.0 2.12.0Install the Observe Agent
If you haven't installed the Observe Agent, you can do so from the Add Data portal:
- In the left navigation, select Data & integrations > Add data.
- In the Observe Agent section, select your environment, then follow the on-screen instructions to create a data ingest token and install the Observe Agent.
During the Observe Agent configuration, make sure you configure the deployment.environment.name.
If you don't do it here, you can also set it later in your YAML configuration file. See Set up your fleet configuration.
Set up your fleet configuration
Follow the instructions for your environment to complete the setup.
Enable fleet configuration
Edit your agent configuration:
sudo vim /etc/observe-agent/observe-agent.yamlAdd or update the self_monitoring block to match the following:
self_monitoring:
  enabled: true
  fleet:
    enabled: true
    interval: 10m
    config_interval: 24h
If you didn't set the deployment.environment.name when you installed the Observe Agent for Linux, you can also set it here. For example, to set the environment to prod:
resource_attributes:
   deployment.environment.name: prod
Restart the Observe Agent
Run the following command to restart the Observe Agent:
sudo systemctl restart observe-agentVerify in Fleet Explorer
Navigate to Data & Integrations > Fleet and confirm your Observe Agent instances appear.
Enable fleet configuration
Edit your agent configuration:
sudo vim /usr/local/observe-agent/observe-agent.yamlAdd or update the self_monitoring block to match the following:
self_monitoring:
  enabled: true
  fleet:
    enabled: true
    interval: 10m
    config_interval: 24h
If you didn't set the deployment.environment.name when you installed the Observe Agent for macOS, you can also set it here. For example, to set the environment to prod:
resource_attributes:
   deployment.environment.name: prod
Restart the Observe Agent
Run the following command to restart the Observe Agent:
sudo launchctl stop "com.observeinc.agent"Verify in Fleet Explorer
Navigate to Data & Integrations > Fleet and confirm your Observe Agent instances appear.
Enable fleet configuration
Edit your agent configuration in C:\Program Files\Observe\observe-agent\observe-agent.yaml.
Add or update the self_monitoring block to match the following:
self_monitoring:
  enabled: true
  fleet:
    enabled: true
    interval: 10m
    config_interval: 24h
If you didn't set the deployment.environment.name when you installed the Observe Agent for Windows, you can also set it here. For example, to set the environment to prod:
resource_attributes:
   deployment.environment.name: prod
Restart the Observe Agent
Run the following command to restart the Observe Agent:
Restart-Service ObserveAgentVerify in Fleet Explorer
Navigate to Data & Integrations > Fleet and confirm your Observe Agent instances appear.
Create fleet-values.yaml
fleet-values.yamlagent:
config:
global:
fleet:
enabled: true
interval: 10m
configInterval: 24hIf you didn't set the deployment.environment.name when you installed the Observe Agent for Kubernetes, you can also set it here. For example, to set the environment to prod:
cluster:
  deploymentEnvironment:
    name: prod
Redeploy the Observe Agent
Run the following command to redeploy the Observe Agent:
helm upgrade --reuse-values observe-agent observe/agent -n observe --values fleet-values.yamlRestart agent pods
kubectl rollout restart deployment -n observe
kubectl rollout restart daemonset -n observe
Verify in Fleet Explorer
Navigate to Data & Integrations > Fleet and confirm your Observe Agent instances appear.
Access the Fleet management dashboard
To access the Fleet dashboard, select Data & integrations > Fleet from the left navigation rail. The Fleet dashboard shows you a summary of how many agents you have, their overall health, and provides filters so you can find specific agents by ID, environment, and host.
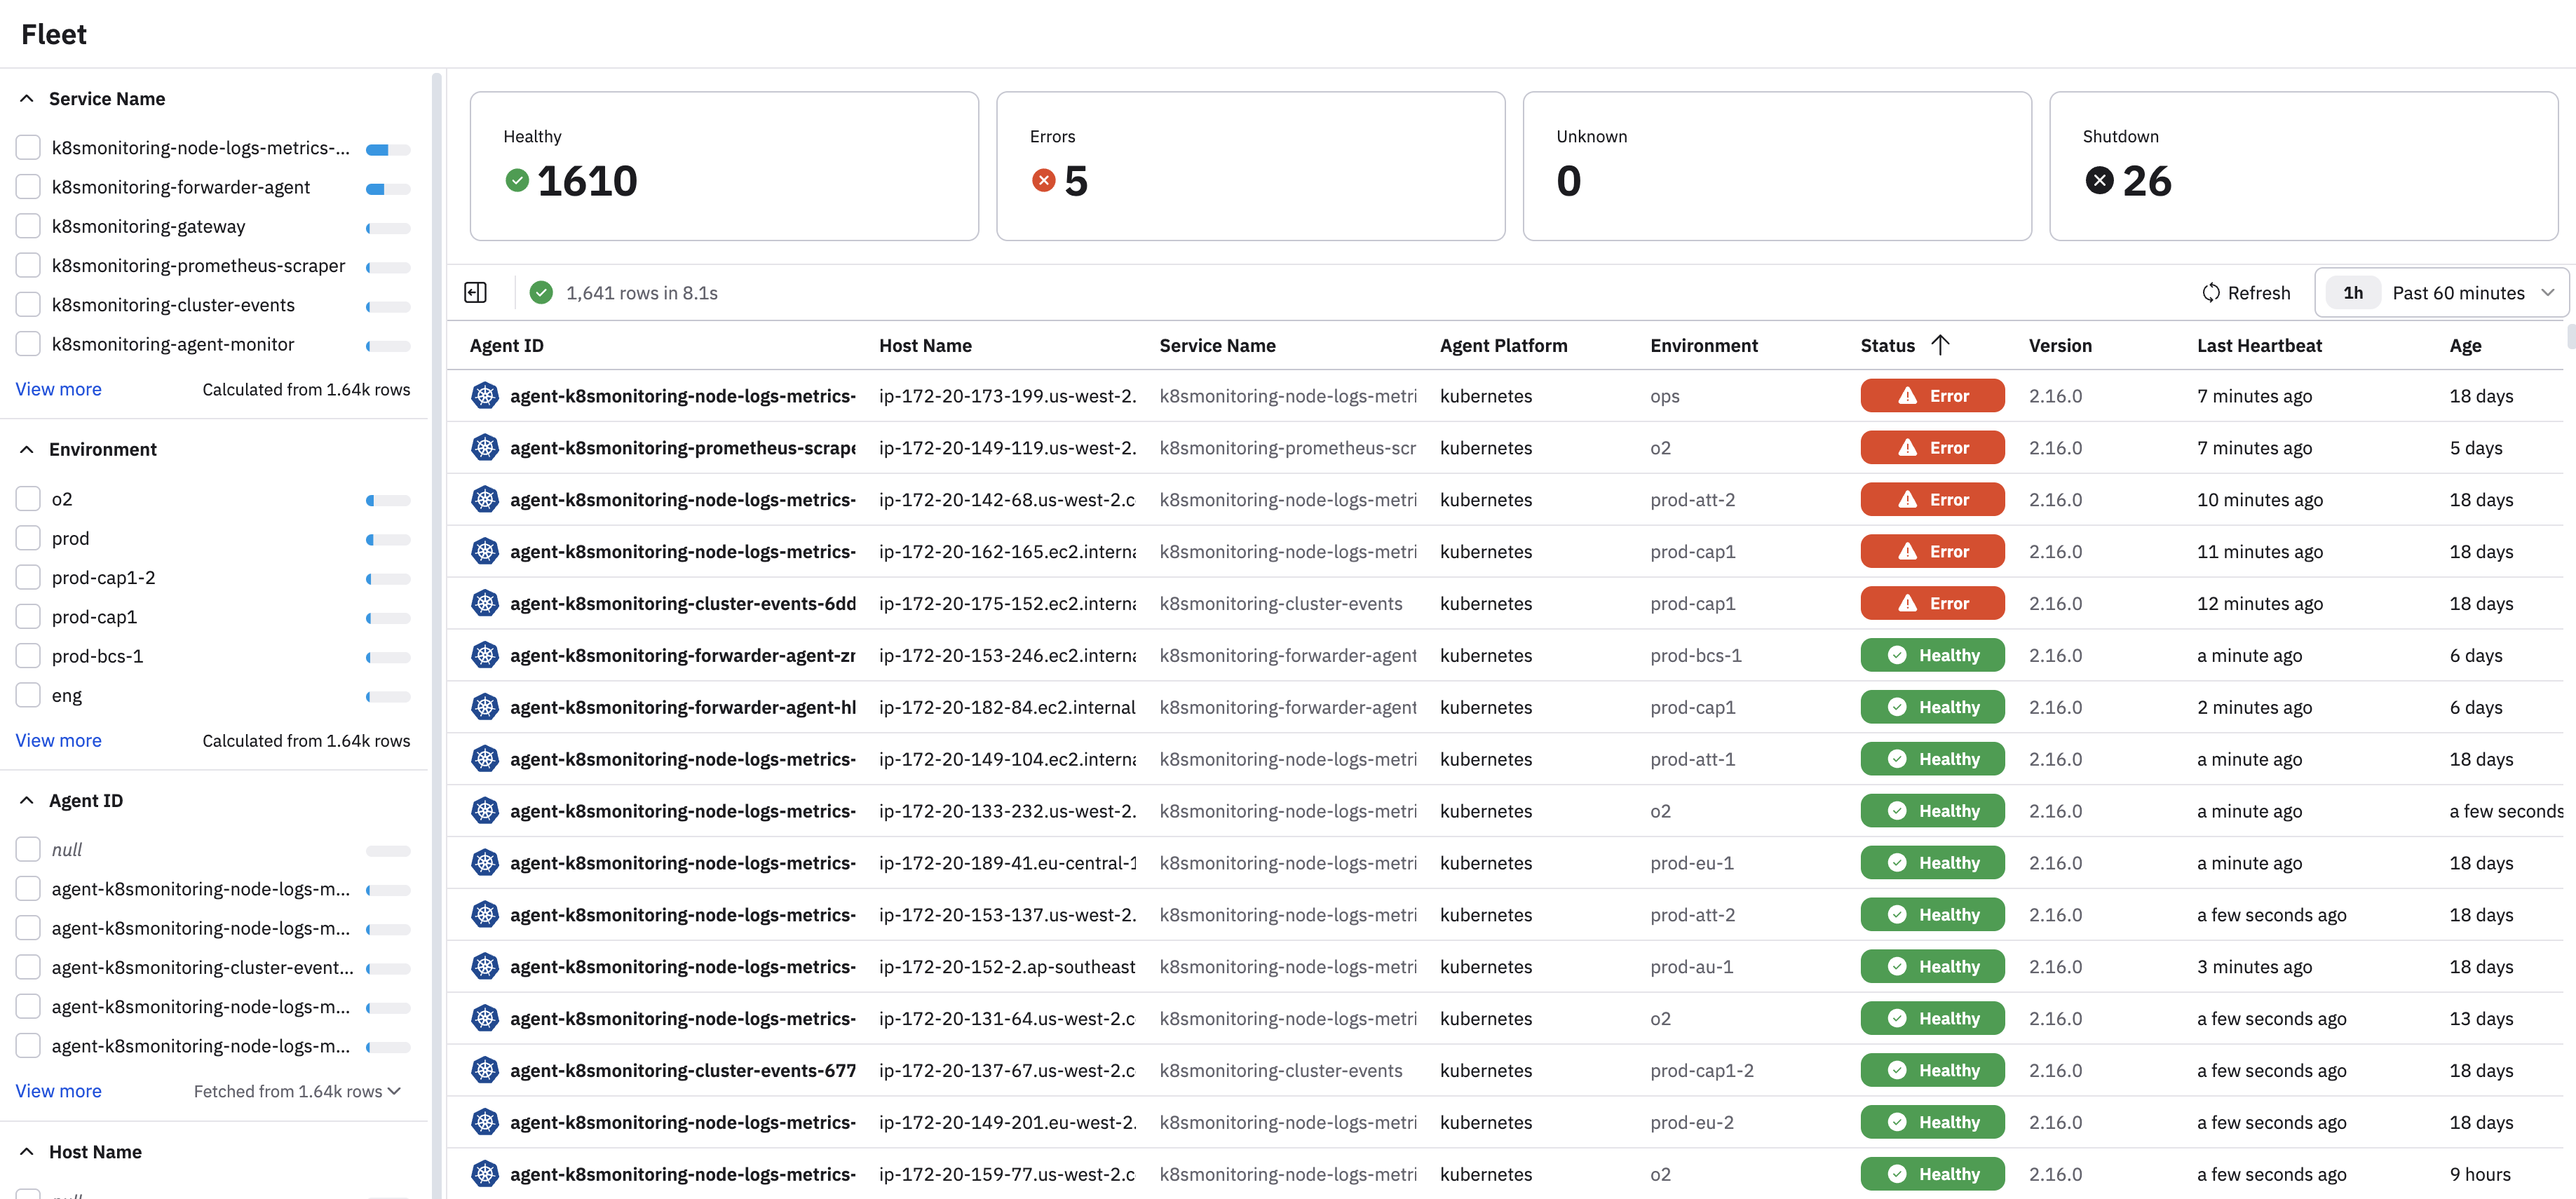
Click on any agent to view details for that agent, including host logs and metrics, such as CPU and memory usage and other details.
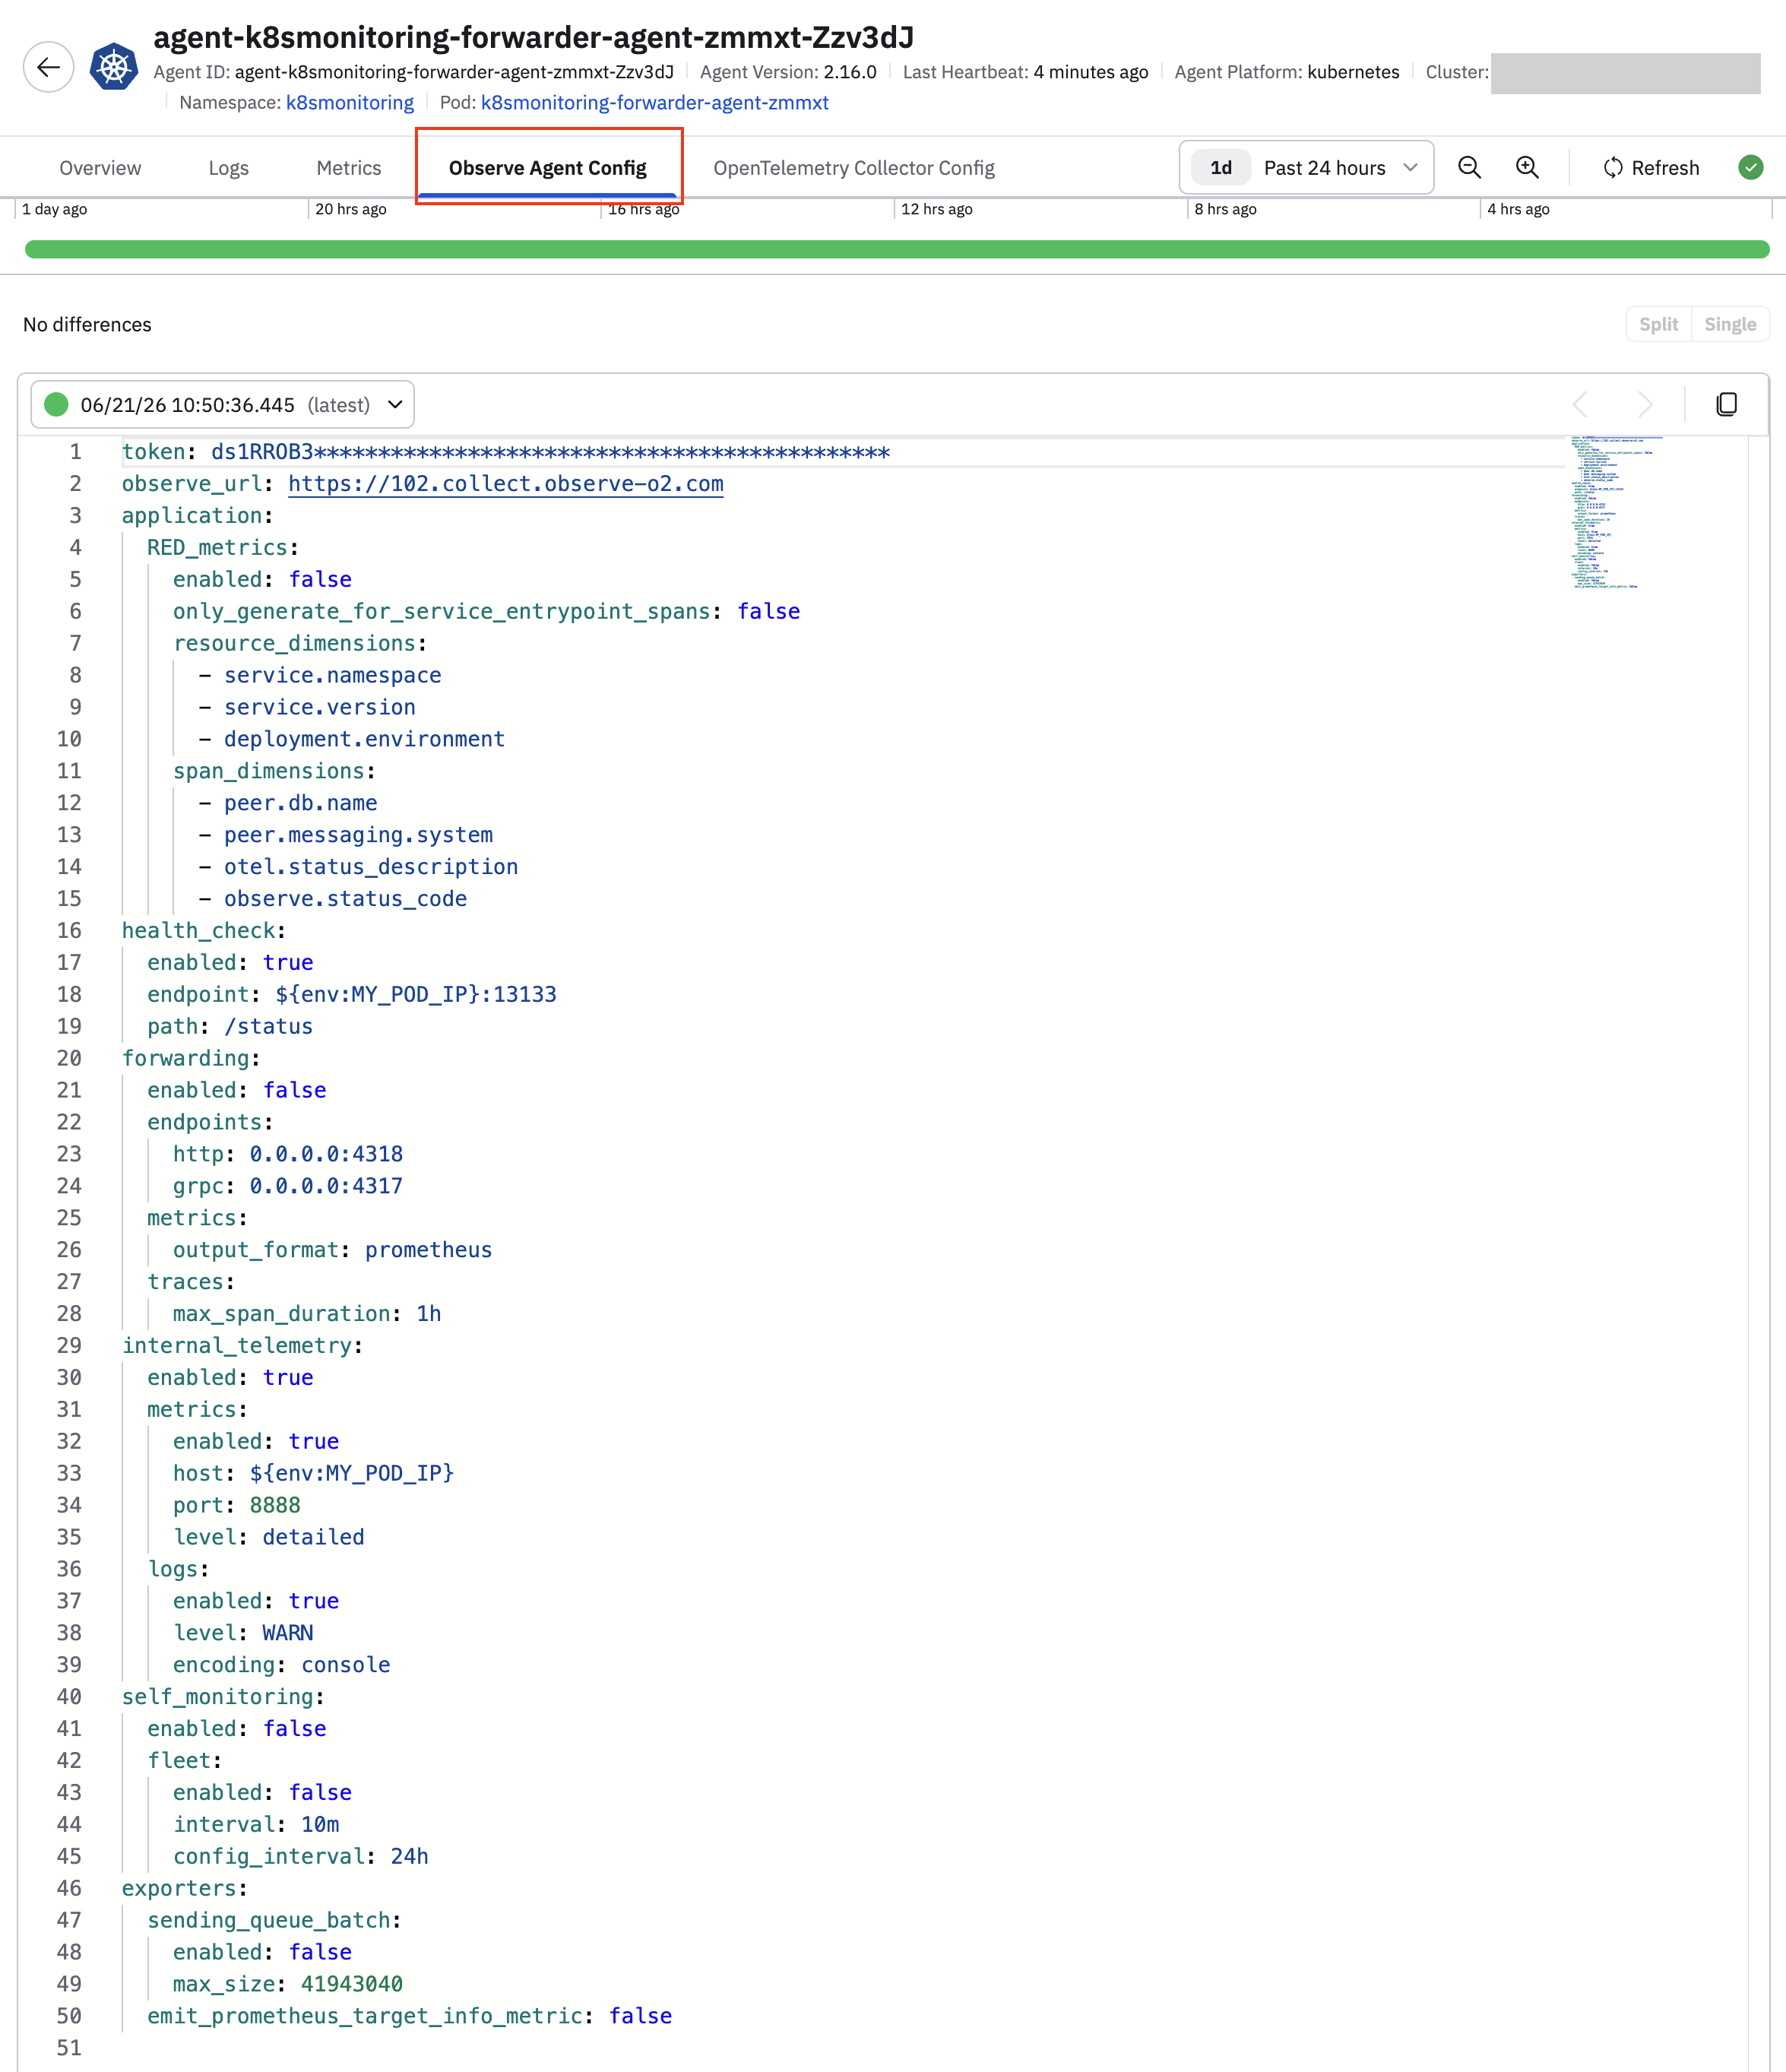
Click on the Observe Agent Config tab to view the observe-agent.yaml configuration for that specific Observe Agent:
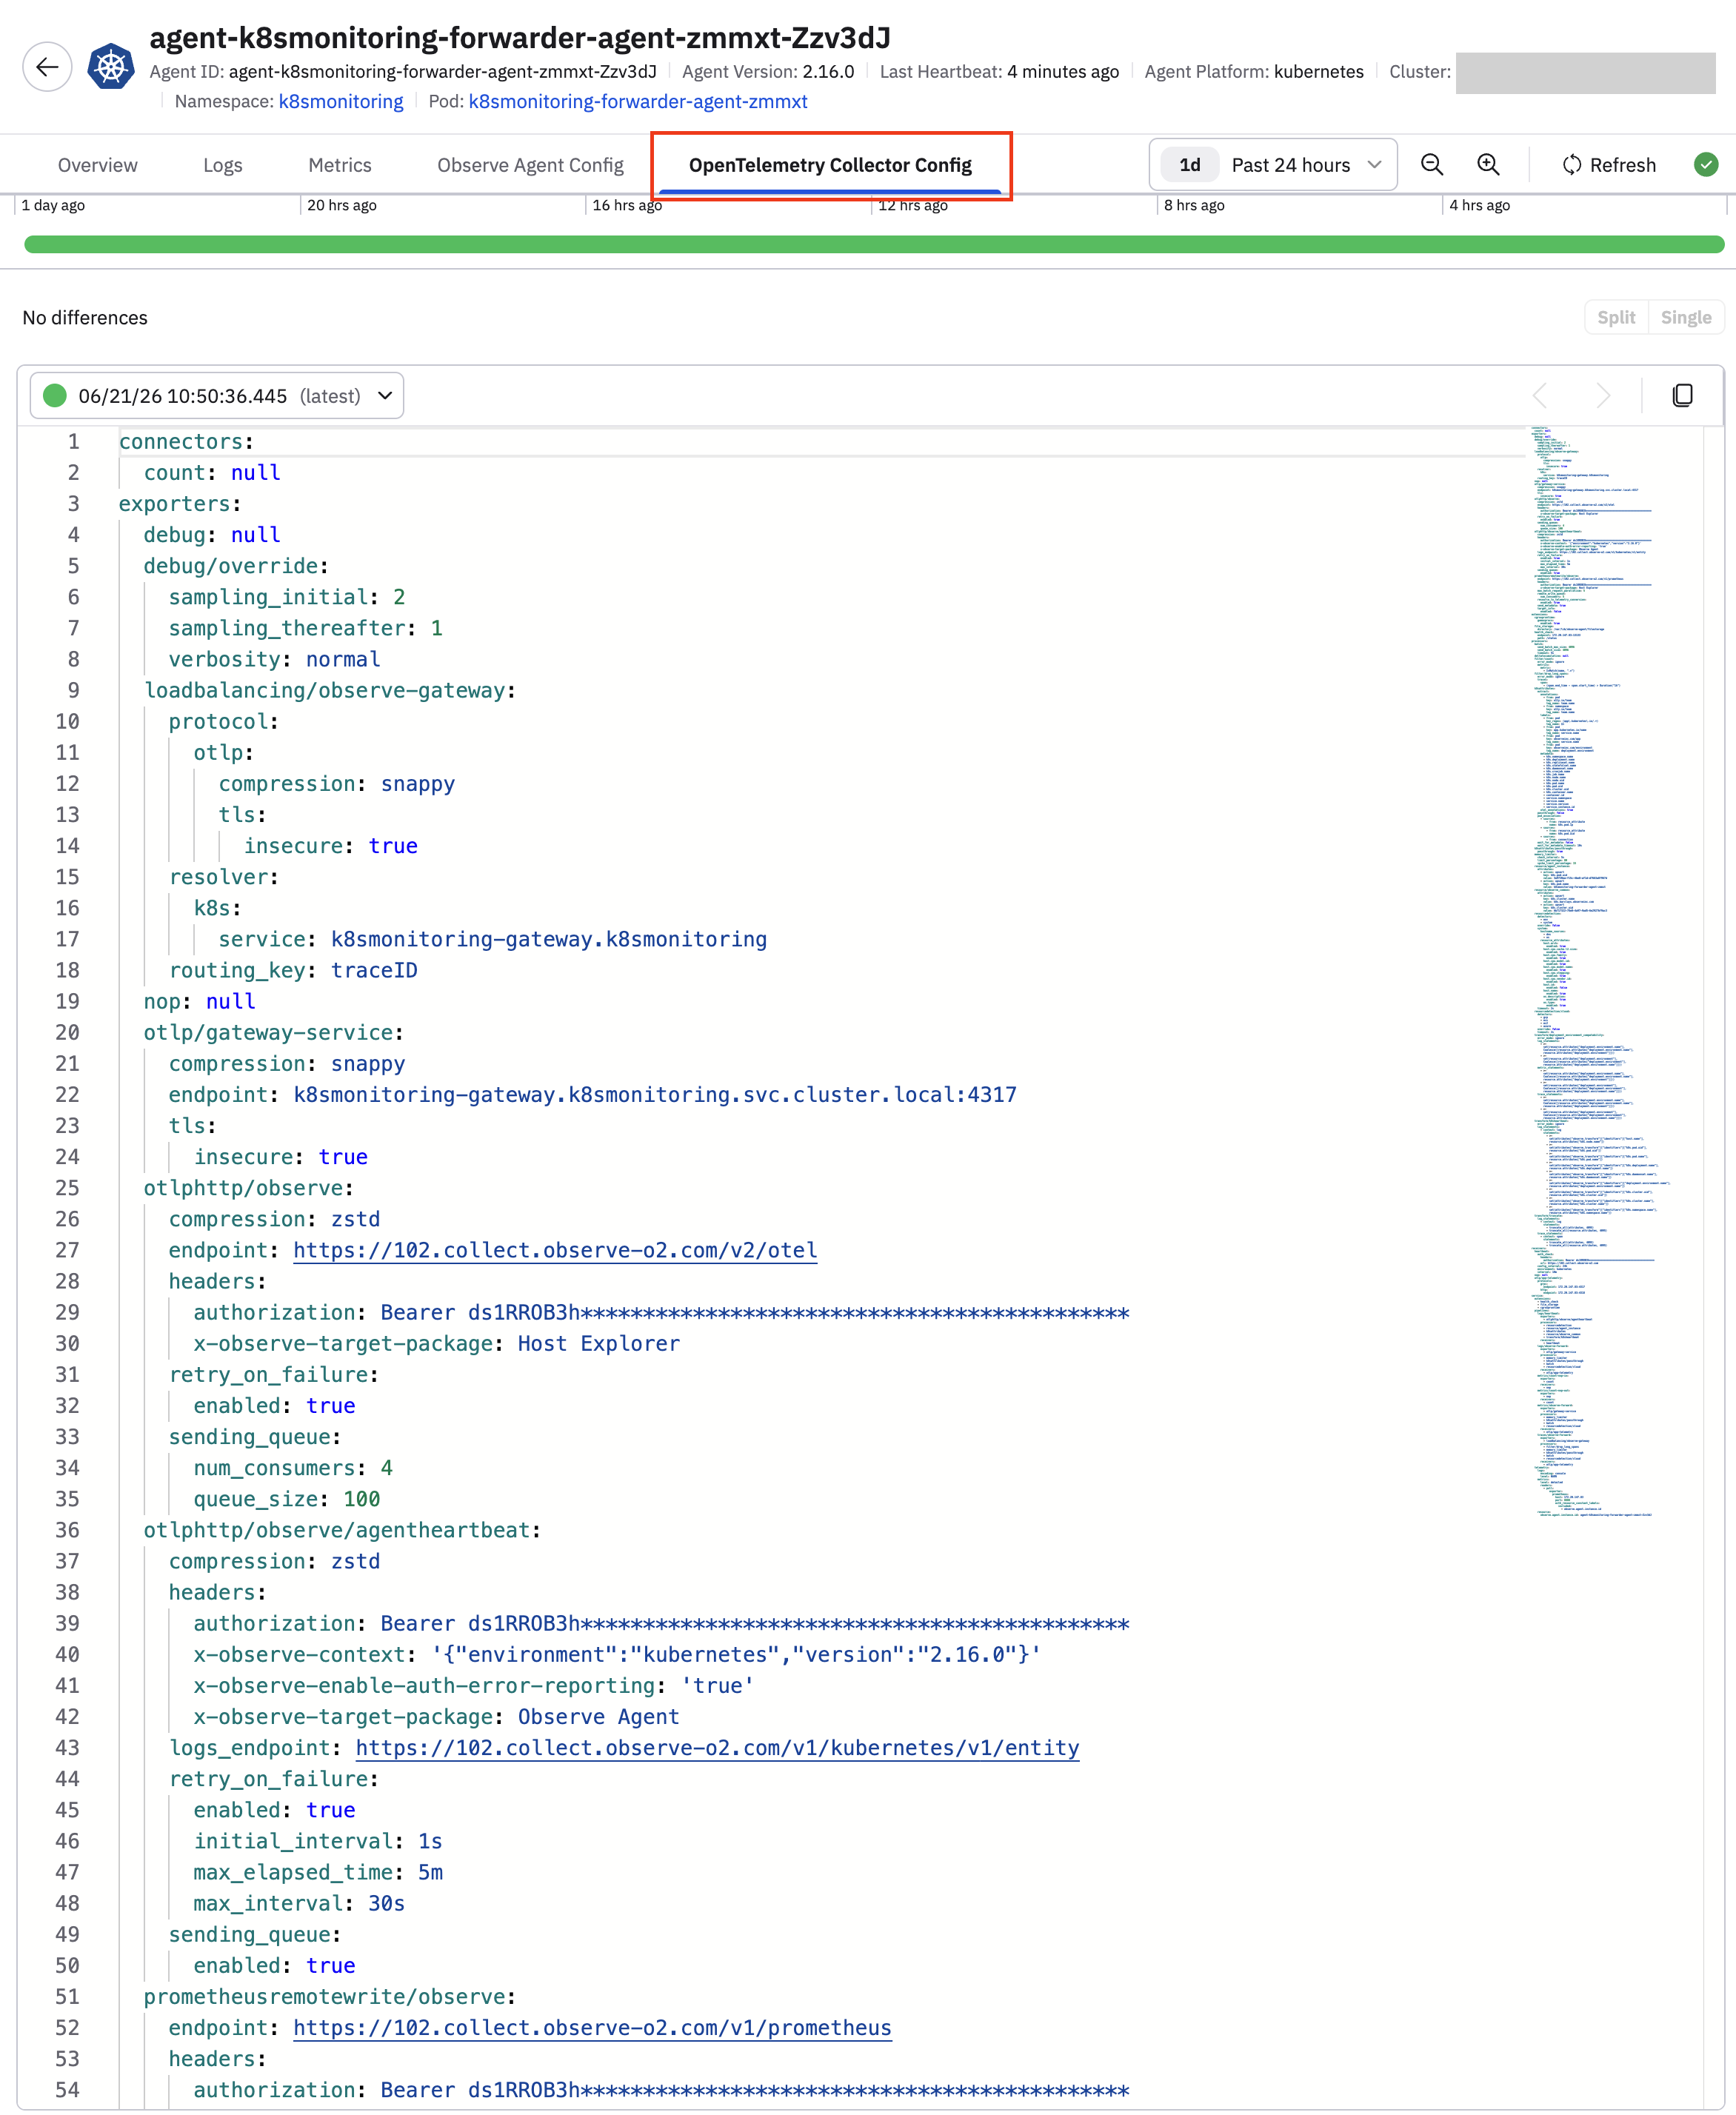
Click on the Opentelemetry Collector Config to view the complete OTel configuration being used for this specific Observe Agent.
Updated 25 days ago