Create a threshold monitor
Threshold monitors allow you to build expressions for monitoring numeric thresholds from metrics, logs, or other types of data. For instance, you might want to monitor CPU usage for an application and receive an alert when it exceeds a specified threshold.
Thresholds are ideal for metrics data, but can be used with any Dataset with a single numeric column presenting a metric value.
You can create a threshold monitor from any Explorer or Worksheet, or from the monitors list.
Create a threshold monitor from an Explorer
Select Actions > Create monitor from the Log Explorer, Metric Explorer, or Trace Explorer to begin creating a new monitor.
Start with a scenario that you want to alert on. For instance, you might do one of the following scenarios:
Metrics Explorer
Below is an example of how to begin creating a threshold monitor from the Metrics Explorer:
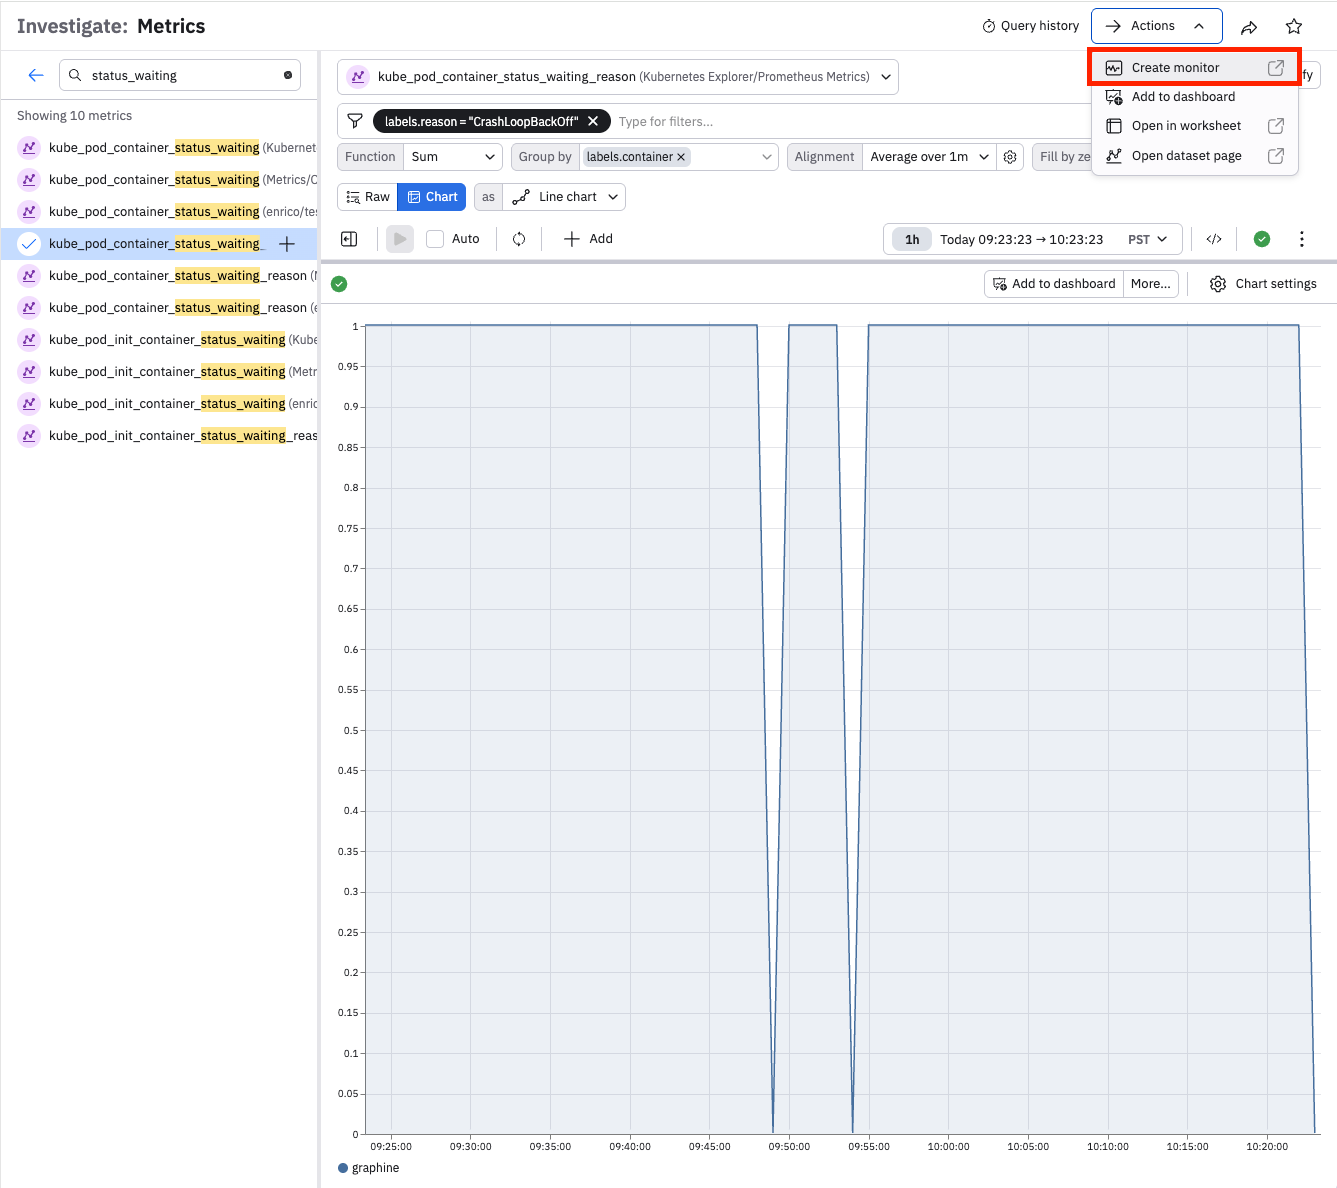
- Open Metrics Explorer from the left navigation rail and select kube_pod_container_status_waiting_reason from Kubernetes Explorer/Prometheus Metrics.
- Use the filter bar to limit the data to labels.reason = CrashLoopBackOff.
- Set the Function to Sum, set the Group by to labels.container, and the Alignment to Average over 1m.
You should now see a chart of Kubernetes containers backing off from crash loop detection, which is ideally a very small number or zero.
To create a Threshold monitor from this data, click Actions > Create monitor in the top right of the Explorer to open the Monitor creation form with a preconfigured input.
Log Explorer
Open Log Explorer from the left navigation rail and select kubernetes/Event. Use the filter bar to limit the data to sourceComponent = "kubelet" and reason = "ProbeWarning". You should now see a list of Kubernetes containers warning that their readiness probes had to be terminated, which is ideally uncommon. The Count column will be used as the threshold metric.
To create a Threshold monitor from this data, click Create a monitor in the top right of the Explorer to open the Monitor creation form with a preconfigured input.
Create a threshold monitor from a Worksheet
Start with a scenario that you want to alert on. For instance, you might have a more complex query for Kubernetes Probe warnings that also looks up the DevOps team responsible and the service names affected. To create a Threshold Monitor, click the ellipses button the top right of the active stage on the left side of the screen, click Create a monitor and Threshold monitor to open the Monitor creation form with a preconfigured input.
See Create monitors and alerts for more details on alerting rules and actions.
Create a threshold monitor from the monitors list
Perform the following steps to begin creating a new threshold monitor from the monitors list:
- In the left navigation rail, click Monitoring.
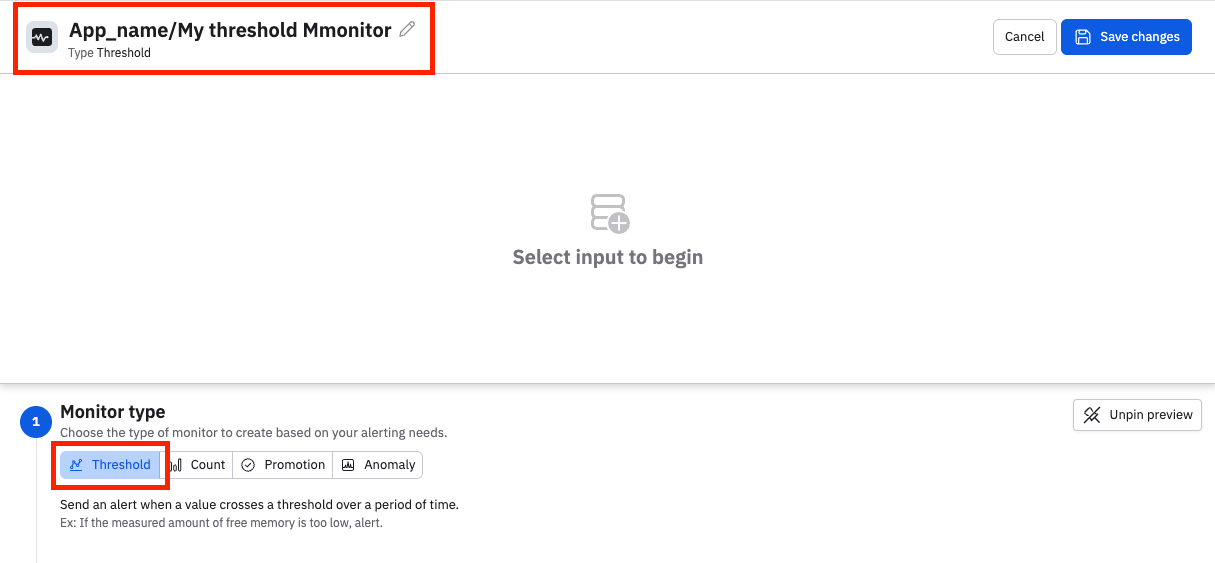
- Click the Threshold panel.
The monitor type is automatically set to Threshold. Before you continue, give the monitor a name that is unique within the instance. You can prepend a name with an App name and a slash for organizational purposes. For example:
Continue by building the query for the monitor. No matter how you've started to build your threshold monitor, the flow is the same to proceed.
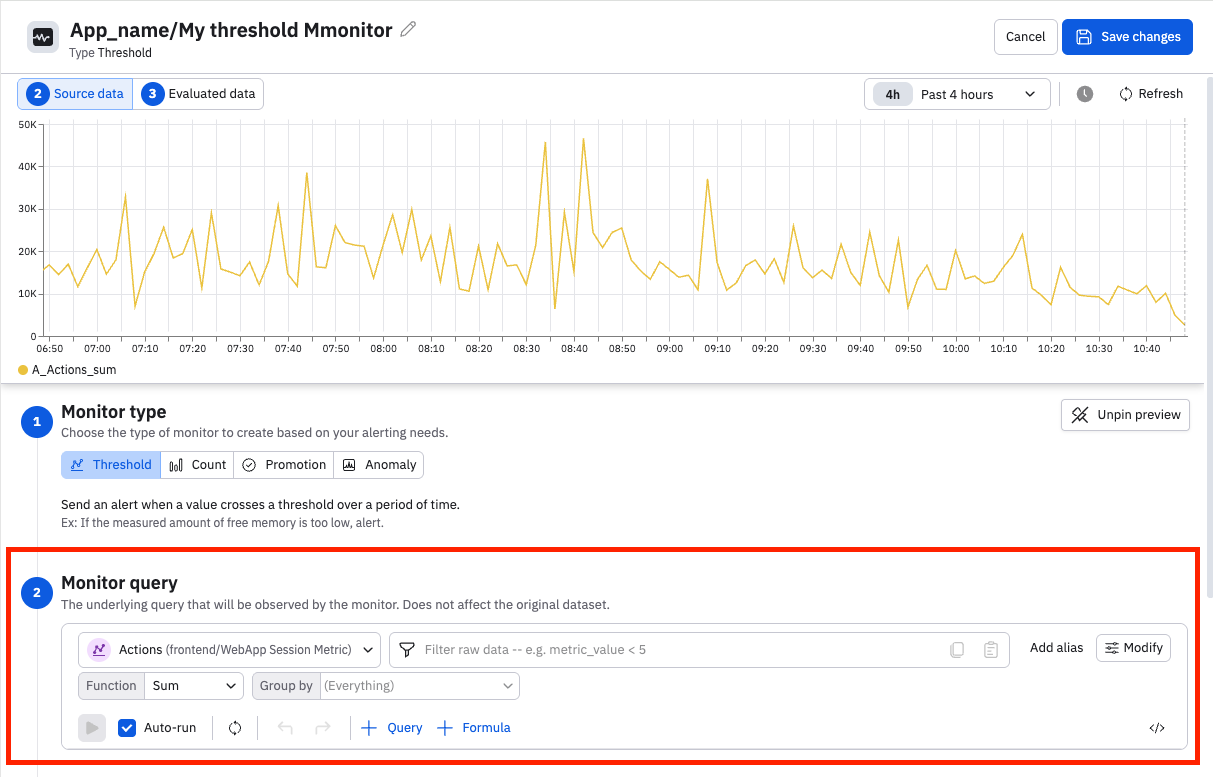
Monitor query
Review or build the monitor query to ensure that it's gathering the data you intend to monitor. Use the time selector to adjust the desired window of time. You have access to the entire set of Observe data manipulation tools: adjust the visualization type, use filters to trim it, and add queries or formulas to enrich the monitor.
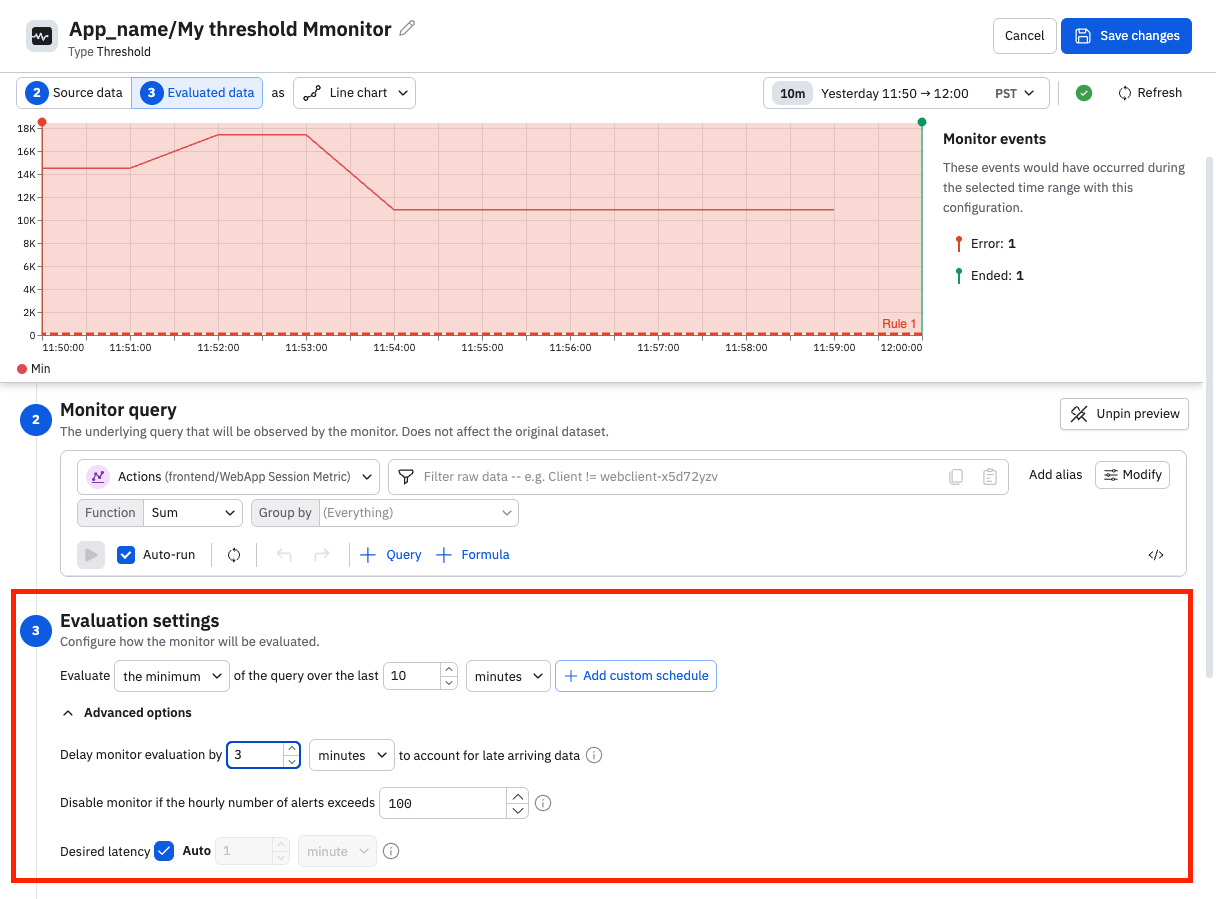
Evaluation settings
Configure the settings to determine how this monitor evaluates the data coming in.
Begin by selecting how you want the query results to be evaluated. Select the desired evaluation method (sum, average, minimum, or maximum) and the desired time window. Click Add custom schedule to create a schedule for this monitor. See Scheduled monitoring.
Open the advanced options to configure a stabilization delay, latency settings, or disable the monitor under certain conditions.
Stabilization delay
Data in observability pipelines doesn't arrive instantly. Logs, metrics, and traces from different sources can have varying ingestion latencies — some data arrives in seconds, while other data may take minutes to appear. At any given moment, the most recent window of data is likely incomplete because some of it is still in transit. This incomplete zone is known as the ragged right edge.
If a monitor evaluates data in this zone, it can produce unreliable results:
- False positives — alerting because a metric appears anomalous when in reality the data just hasn't fully arrived yet.
- False negatives — missing a real problem because the data that would reveal it hasn't been ingested yet.
- Flapping alerts — alerts that rapidly fire and resolve as late-arriving data changes previously evaluated results.
The stabilization delay (sometimes called "evaluation delay") controls how long a monitor waits before evaluating data, giving late-arriving data time to be fully ingested and processed. By default, monitors use a stabilization delay of 3 minutes. You can configure this value per monitor, including setting it to 0 if your data sources have very low and predictable latency.
As a rule of thumb, set the stabilization delay to be 1.5 times longer than the worst-case ingestion latency of your data source. A longer delay produces more accurate alerts at the cost of slightly slower detection. A shorter delay means faster detection but increases the risk of false alerts from incomplete data.
Disable the monitor
You can disable the monitor if the hourly number of alerts exceeds a specified number.
Desired latency
Desired latency is how quickly the monitor responds to new data. The default is auto, where an efficient latency is selected for you, based on your query.
Rules
You can construct multiple rules in a monitor, using conditional tests from the data to set a severity level. The preview panel will update in real time so you can review where your rules are matching.
Threshold monitors accept rules based on the count of rows within the sliding evaluation window. Given a ten minute window, if the count matches the condition in a rule at any point the rule will trigger and an alert will be created.
To further constrain matches or set severity by grouped values in your data, click "For any group" and select a grouped value. For instance if you are grouping by an Alarm ID, select "Alarm ID", choose "equal to" or "not equal to", and enter an Alarm ID.
Description
Use the Monitor description field as a free form text entry to inform users, link runbooks, or tag monitors. You can search Monitors or alerts by the contents of this field.
Notification actions
Once an alert is created, notifications can happen. If no notification is configured, the alert will still be visible in monitoring logs and Alert Explorer.
Observe supports Email, Slack, PagerDuty, and generic Webhook actions. For each action, use the Conditions area to select the matching severities that will trigger this action. For instance, you might use Slack for a Warning, but PagerDuty for a Critical.
All actions can use Observe's extended Mustache formatting to refer to data. See Customize alert messages for details.
Actions can send reminders on a periodic basis; this can be useful for Slack or Email to larger teams. Click Send Reminders beneath the action to select a time frame, such as "1 day". Mustache variables can be used to control these alternate behaviors.
Actions can send end notifications, which is frequently used to close a ticket in a receiving system such as PagerDuty or OpsGenie. Click Send an update when the monitor has stopped triggering beneath the action to enable this. Mustache variables can be used to control these alternate behaviors.
Once configured, an action can be shared with your team members as a Saved Action, by clicking Share action with team in the title row. See Configure shared actions for more information.
Sample Values
When a threshold monitor produces an alert, it is useful to know how much the threshold was breached by. Observe will include a representative sample value from the breaching data.
Updated 19 days ago