View MongoDB Atlas data in Observe
When you install the MongoDB Atlas app, the following dashboards are installed by default:
- MongoDB Atlas/Home
- MongoDB Atlas/Monitoring
- MongoDB Atlas/Performance
MongoDB Atlas/Home Dashboard
The MongoDB Atlas/Home dashboard provides a high-level overview of your organizational output, with information on the following activity:
- Clusters
- Metric Highlights
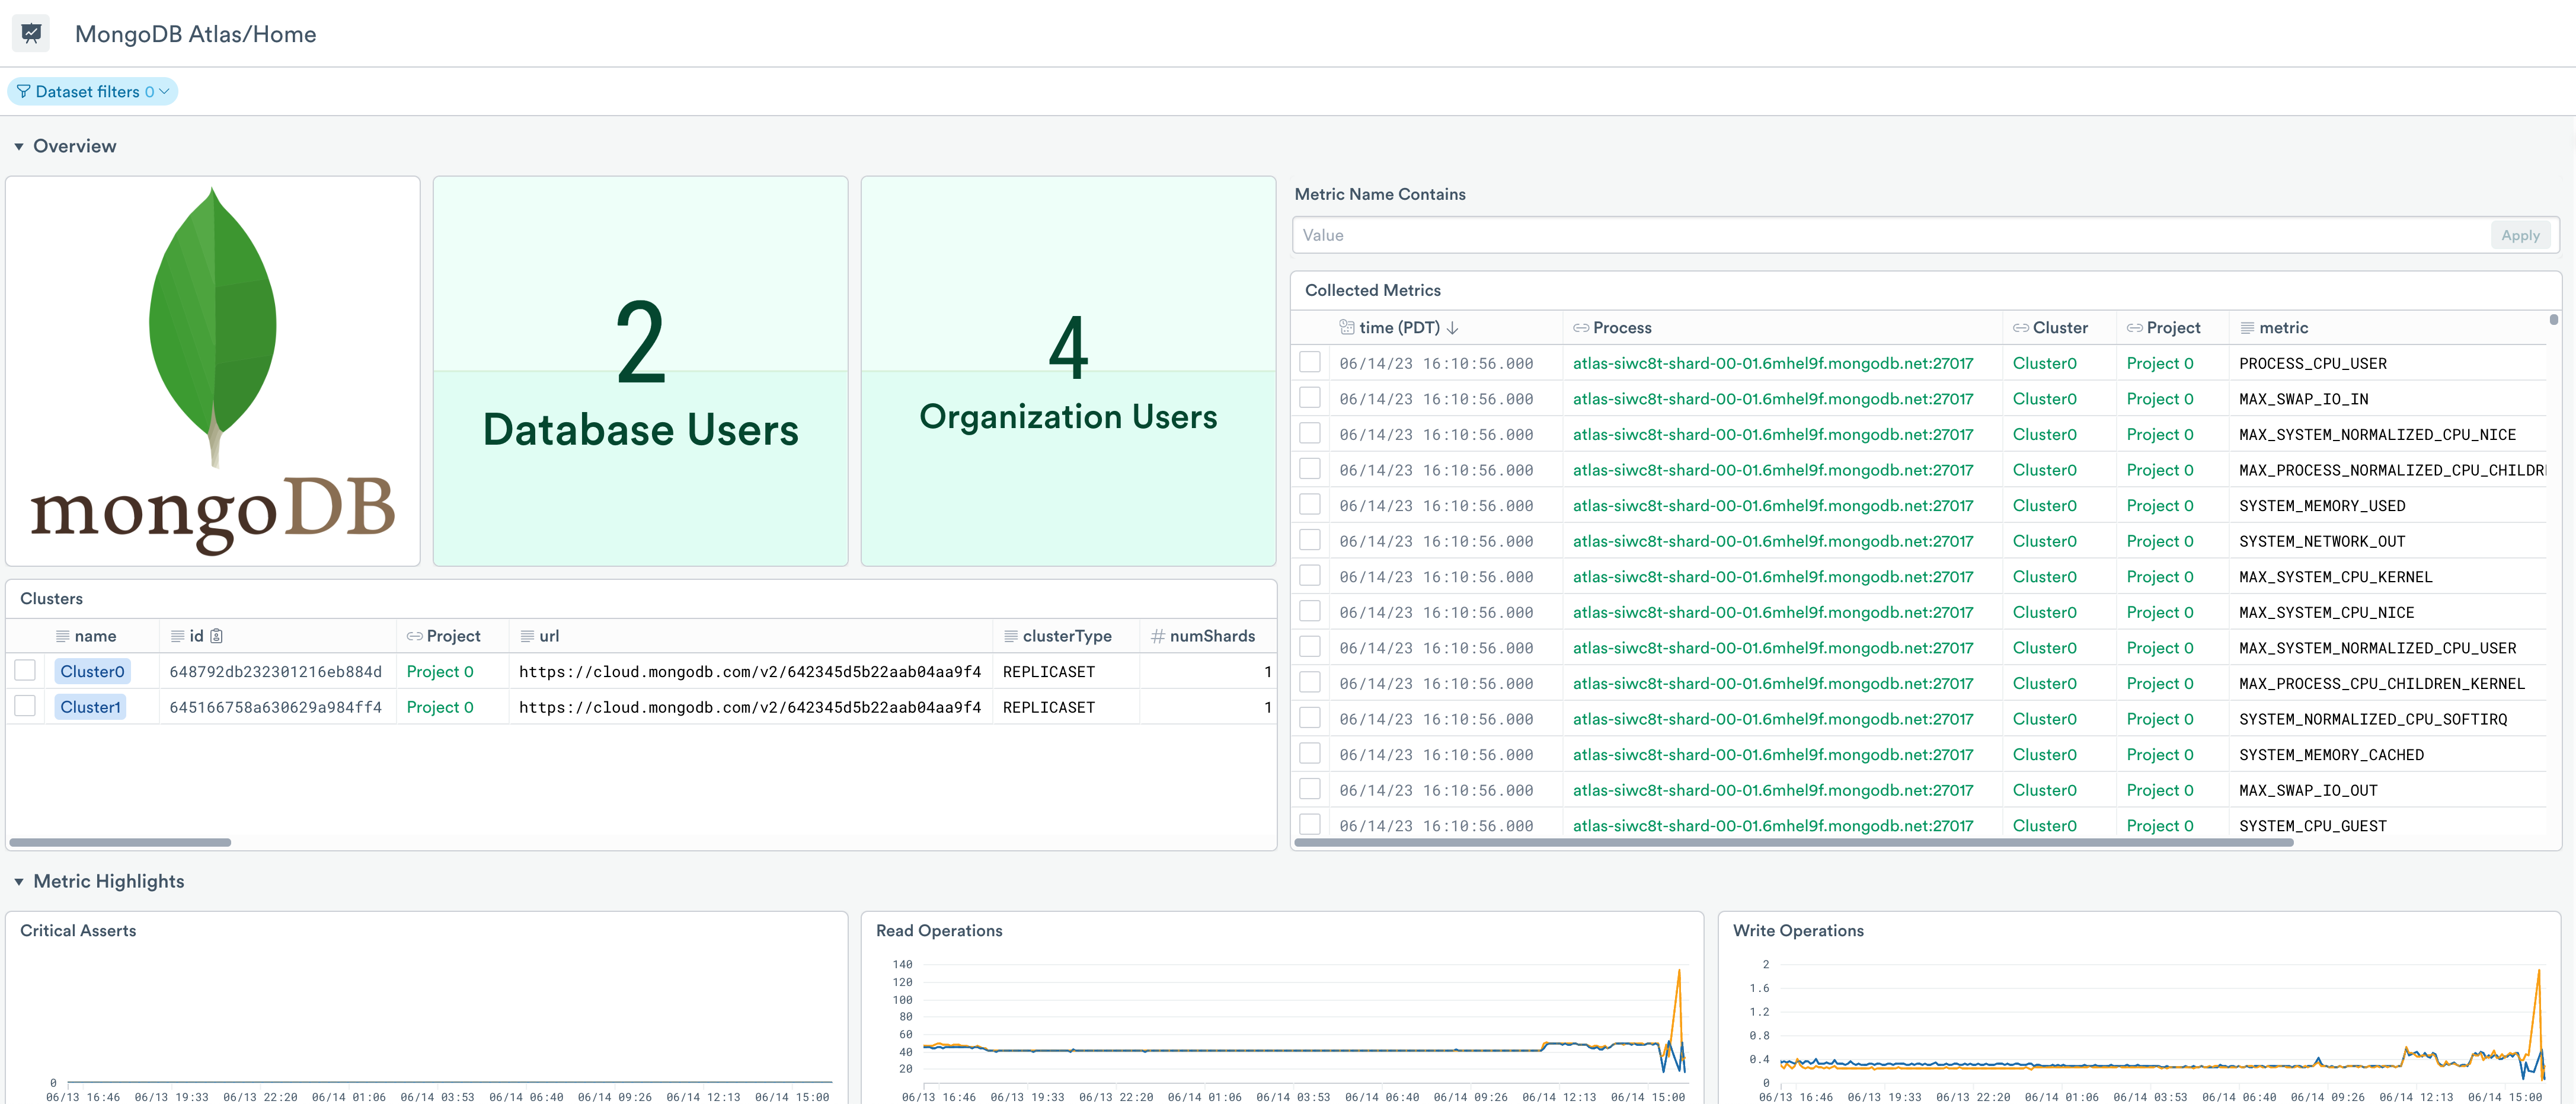
Use the dashboard for debugging and troubleshooting as well as viewing the activity in your MongoDB organization within a time window. Use it to answer questions such as:
- How many clusters are in my organization? What is their state and relevant metadata?
- What are the recently collected metrics? Which processes are active?
- What are some metric highlights as it related to a cluster? Are any clusters facing issues in operations, connections, etc?
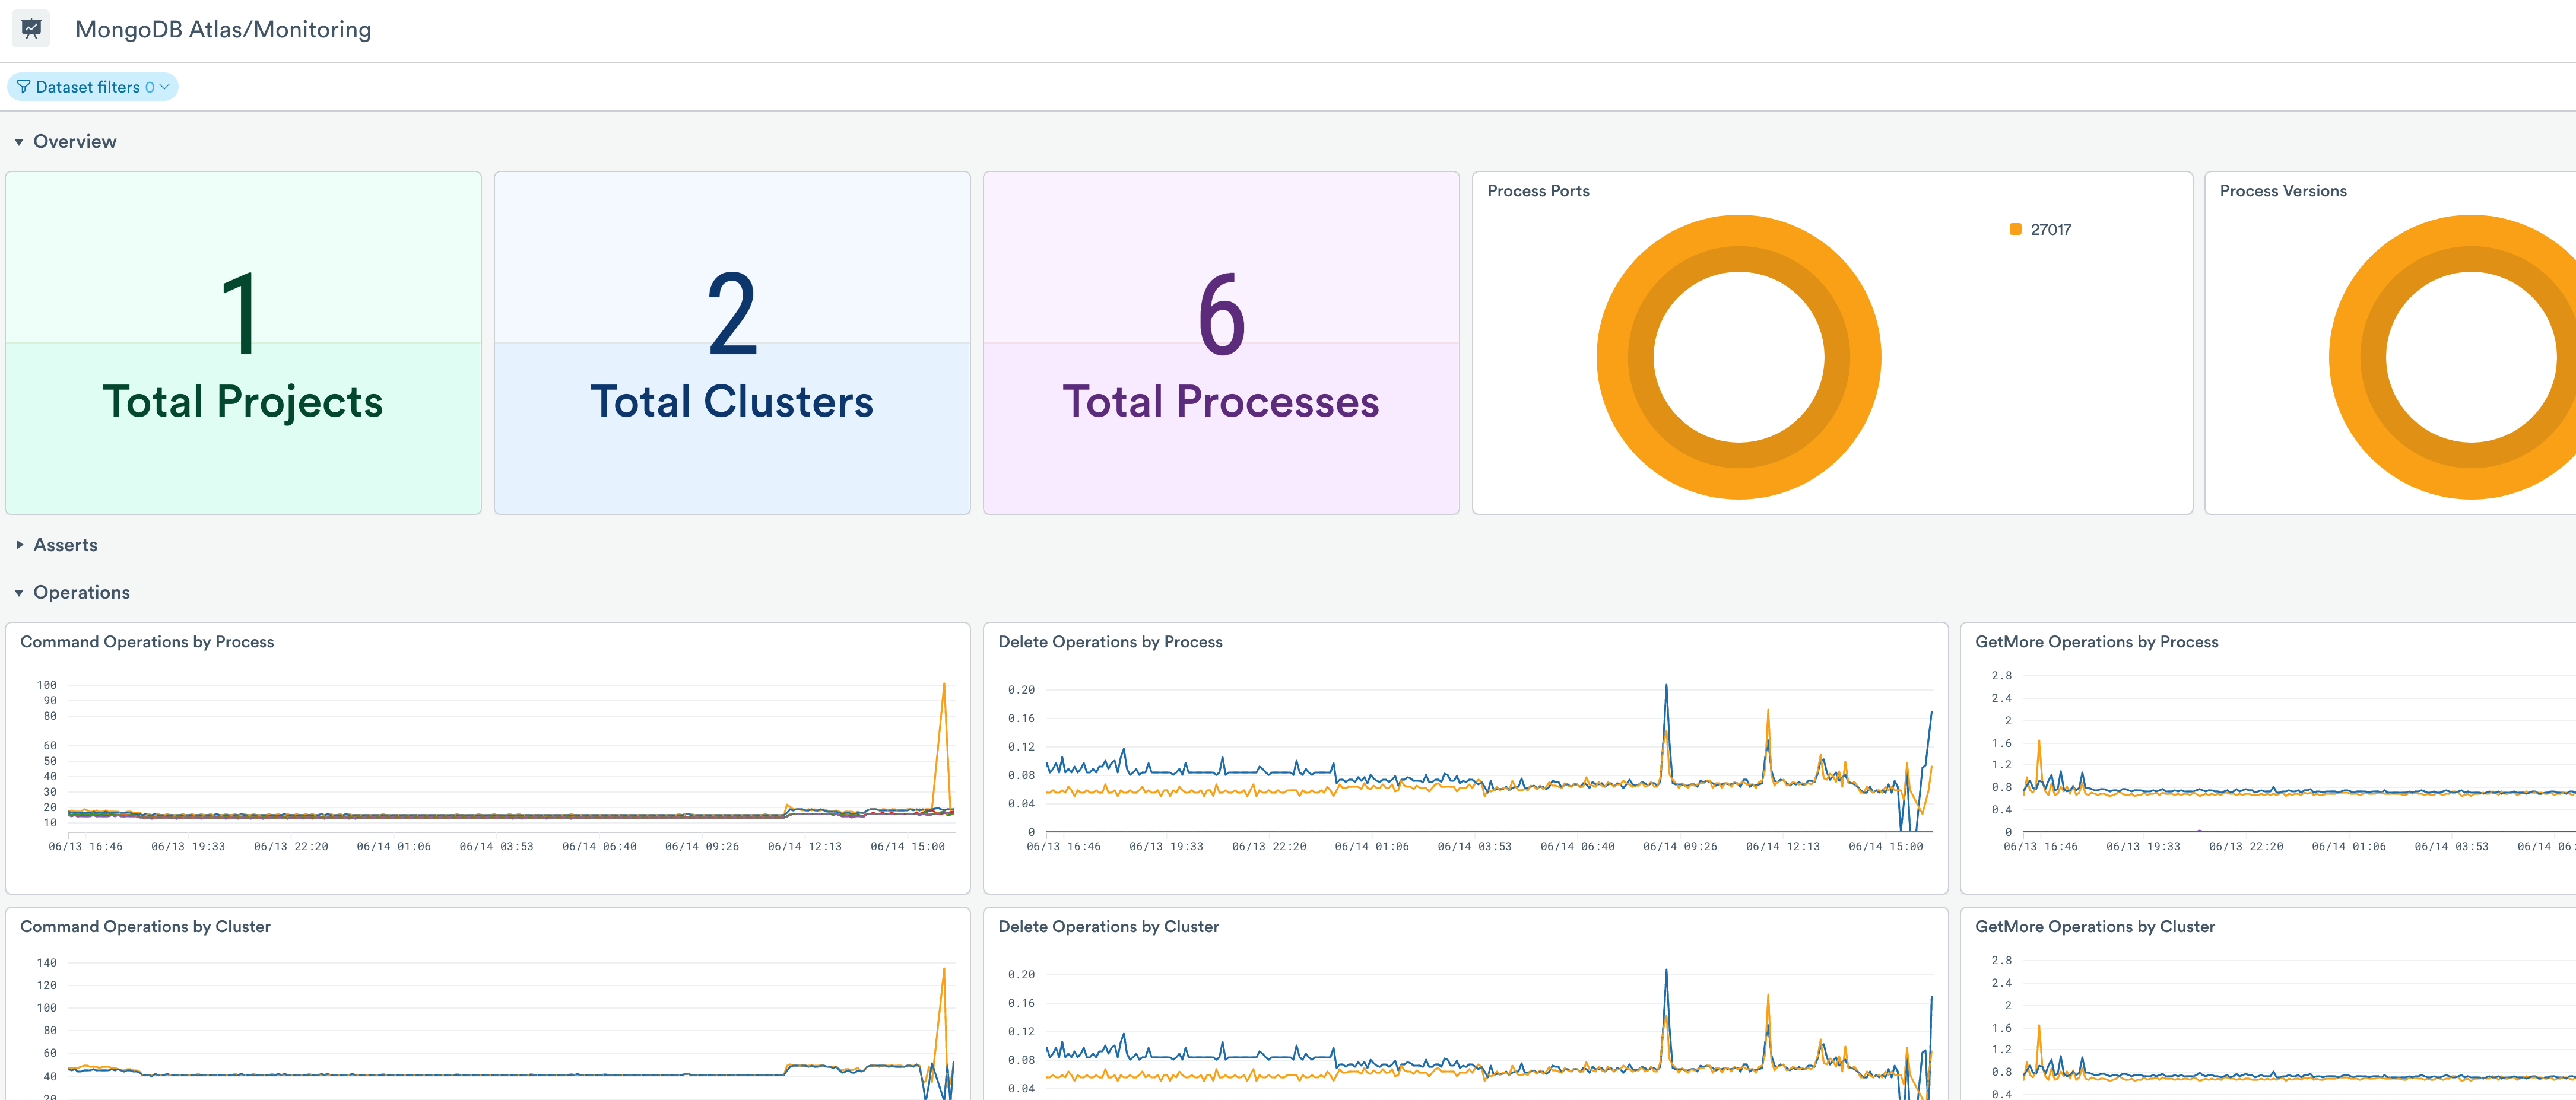
MongoDB Atlas/Monitoring Dashboard
The MongoDB Atlas/Monitoring dashboard provides a summarized view of the operations of your MongoDB Atlas clusters and processes:
- Asserts
- Operations
- Connection Availability
Switch to other dashboards to get a more detailed view of this data.
MongoDB Atlas/Performance Dashboard
The MongoDB Atlas/Performance dashboard provides a deeper view into the MongoDB engine and host performance underlying your database queries.
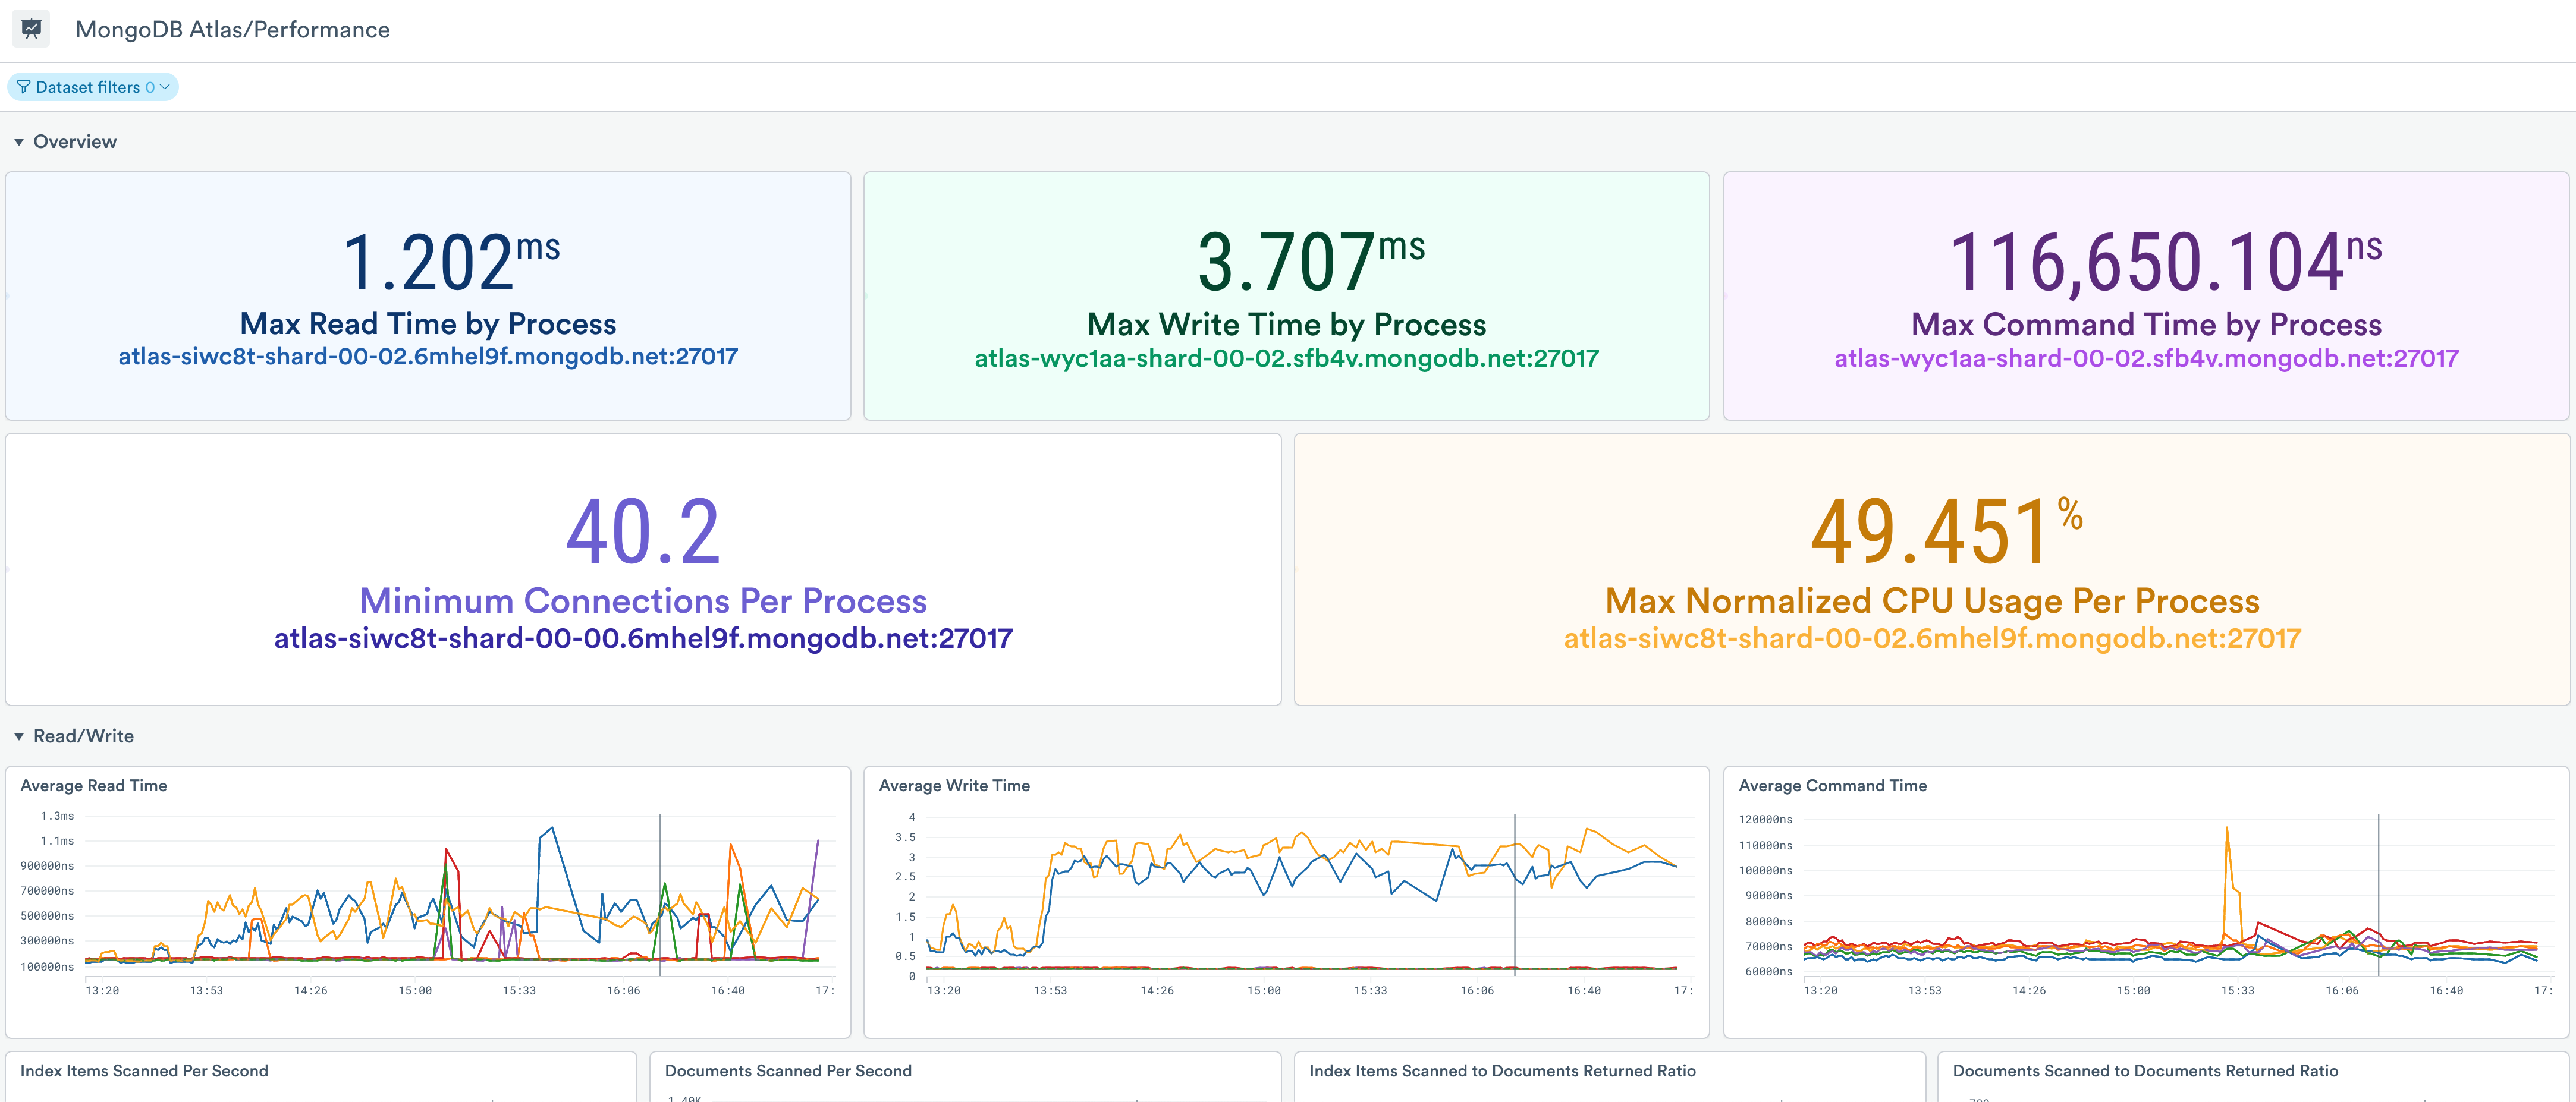
Use this dashboard to get a more detailed view of the operations of your MongoDB Atlas processes:
- Read/Write statistics
- Networking metrics
- CPU and memory metrics
- Storage metrics
- Cache metrics
Updated 9 months ago