Kubernetes visibility
Kubernetes Explorer enables you to monitor both the current and historical state of Kubernetes components such as pods, deployments, and workloads in a specific cluster or namespace. Teams can quickly visualize infrastructure utilization and create plans to improve efficiency. Kubernetes Explorer also surfaces release insights through YAML descriptors, providing teams with a clear understanding of what is deployed and what has changed between rollouts.
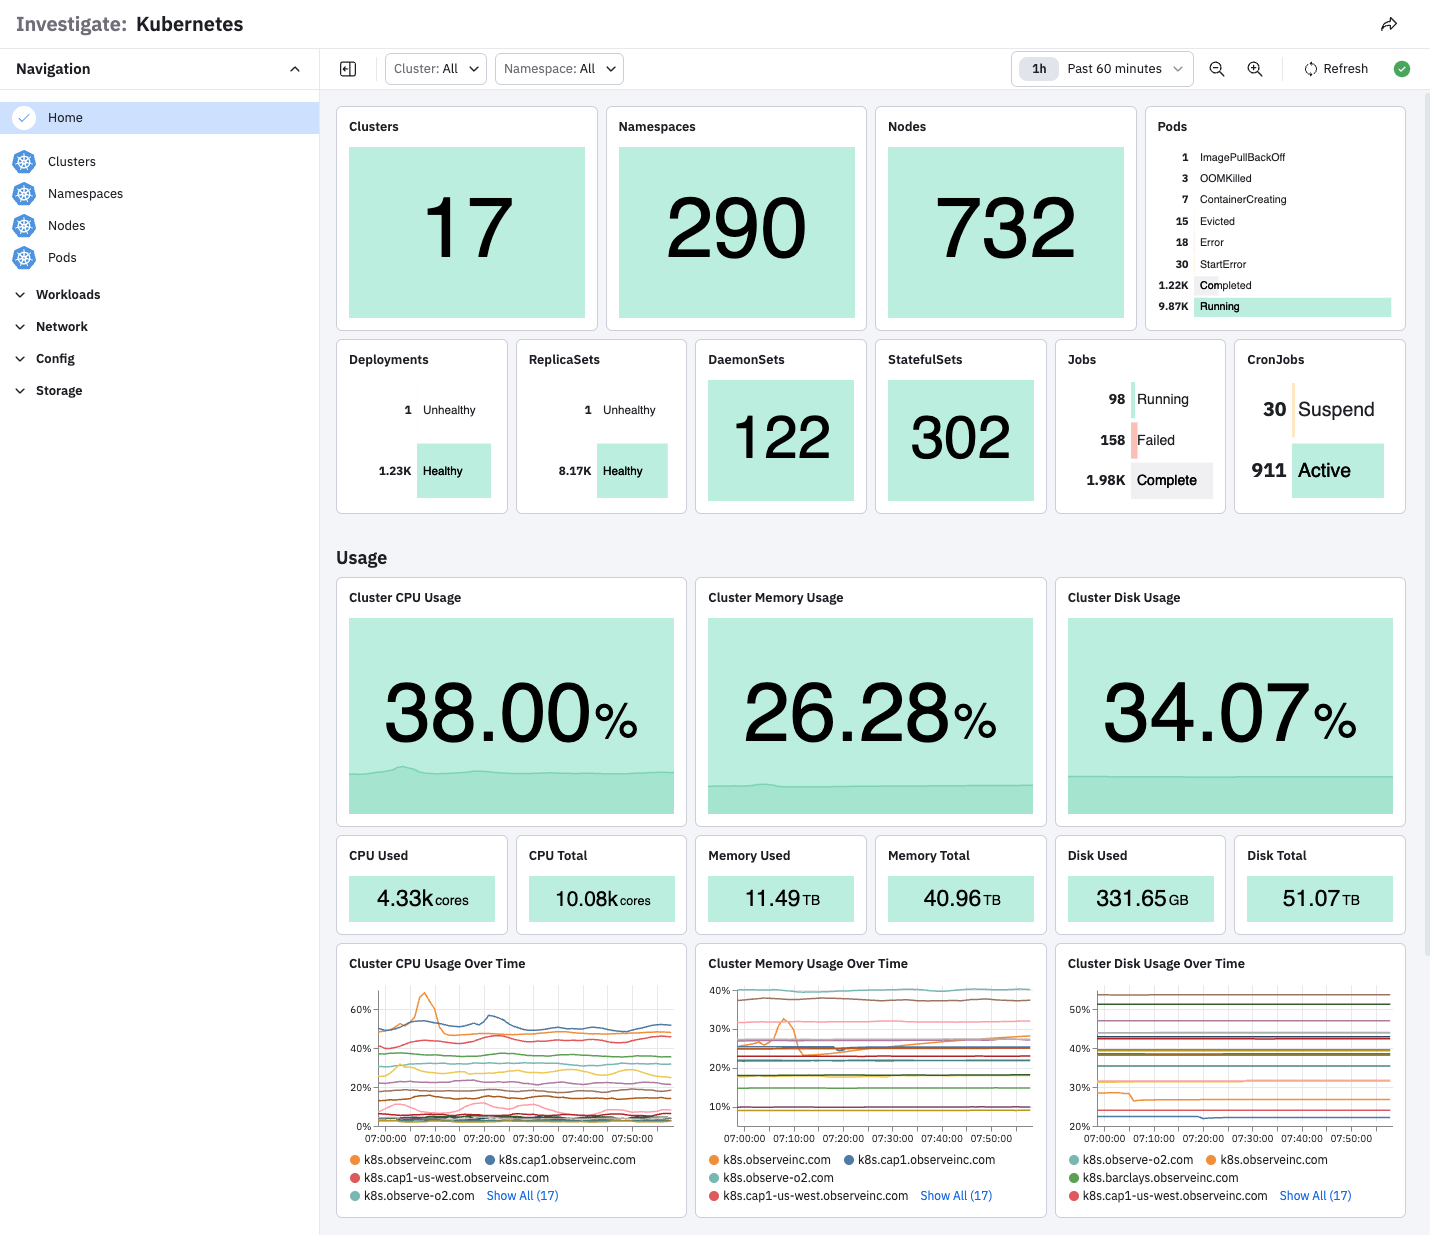
Kubernetes Explorer Home page
To access the Kubernetes Explorer, click Kubernetes in the left navigation rail in Observe.
The Home page provides an inventory of all Kubernetes deployments and health across all clusters reporting telemetry data.
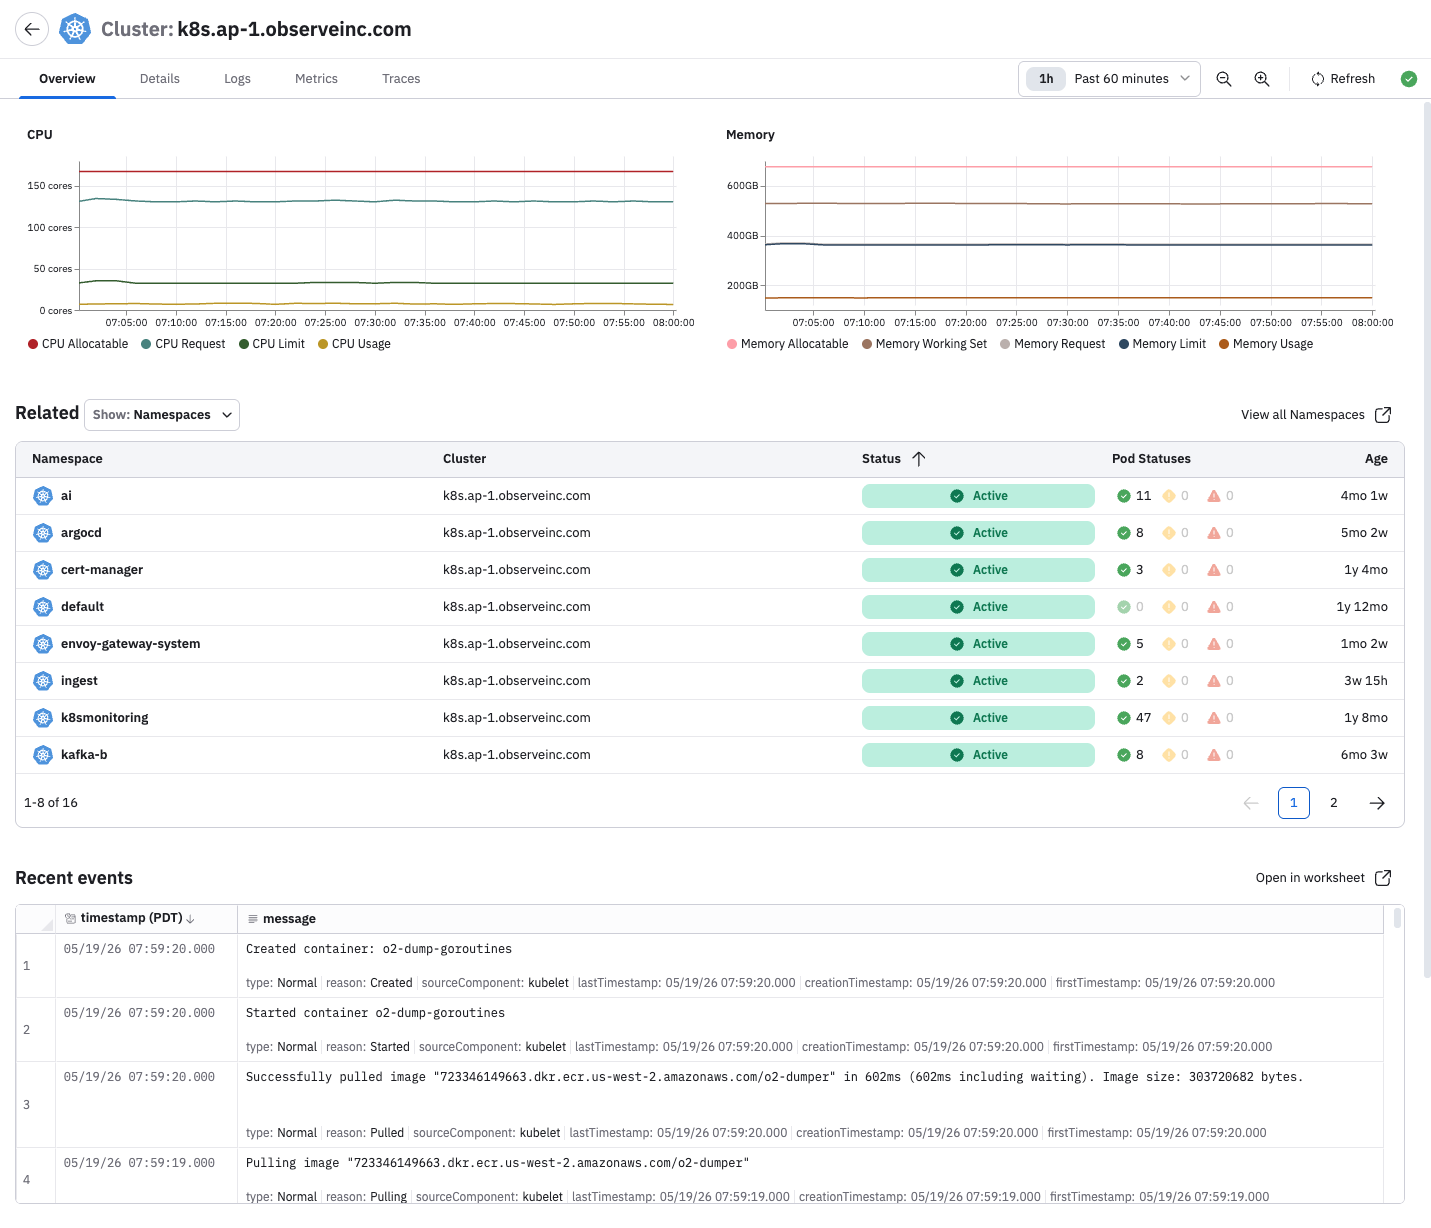
View cluster details
Click Clusters to view a list of clusters, then click a cluster name to drill down to a specific cluster or namespace by selecting the appropriate value from the top dropdown list.
When visualizing a specific cluster, its landing page lists CPU and memory metrics along with related components deployed in that cluster.
You can click on the drop-down list in the Related field and view any component in the cluster, such as Deployments, Nodes, Pods, and Jobs.
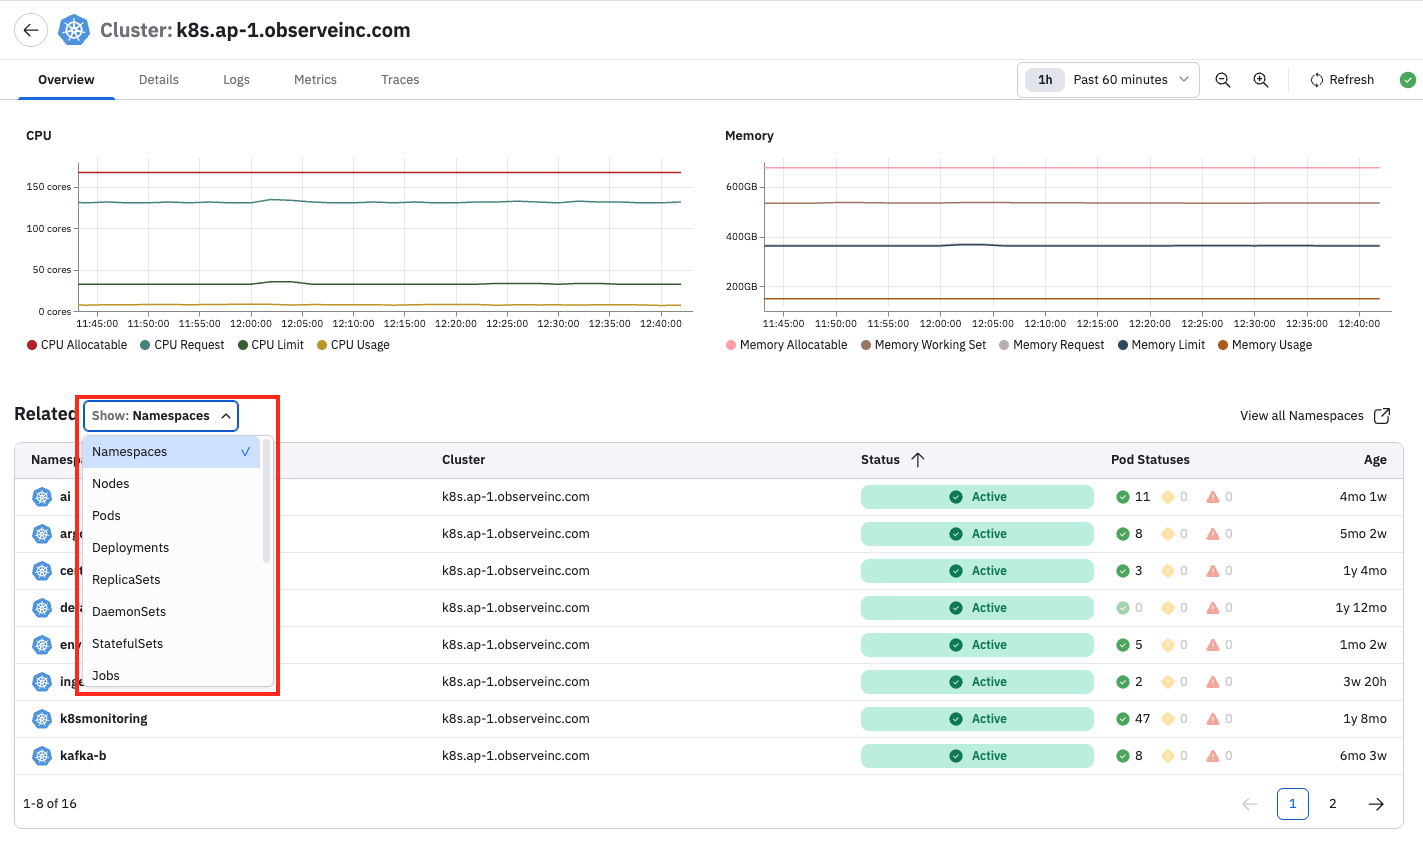
For example, we can select Deployments, the click View all Deployments.
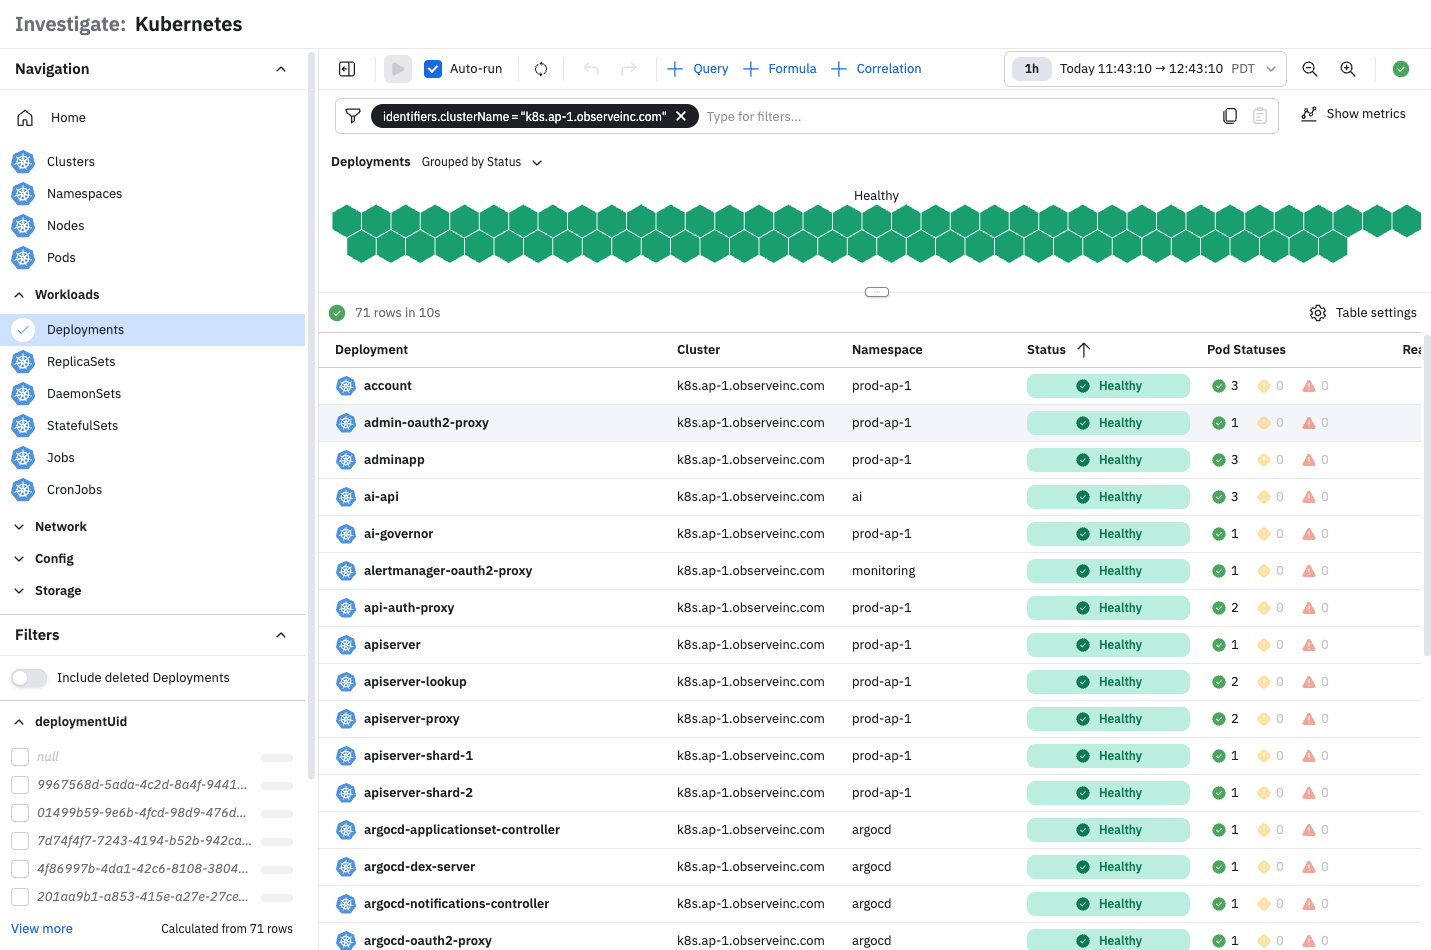
The lister page includes a Cluster Map to easily visualize the health and status of the component, as well as a data table to quickly access relevant information such as name, status, pod status, availability, age, and infrastructure utilization.
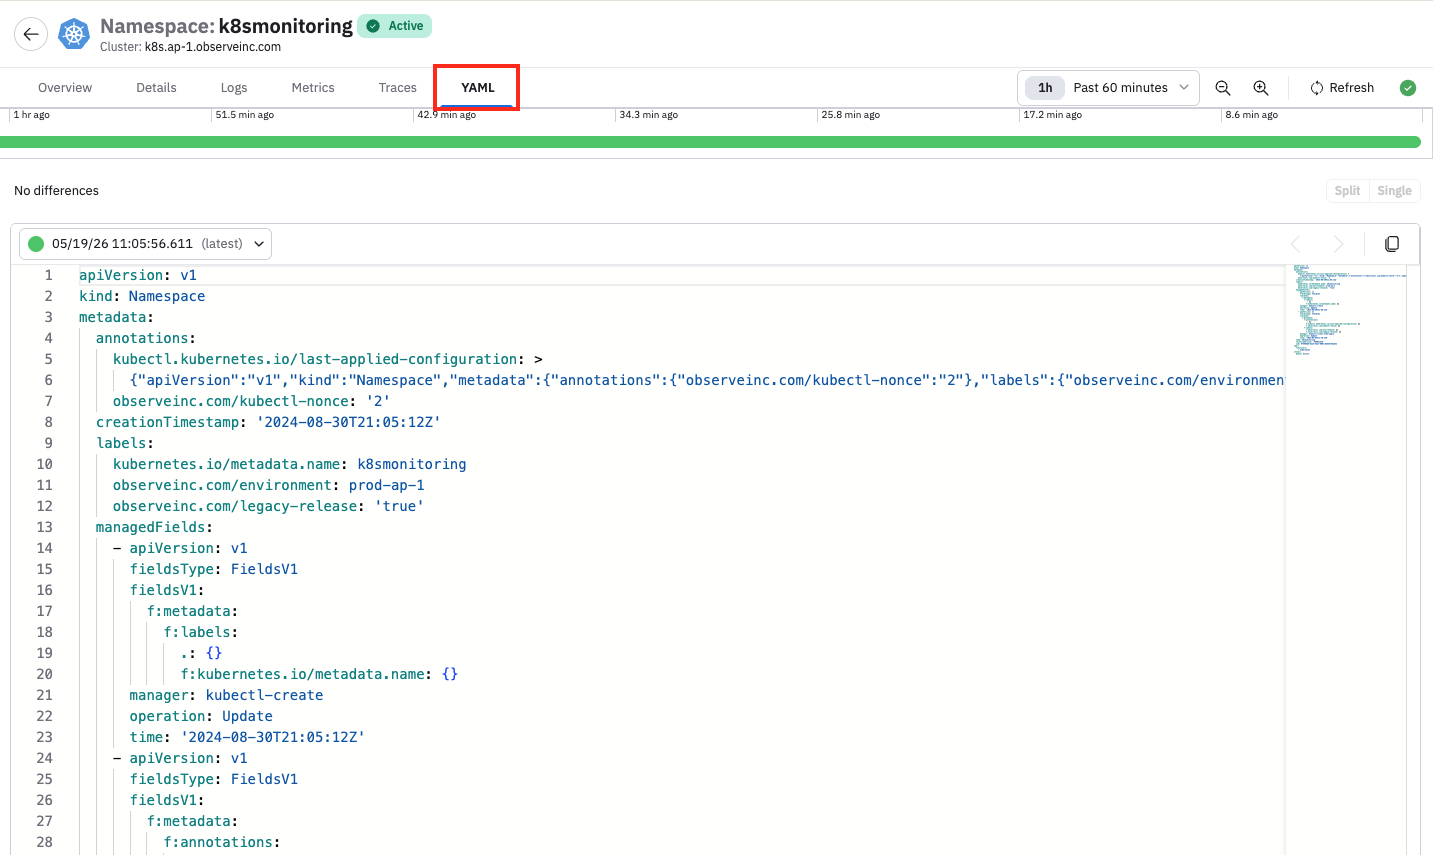
YAML descriptors
The YAML tab on the details page displays the resource definition and various versions of the YAML descriptors. You can visually compare changes made over time and between different versions. The time shown in the dropdown represents the approximate moment when changes were applied to the resource.
Updated 2 months ago