Azure resource configuration
To capture logs and metrics of most resources, you must add diagnostic settings. Click on the desired Azure service name for instructions on adding diagnostic settings.
- Azure Active Directory (AD)
- Azure Kubernetes Services (AKS)
- Azure App Services
- Azure Cognitive Services
- Azure Functions
- Azure SQL Database
- Azure SQL Managed Instances
- Azure Storage Account
- Azure Virtual Machines
- Create diagnostic settings at scale
Active Directory (AD)
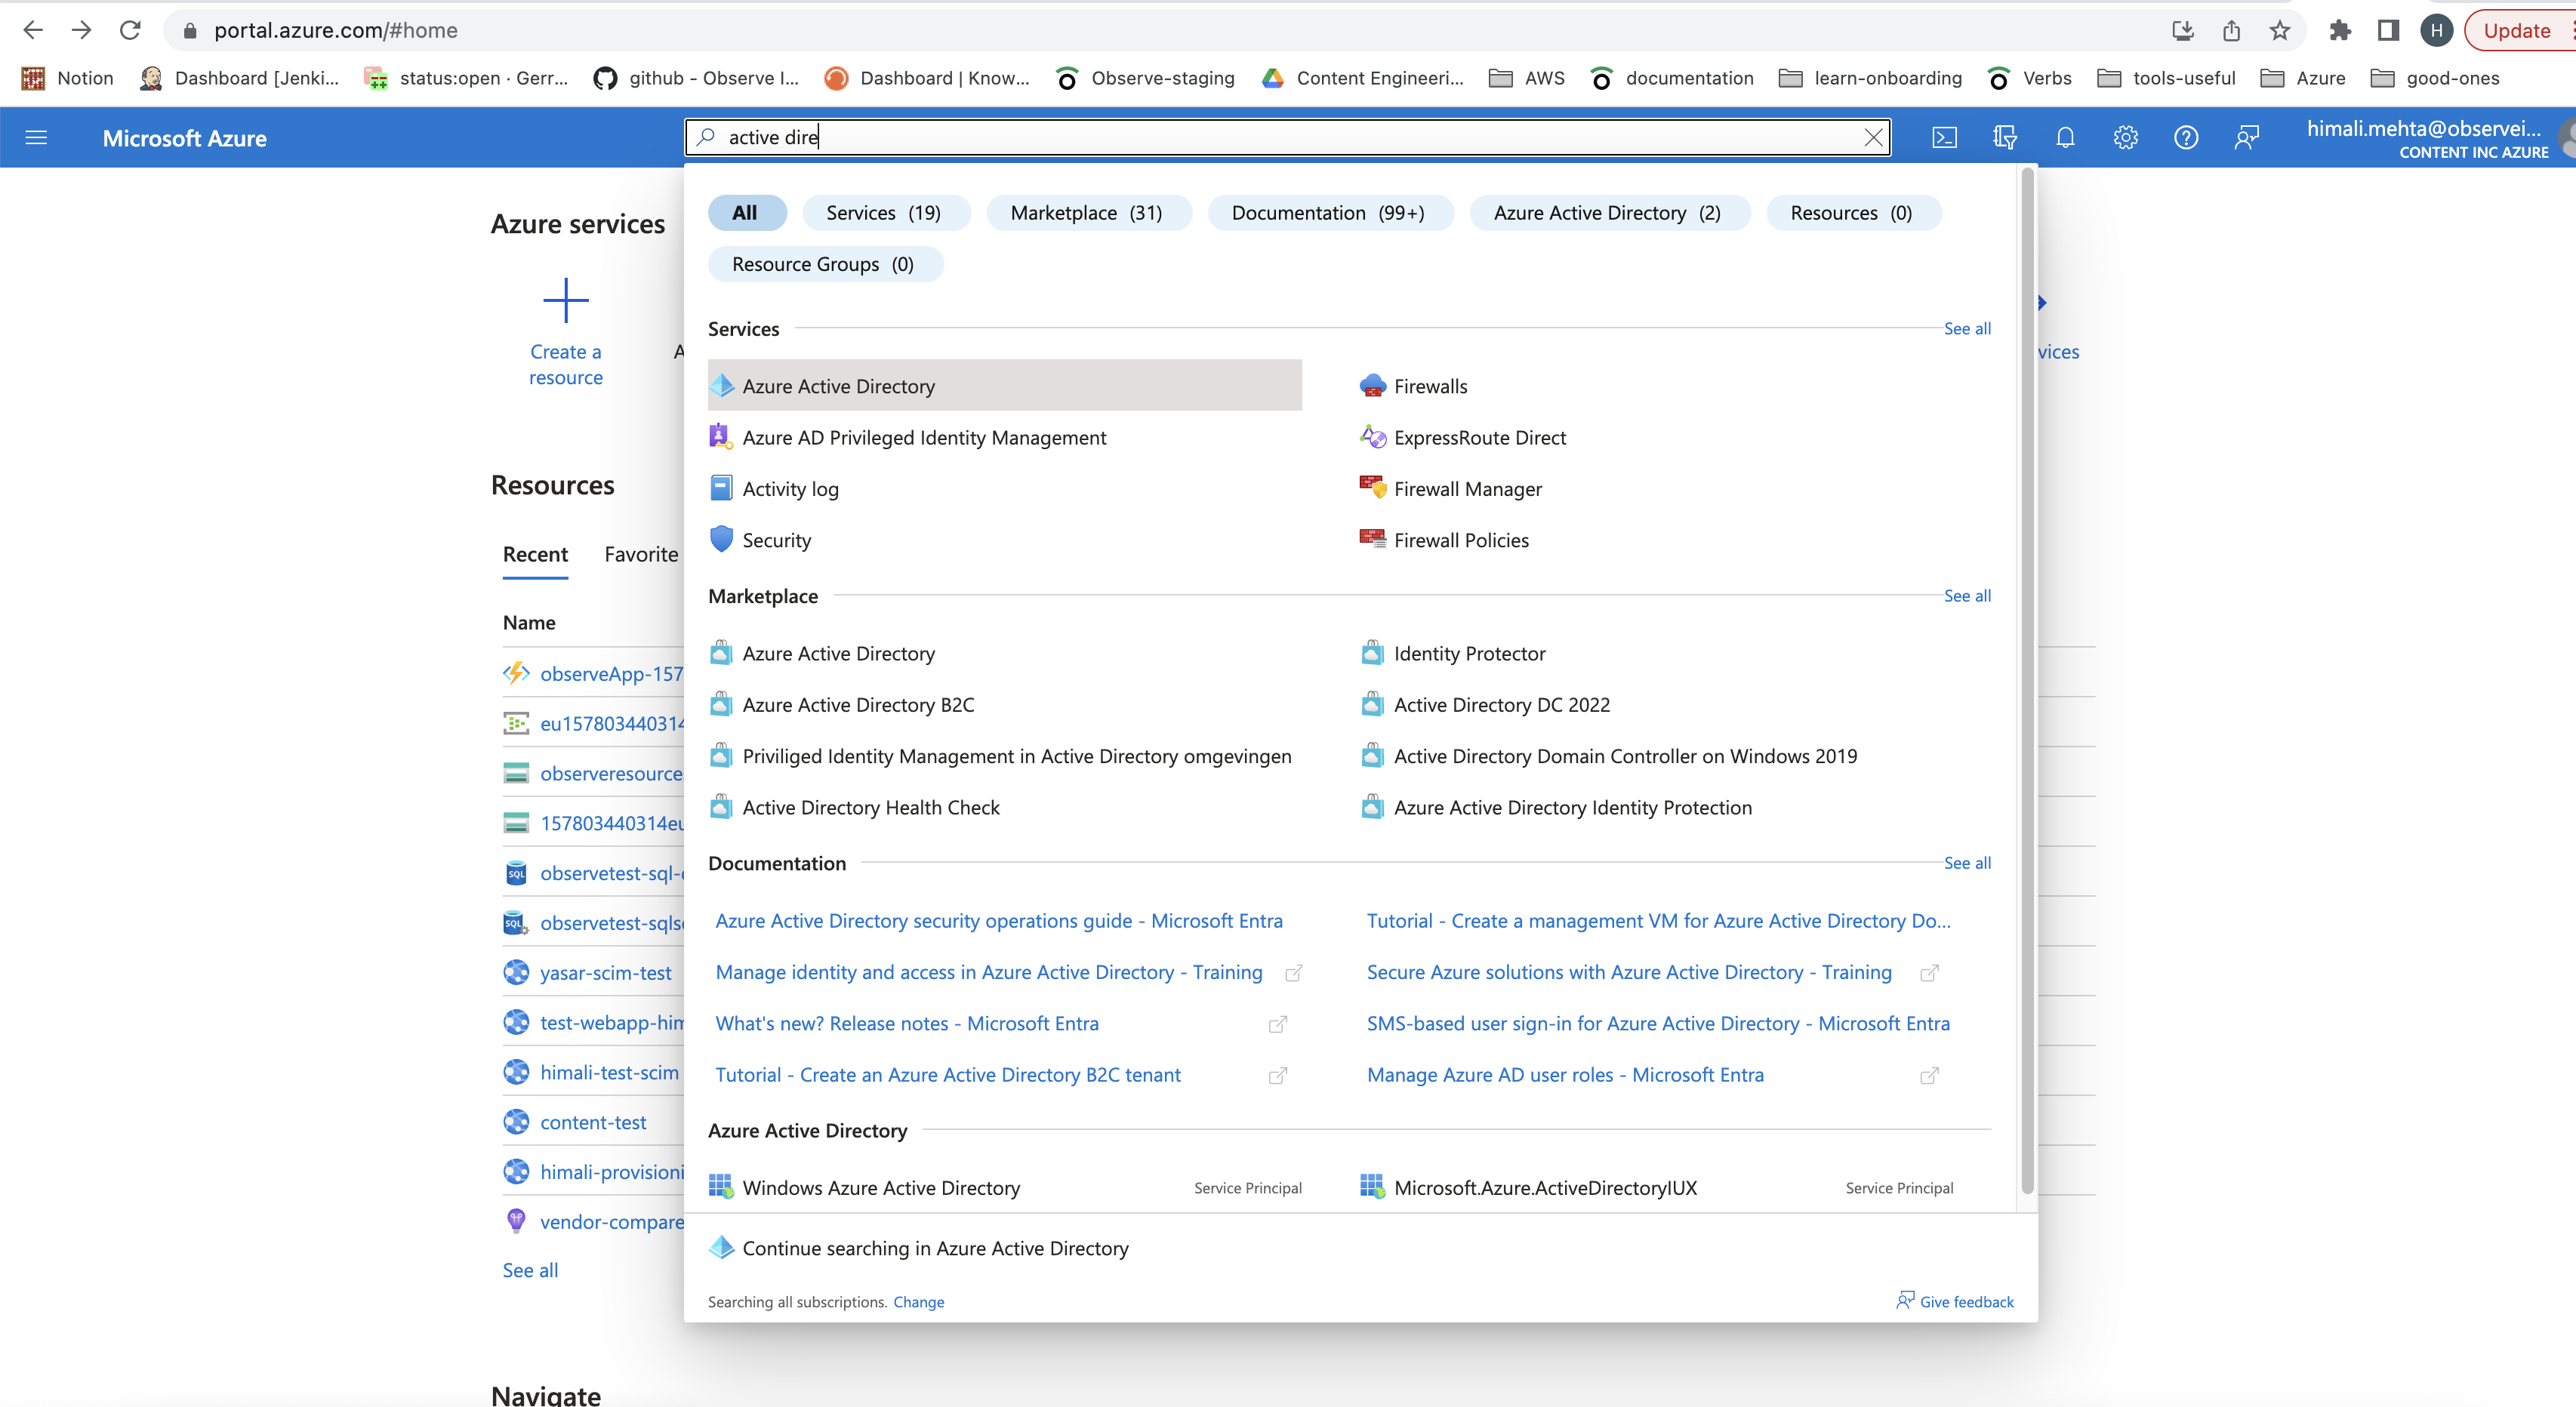
- Log into the Azure portal.
- Search for the Active Directory in the search field.
- Go to Monitoring and Diagnostic settings. Select Diagnostic setting.
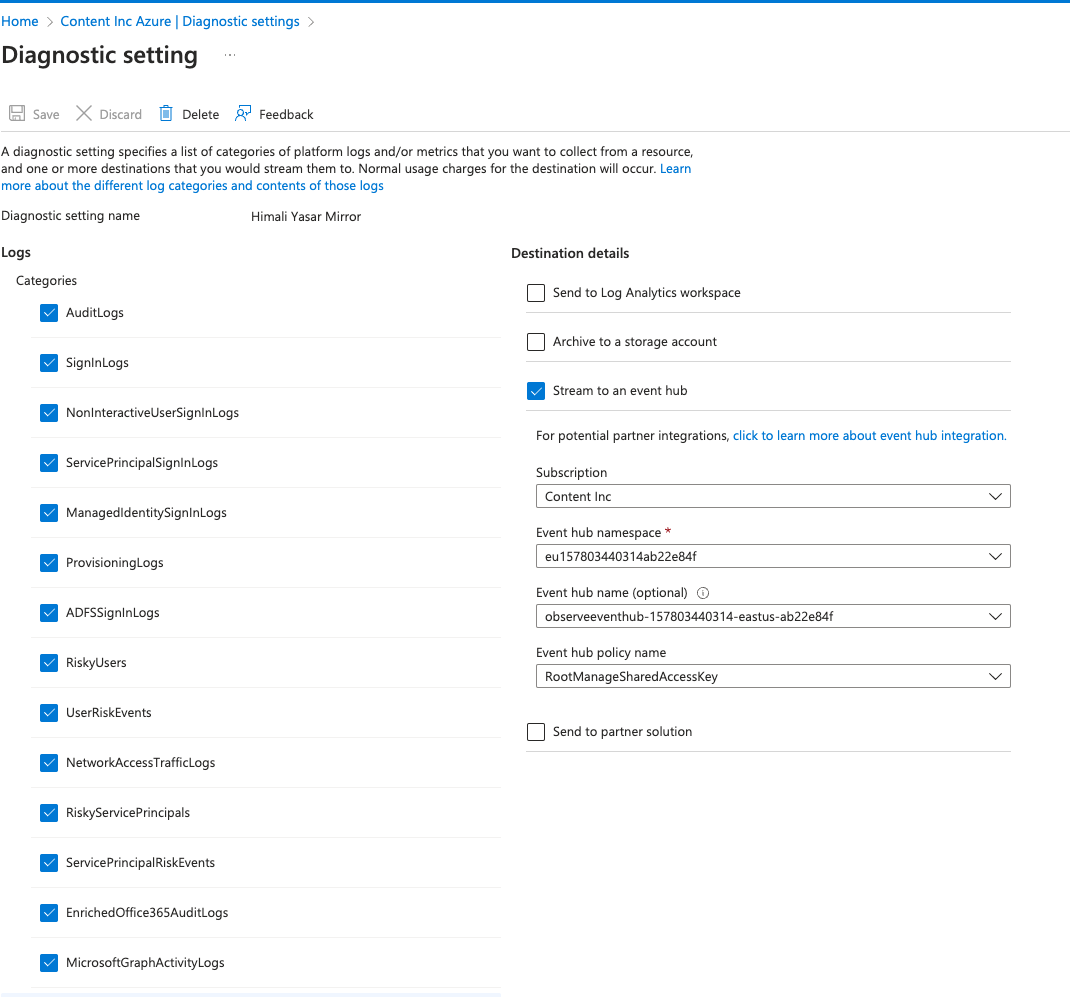
- Select the following options:
- Diagnostic setting name - Observe
- AuditLogs
- SignInLogs
- NonInteractiveUserSignInLogs
- ServicePrincipalSignInLogs
- ManagedIdentitySignInLogs
- ProvisioningLogs
- Stream to an event hub
- Select the event hub created by the Observe collection function.
- Click Save.
Azure Kubernetes Services (AKS)
- Log into the Azure portal.
- In the Azure search field, enter Kubernetes Services.
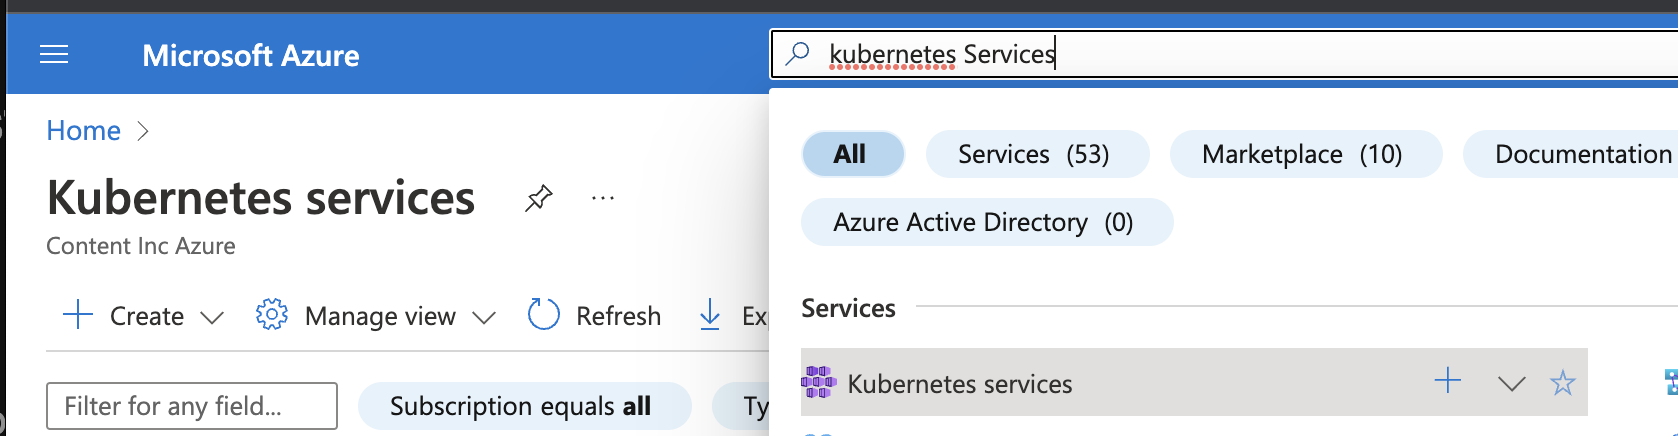
- Choose the service you want to monitor.
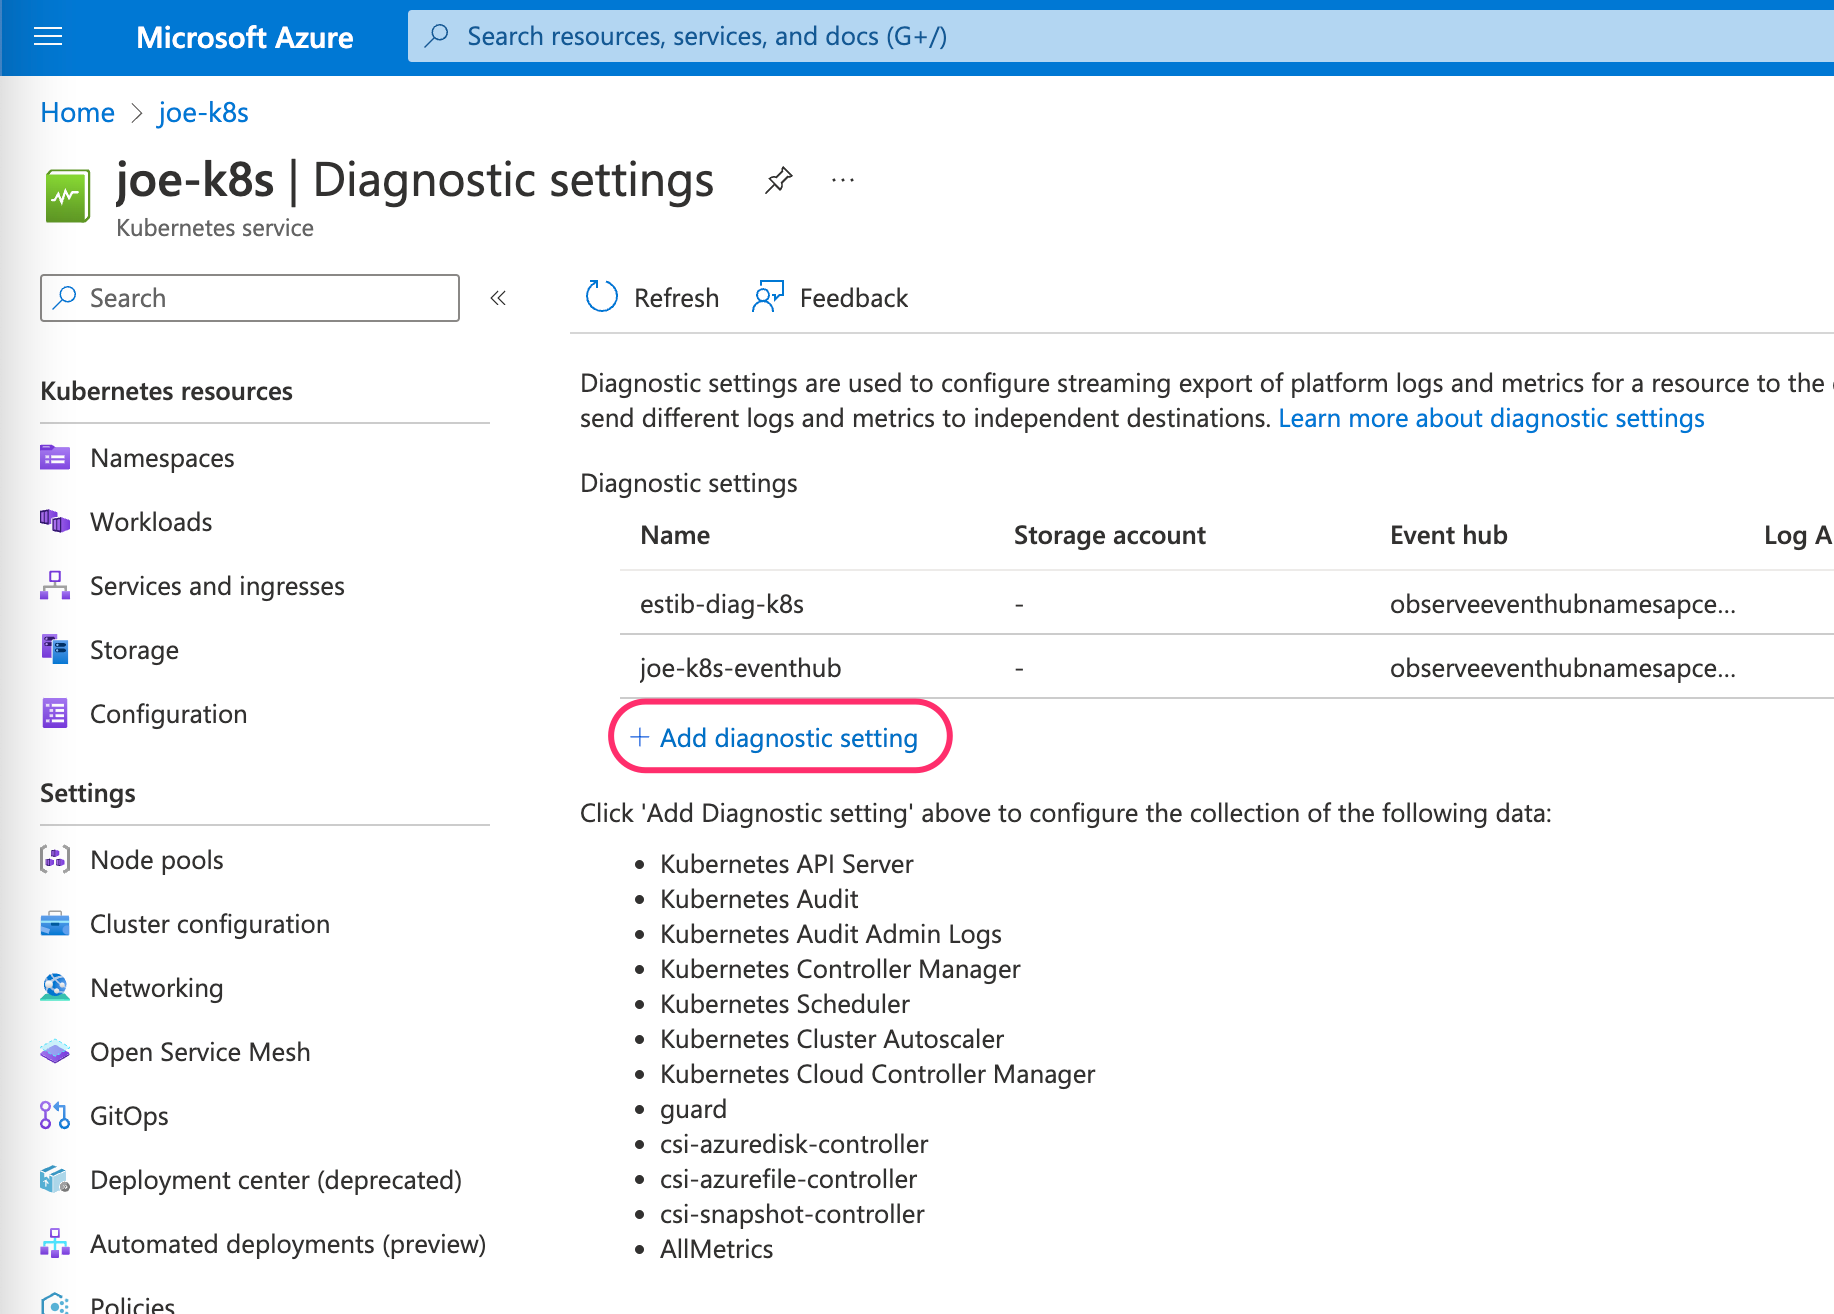
- From the menu, select Diagnostic Settings.
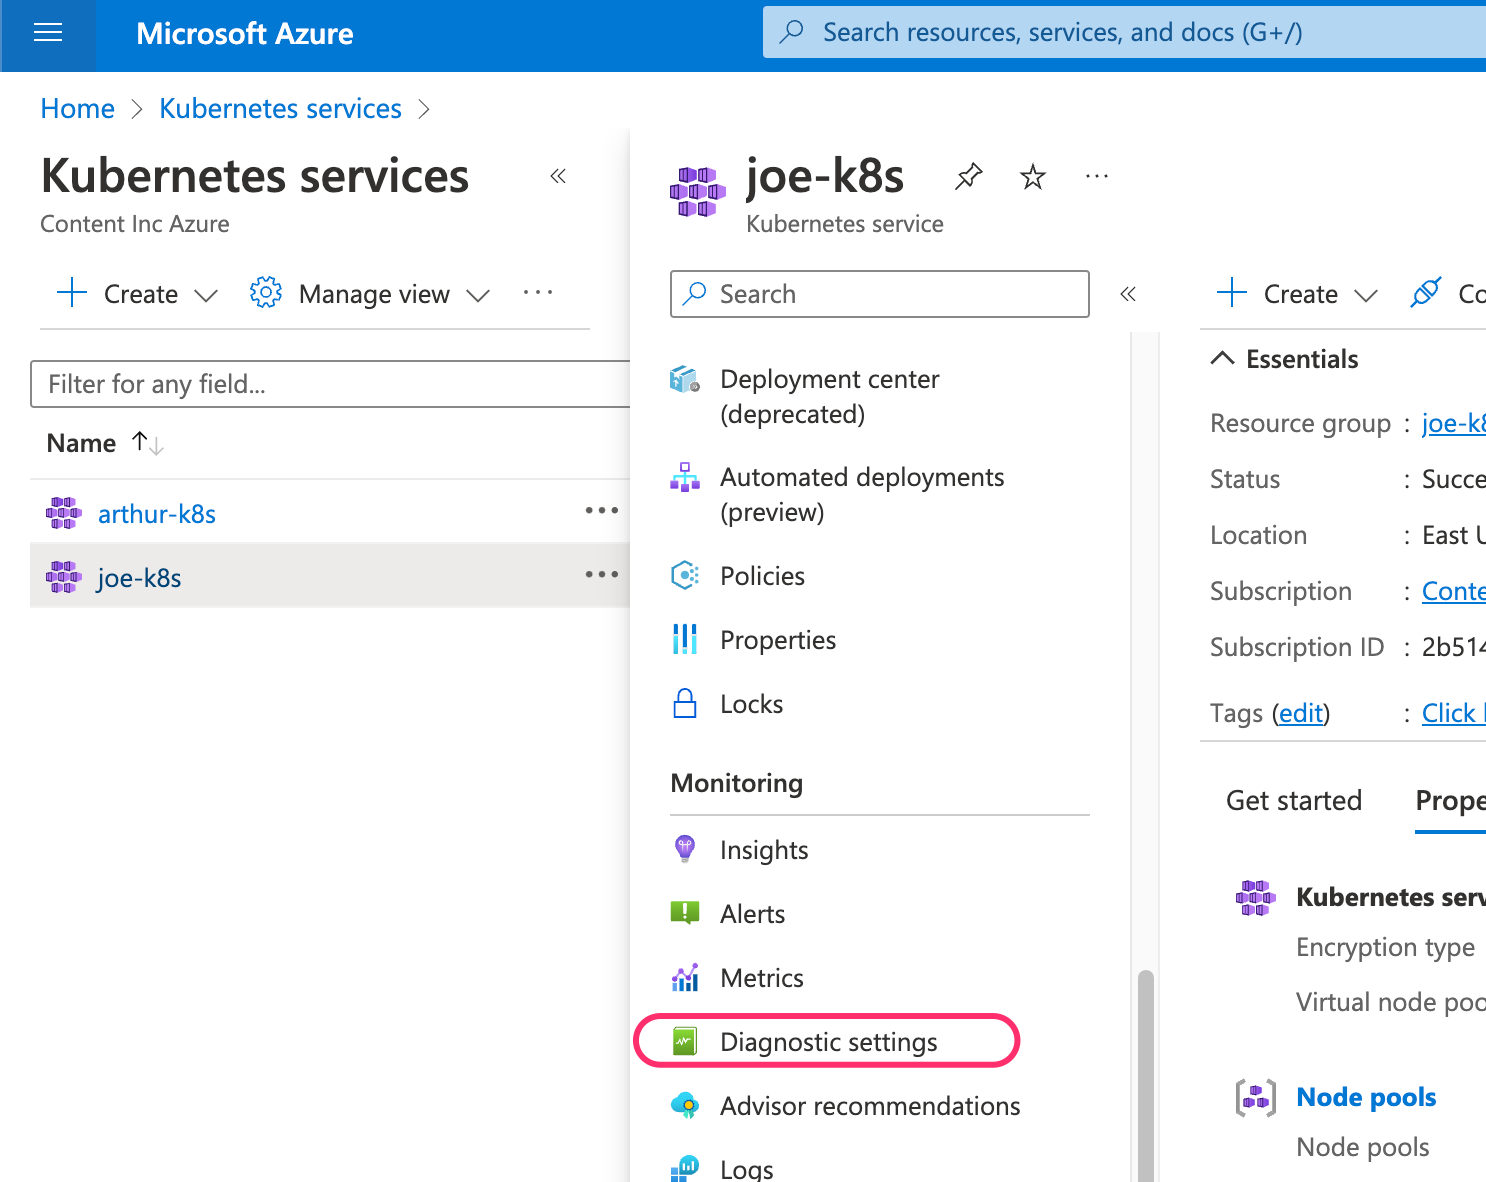
- Click Add diagnostic setting.
- Create a name for your setting. Select all of the metrics listed, then click Stream to an Event hub. Be sure to select the Event hub namespace and Event hub name with your Observe customer ID.
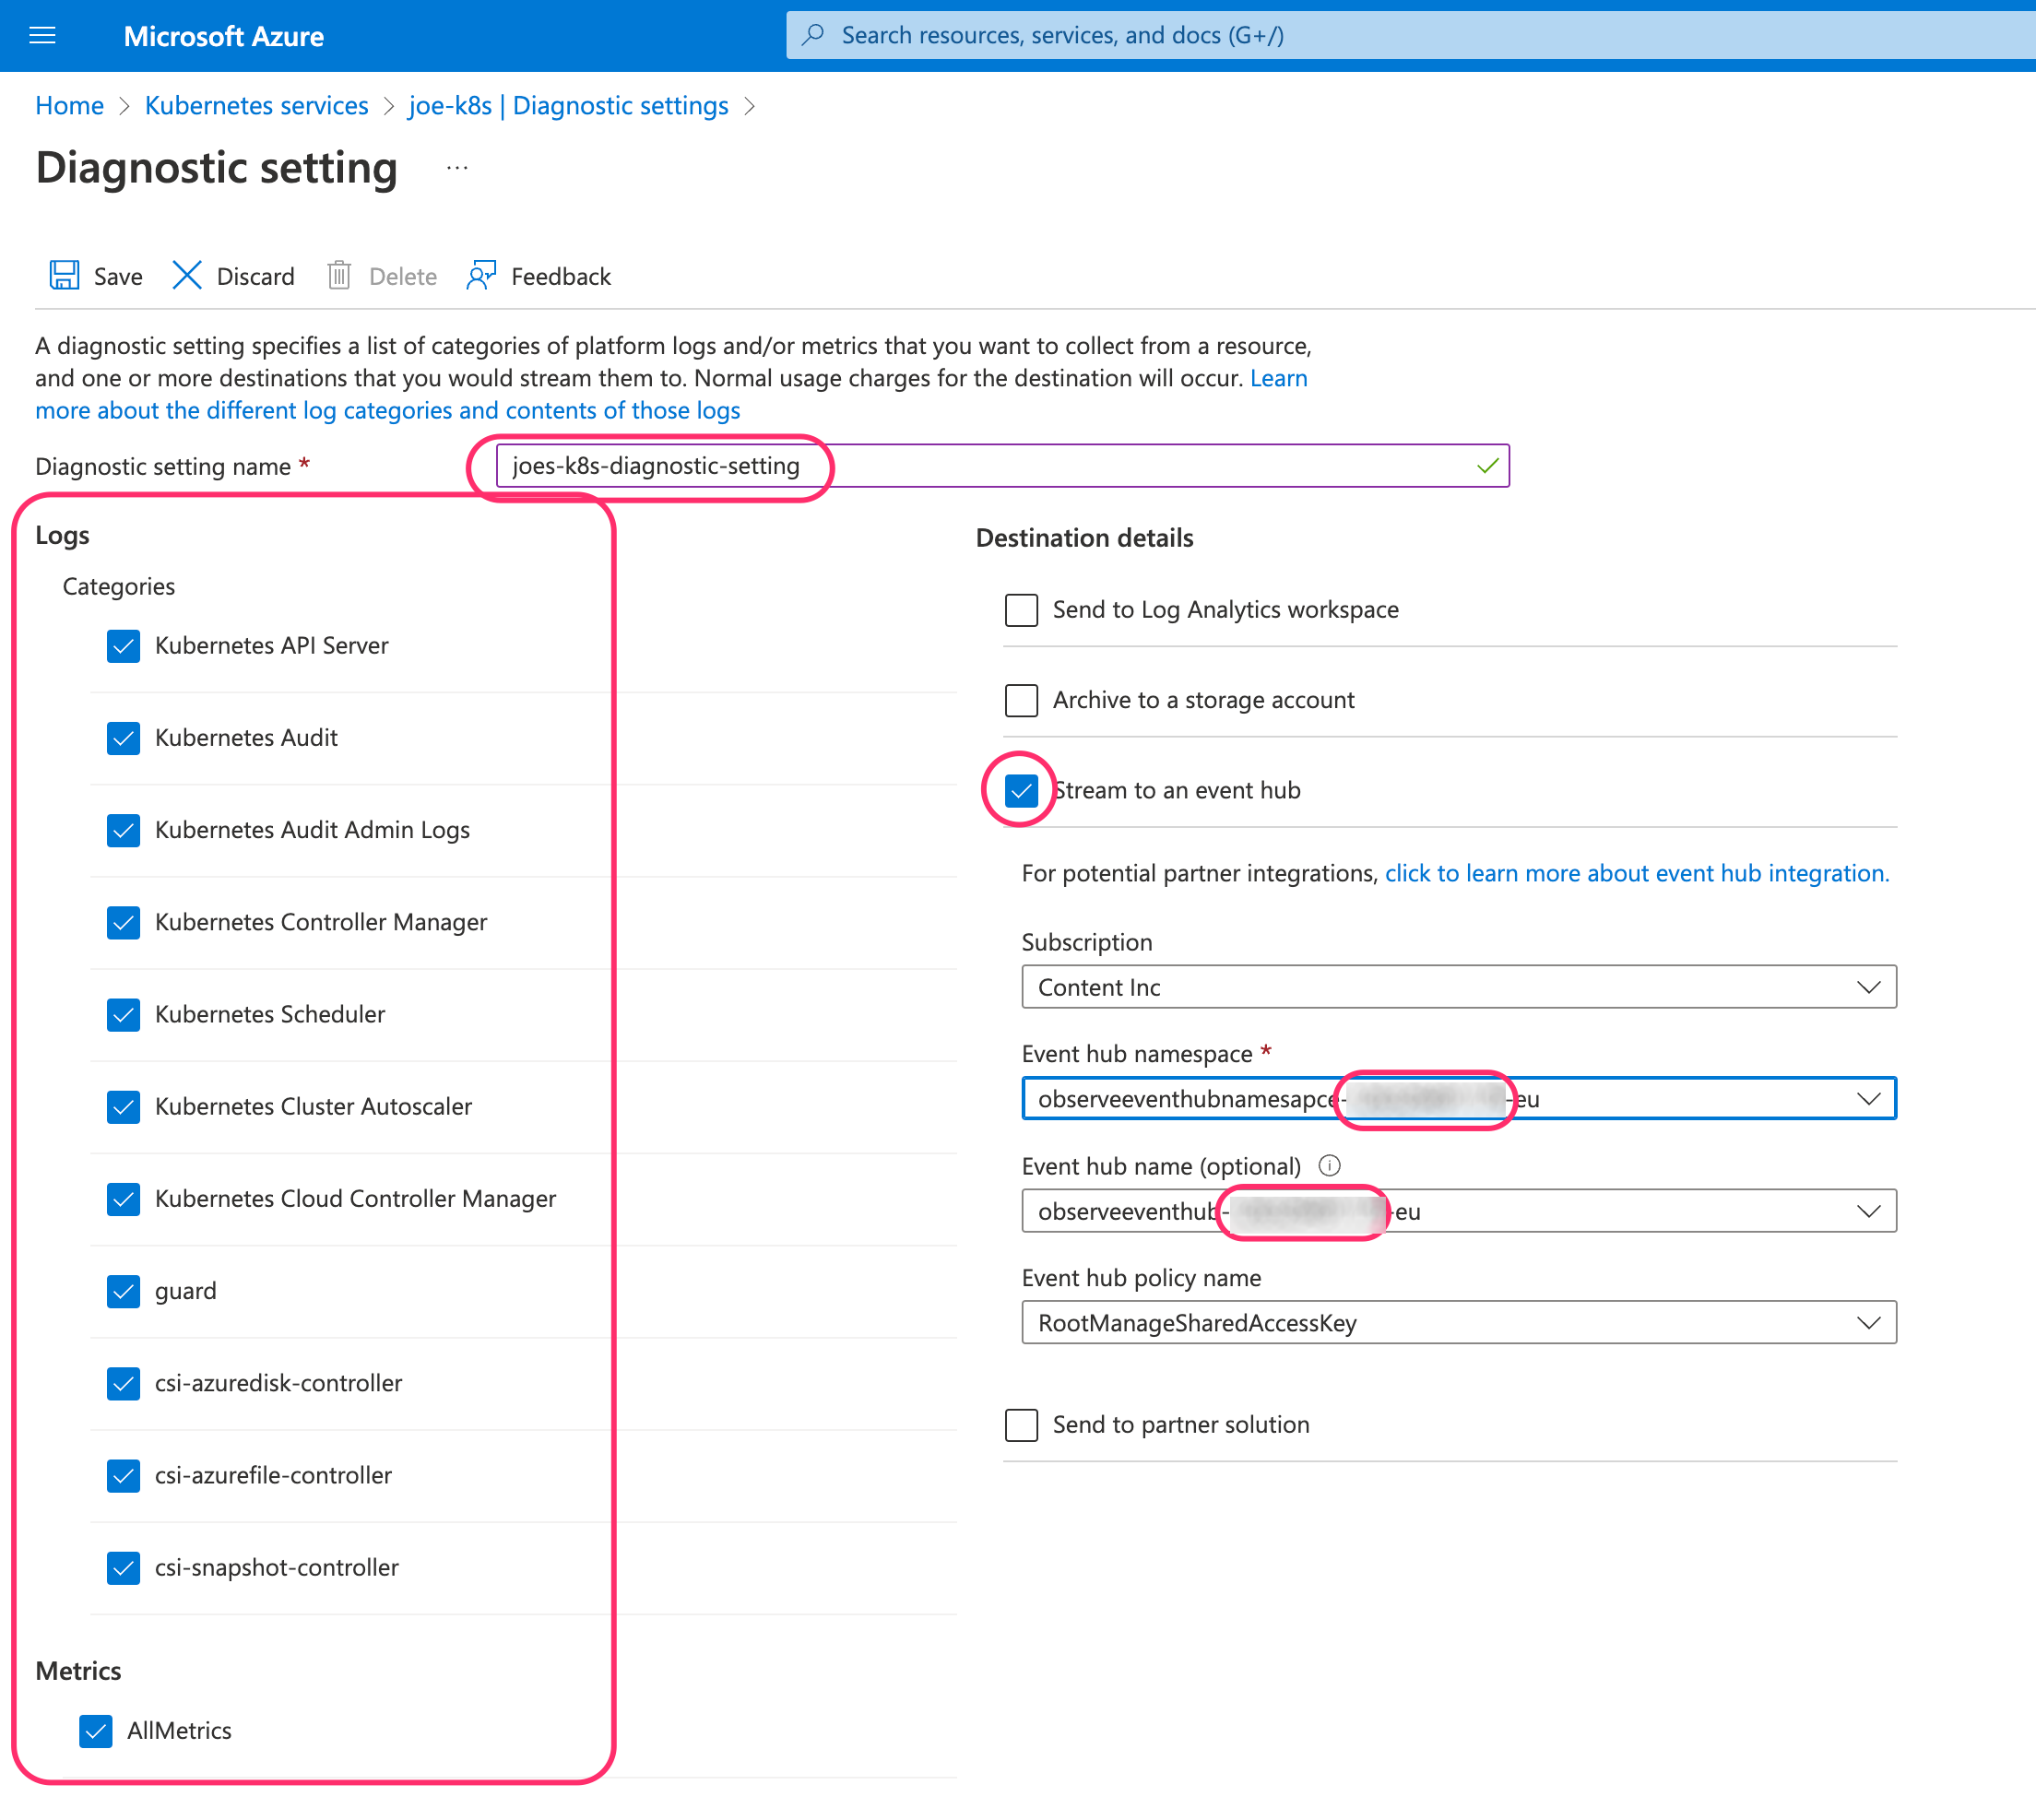
- Click Save.
Azure App Services
- Log into the Azure portal.
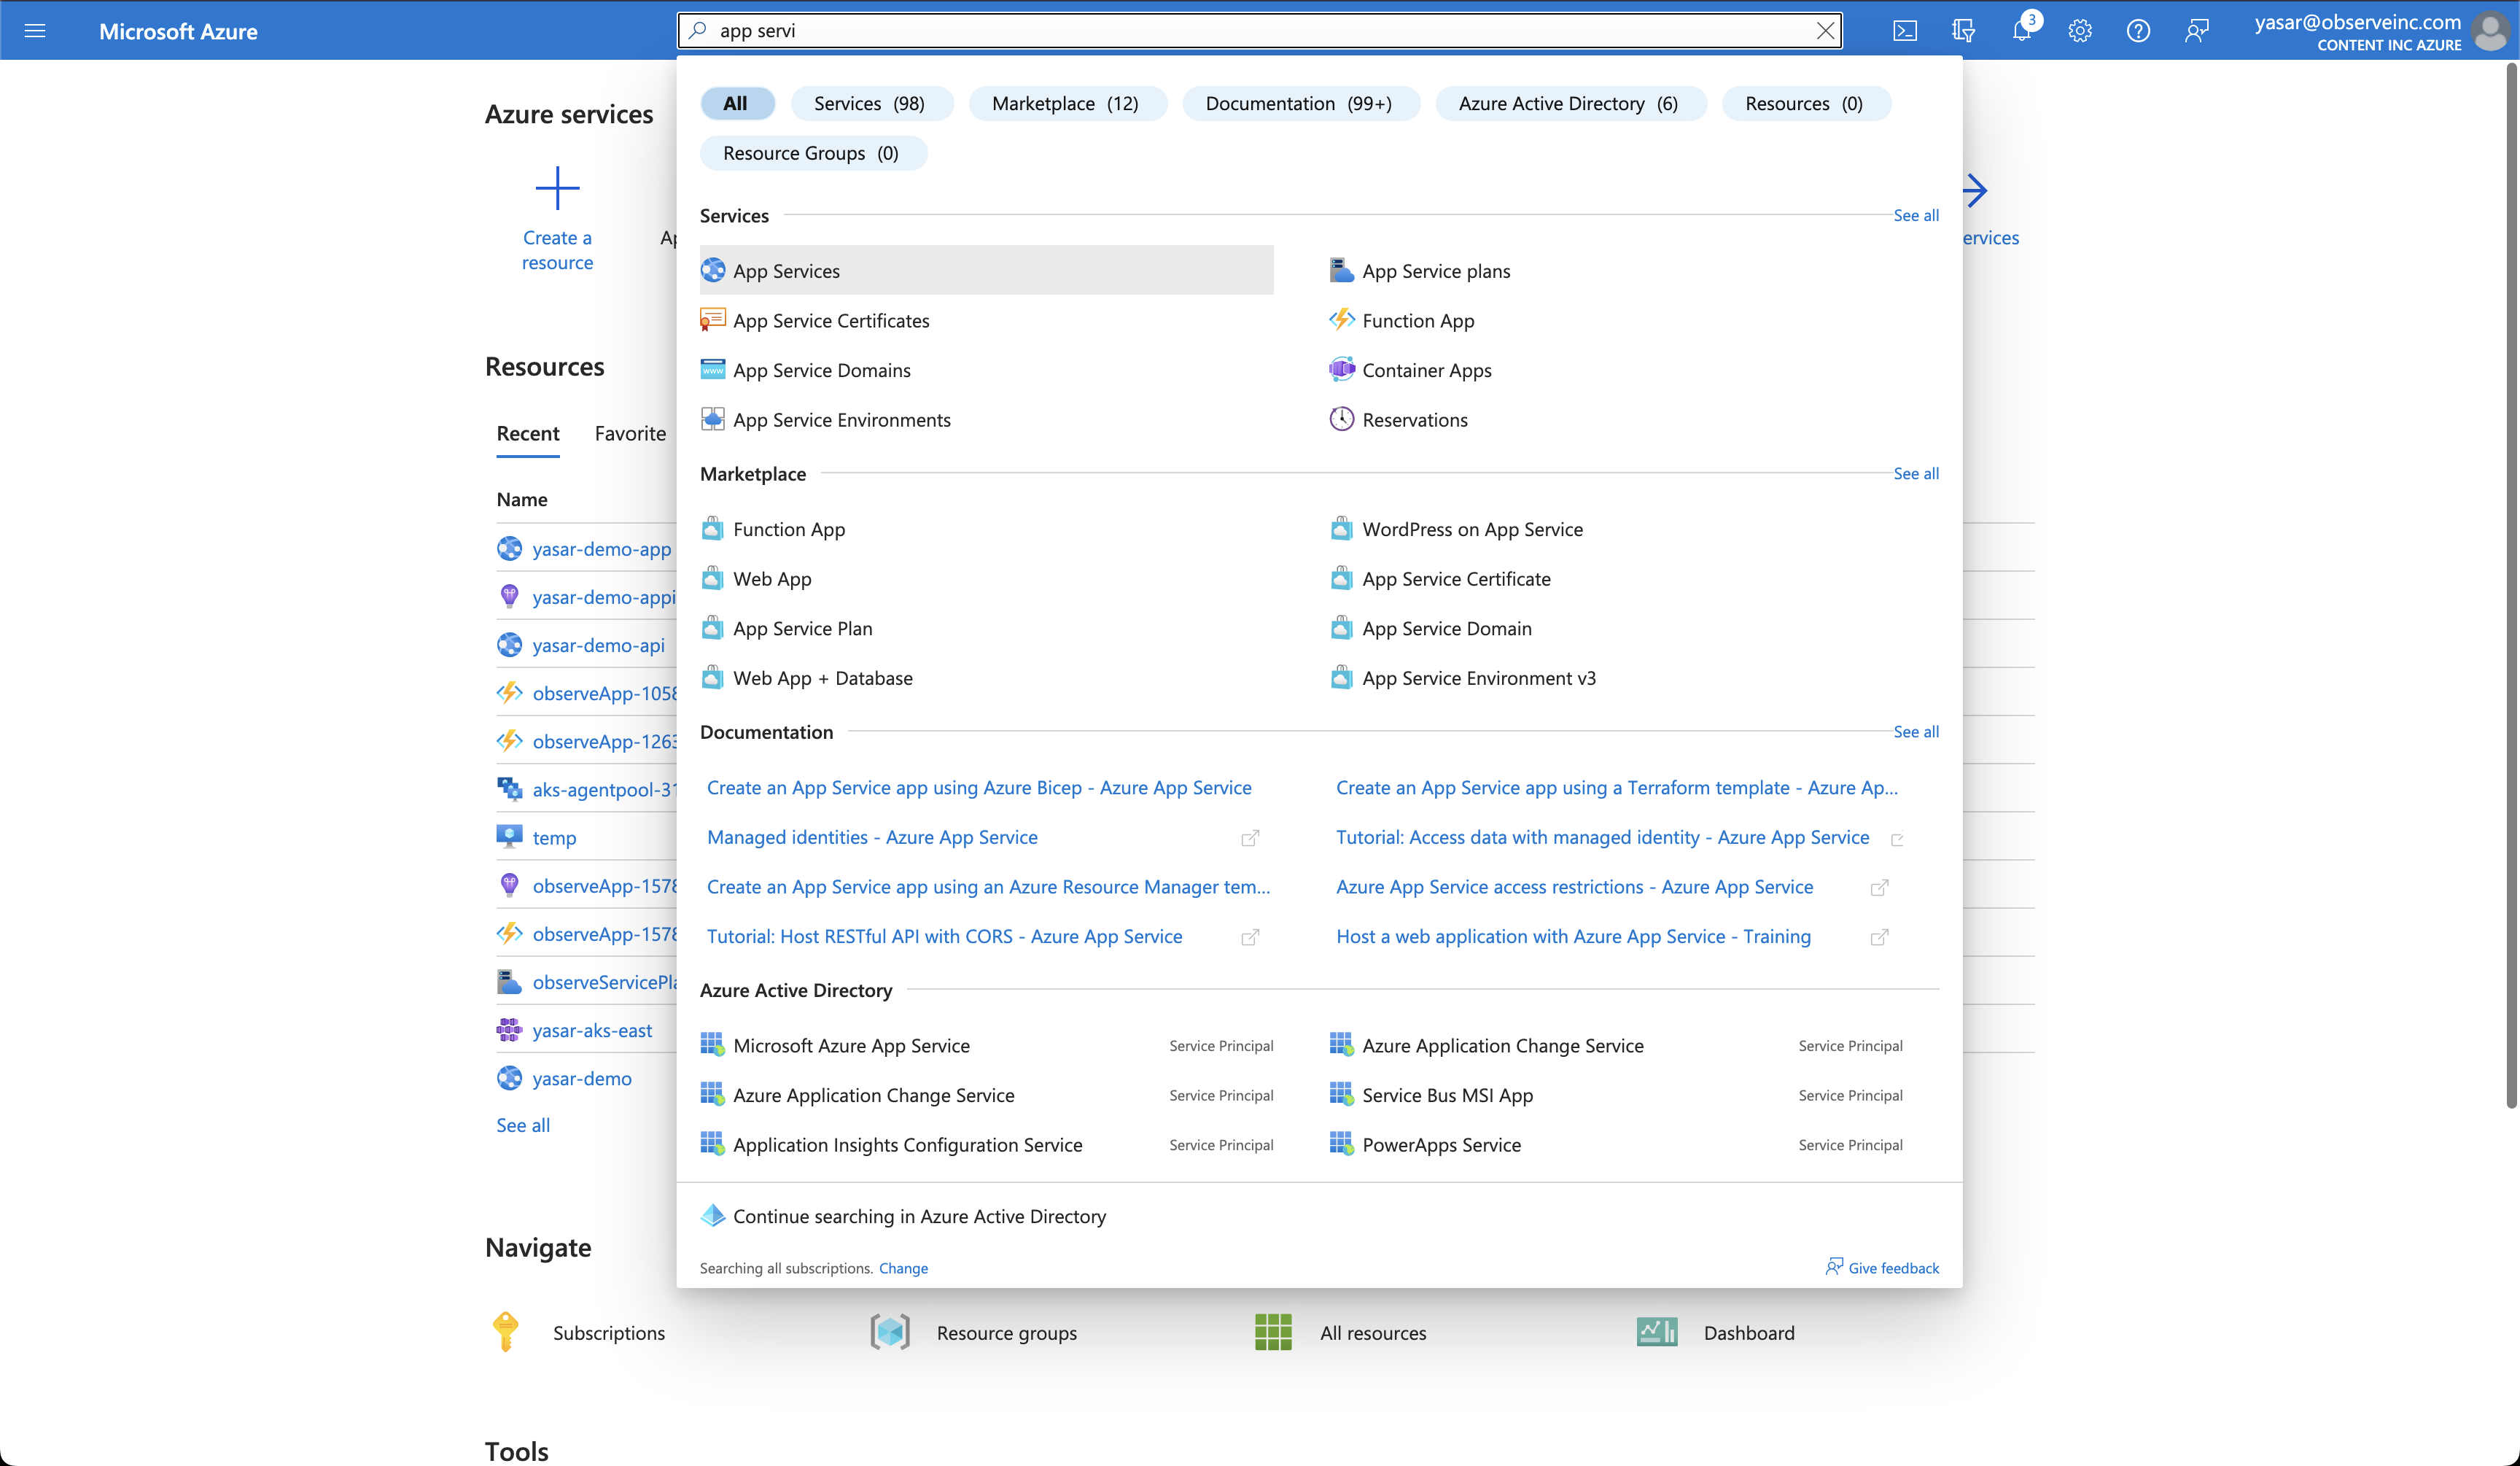
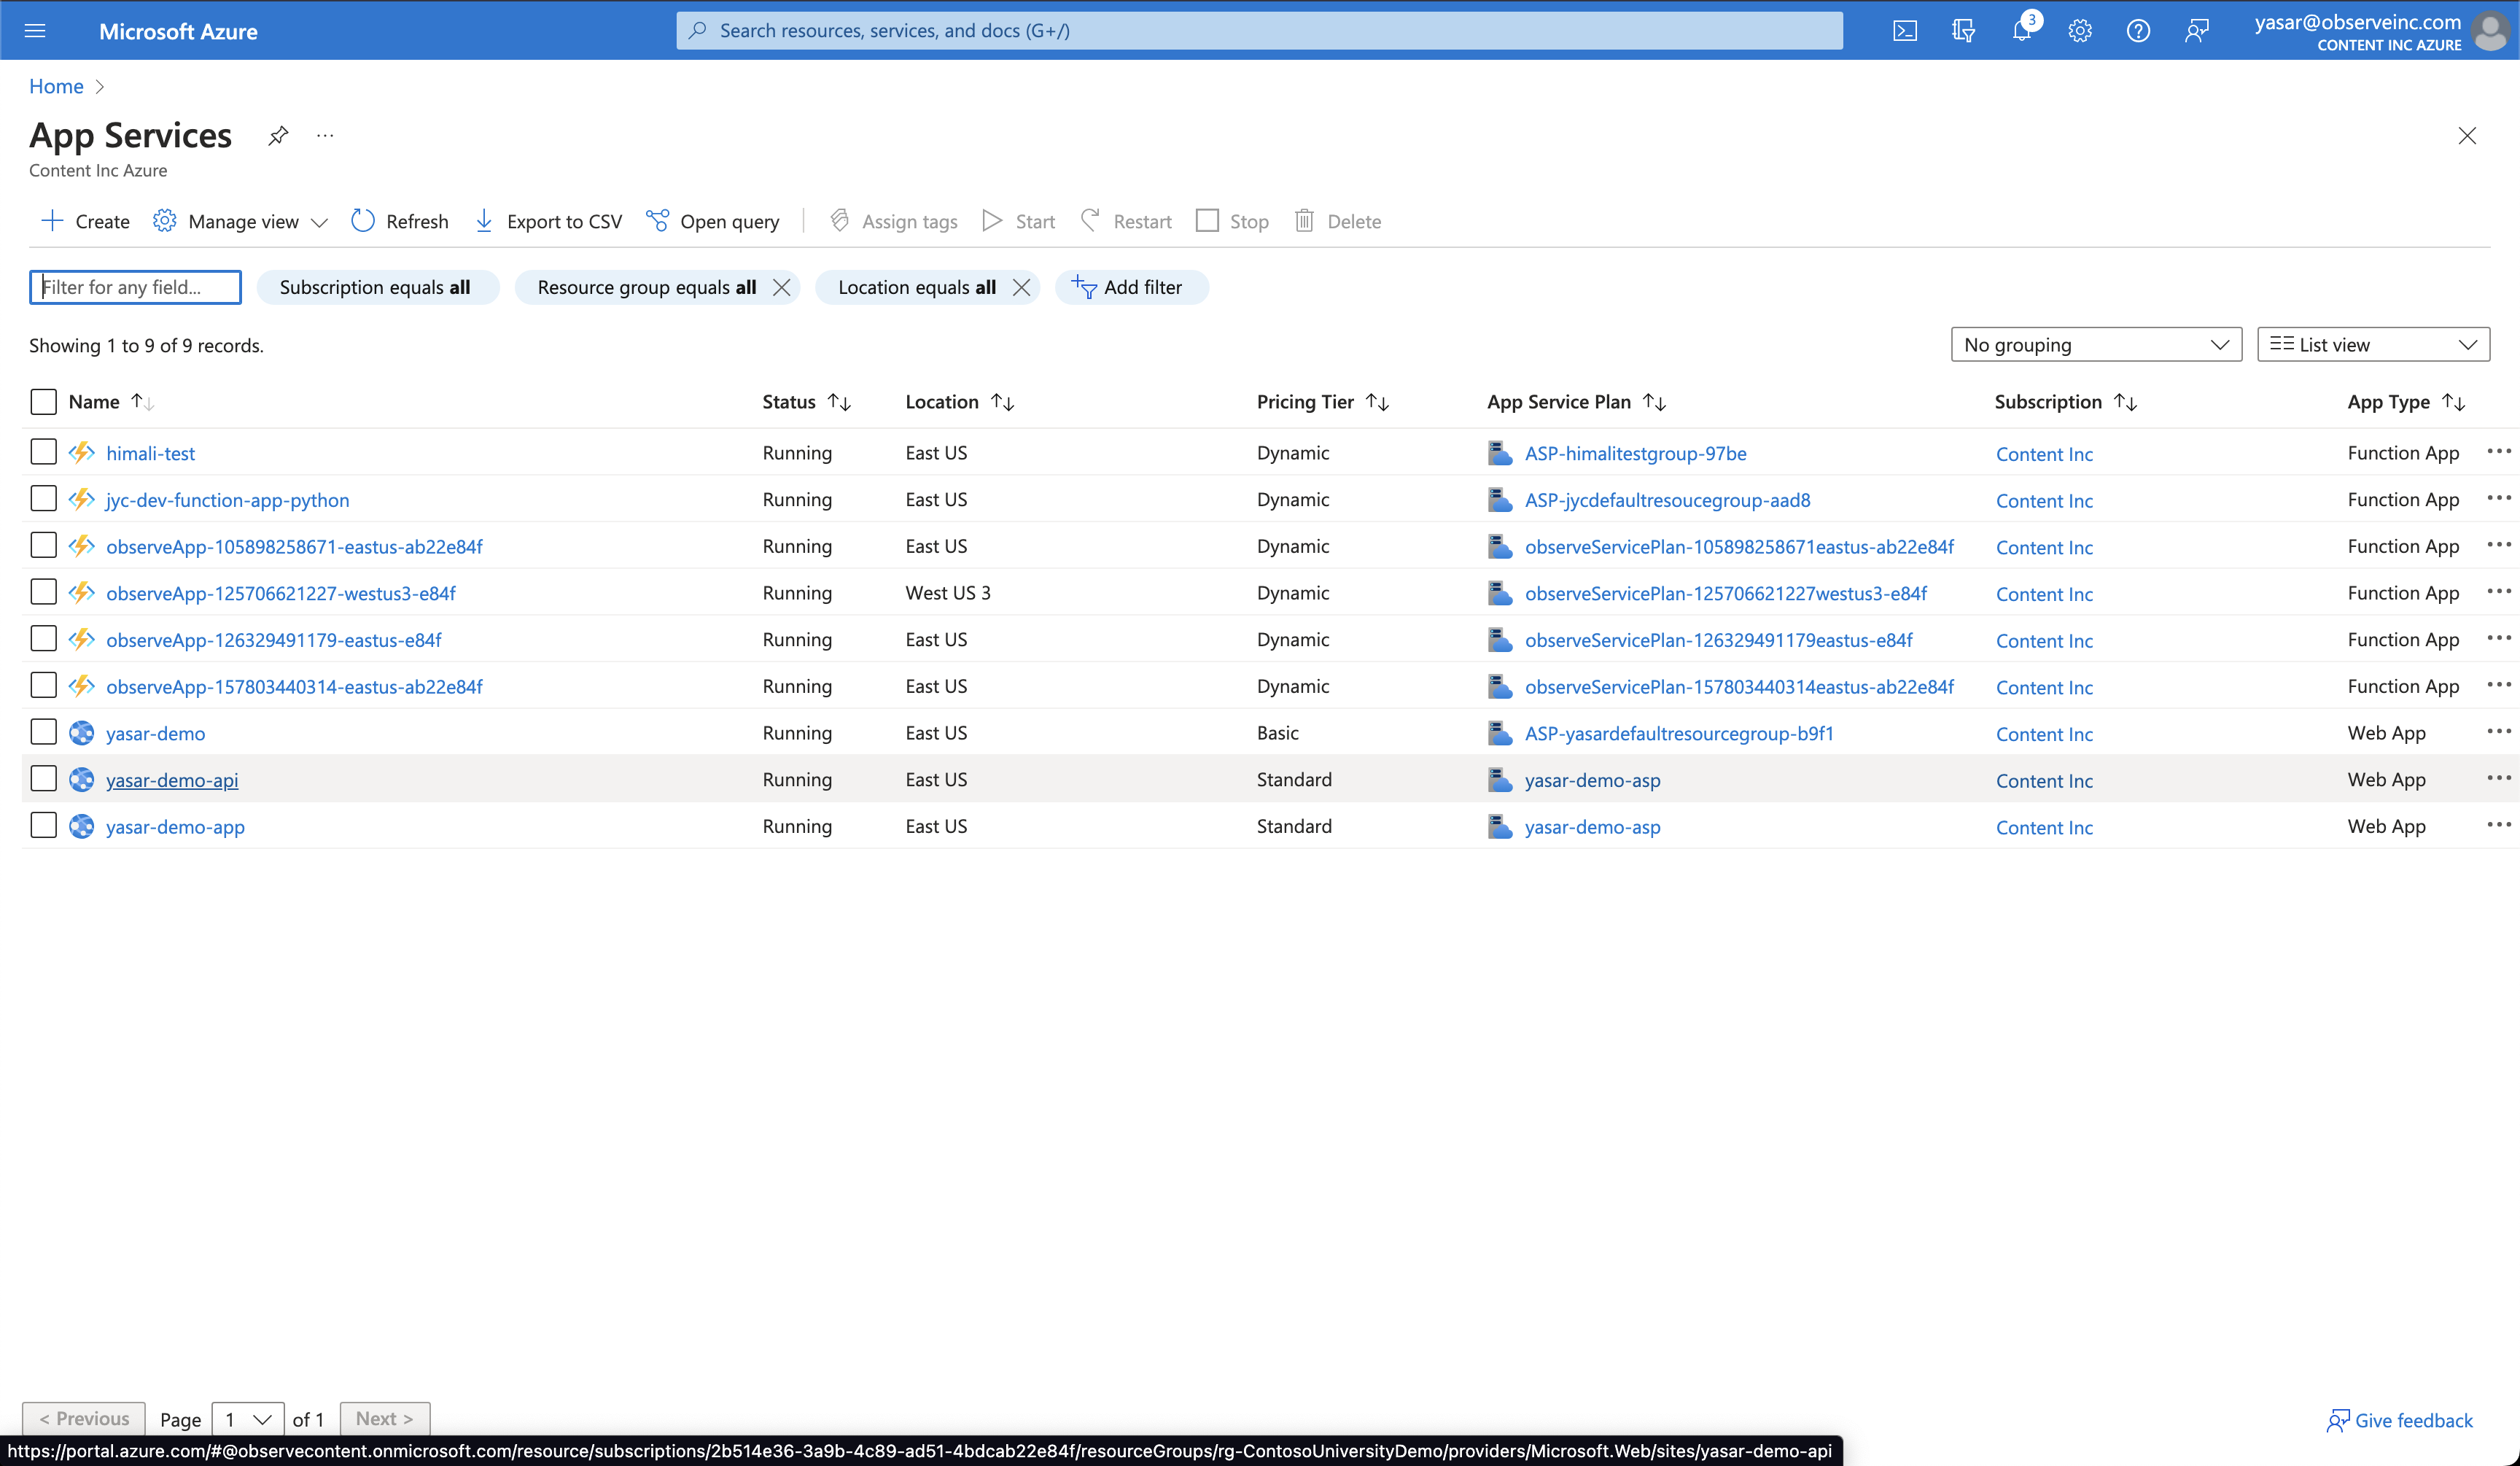
- Search for the App Services in the search field and select the App Services.
- Select the App Service you want to monitor.
- Search for Diagnostic settings and select it.
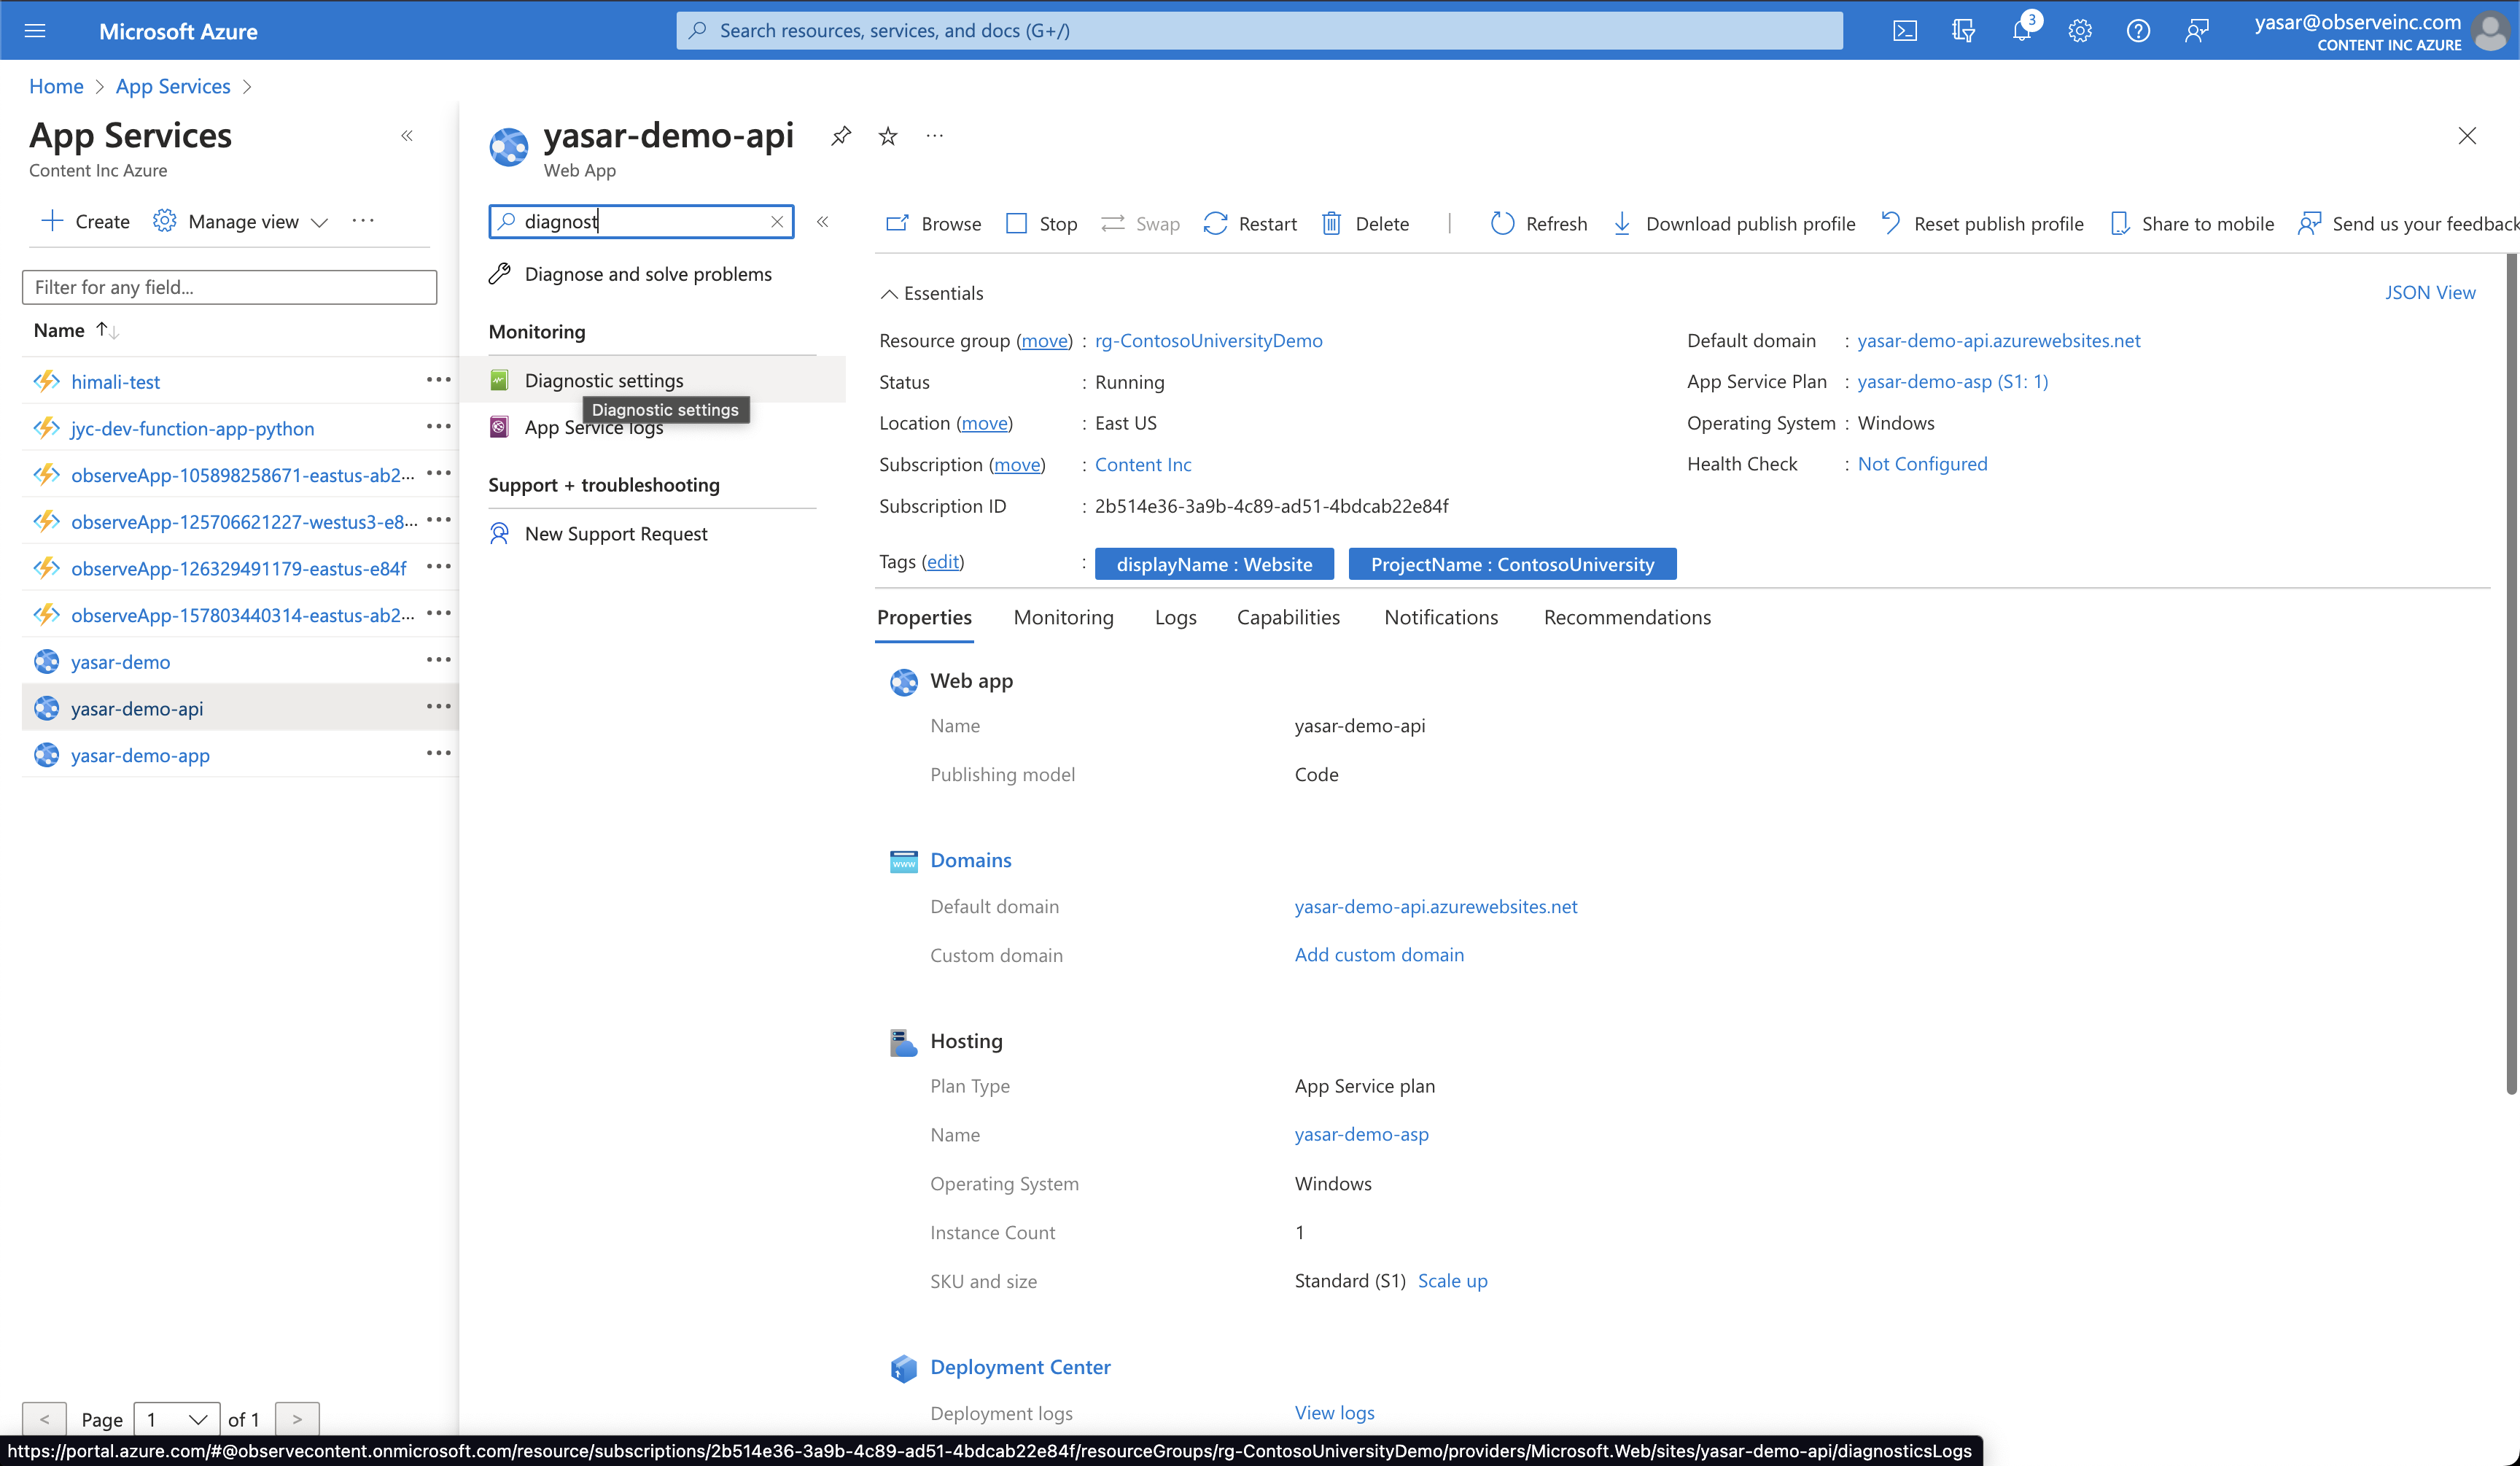
- Select Add diagnostic setting.
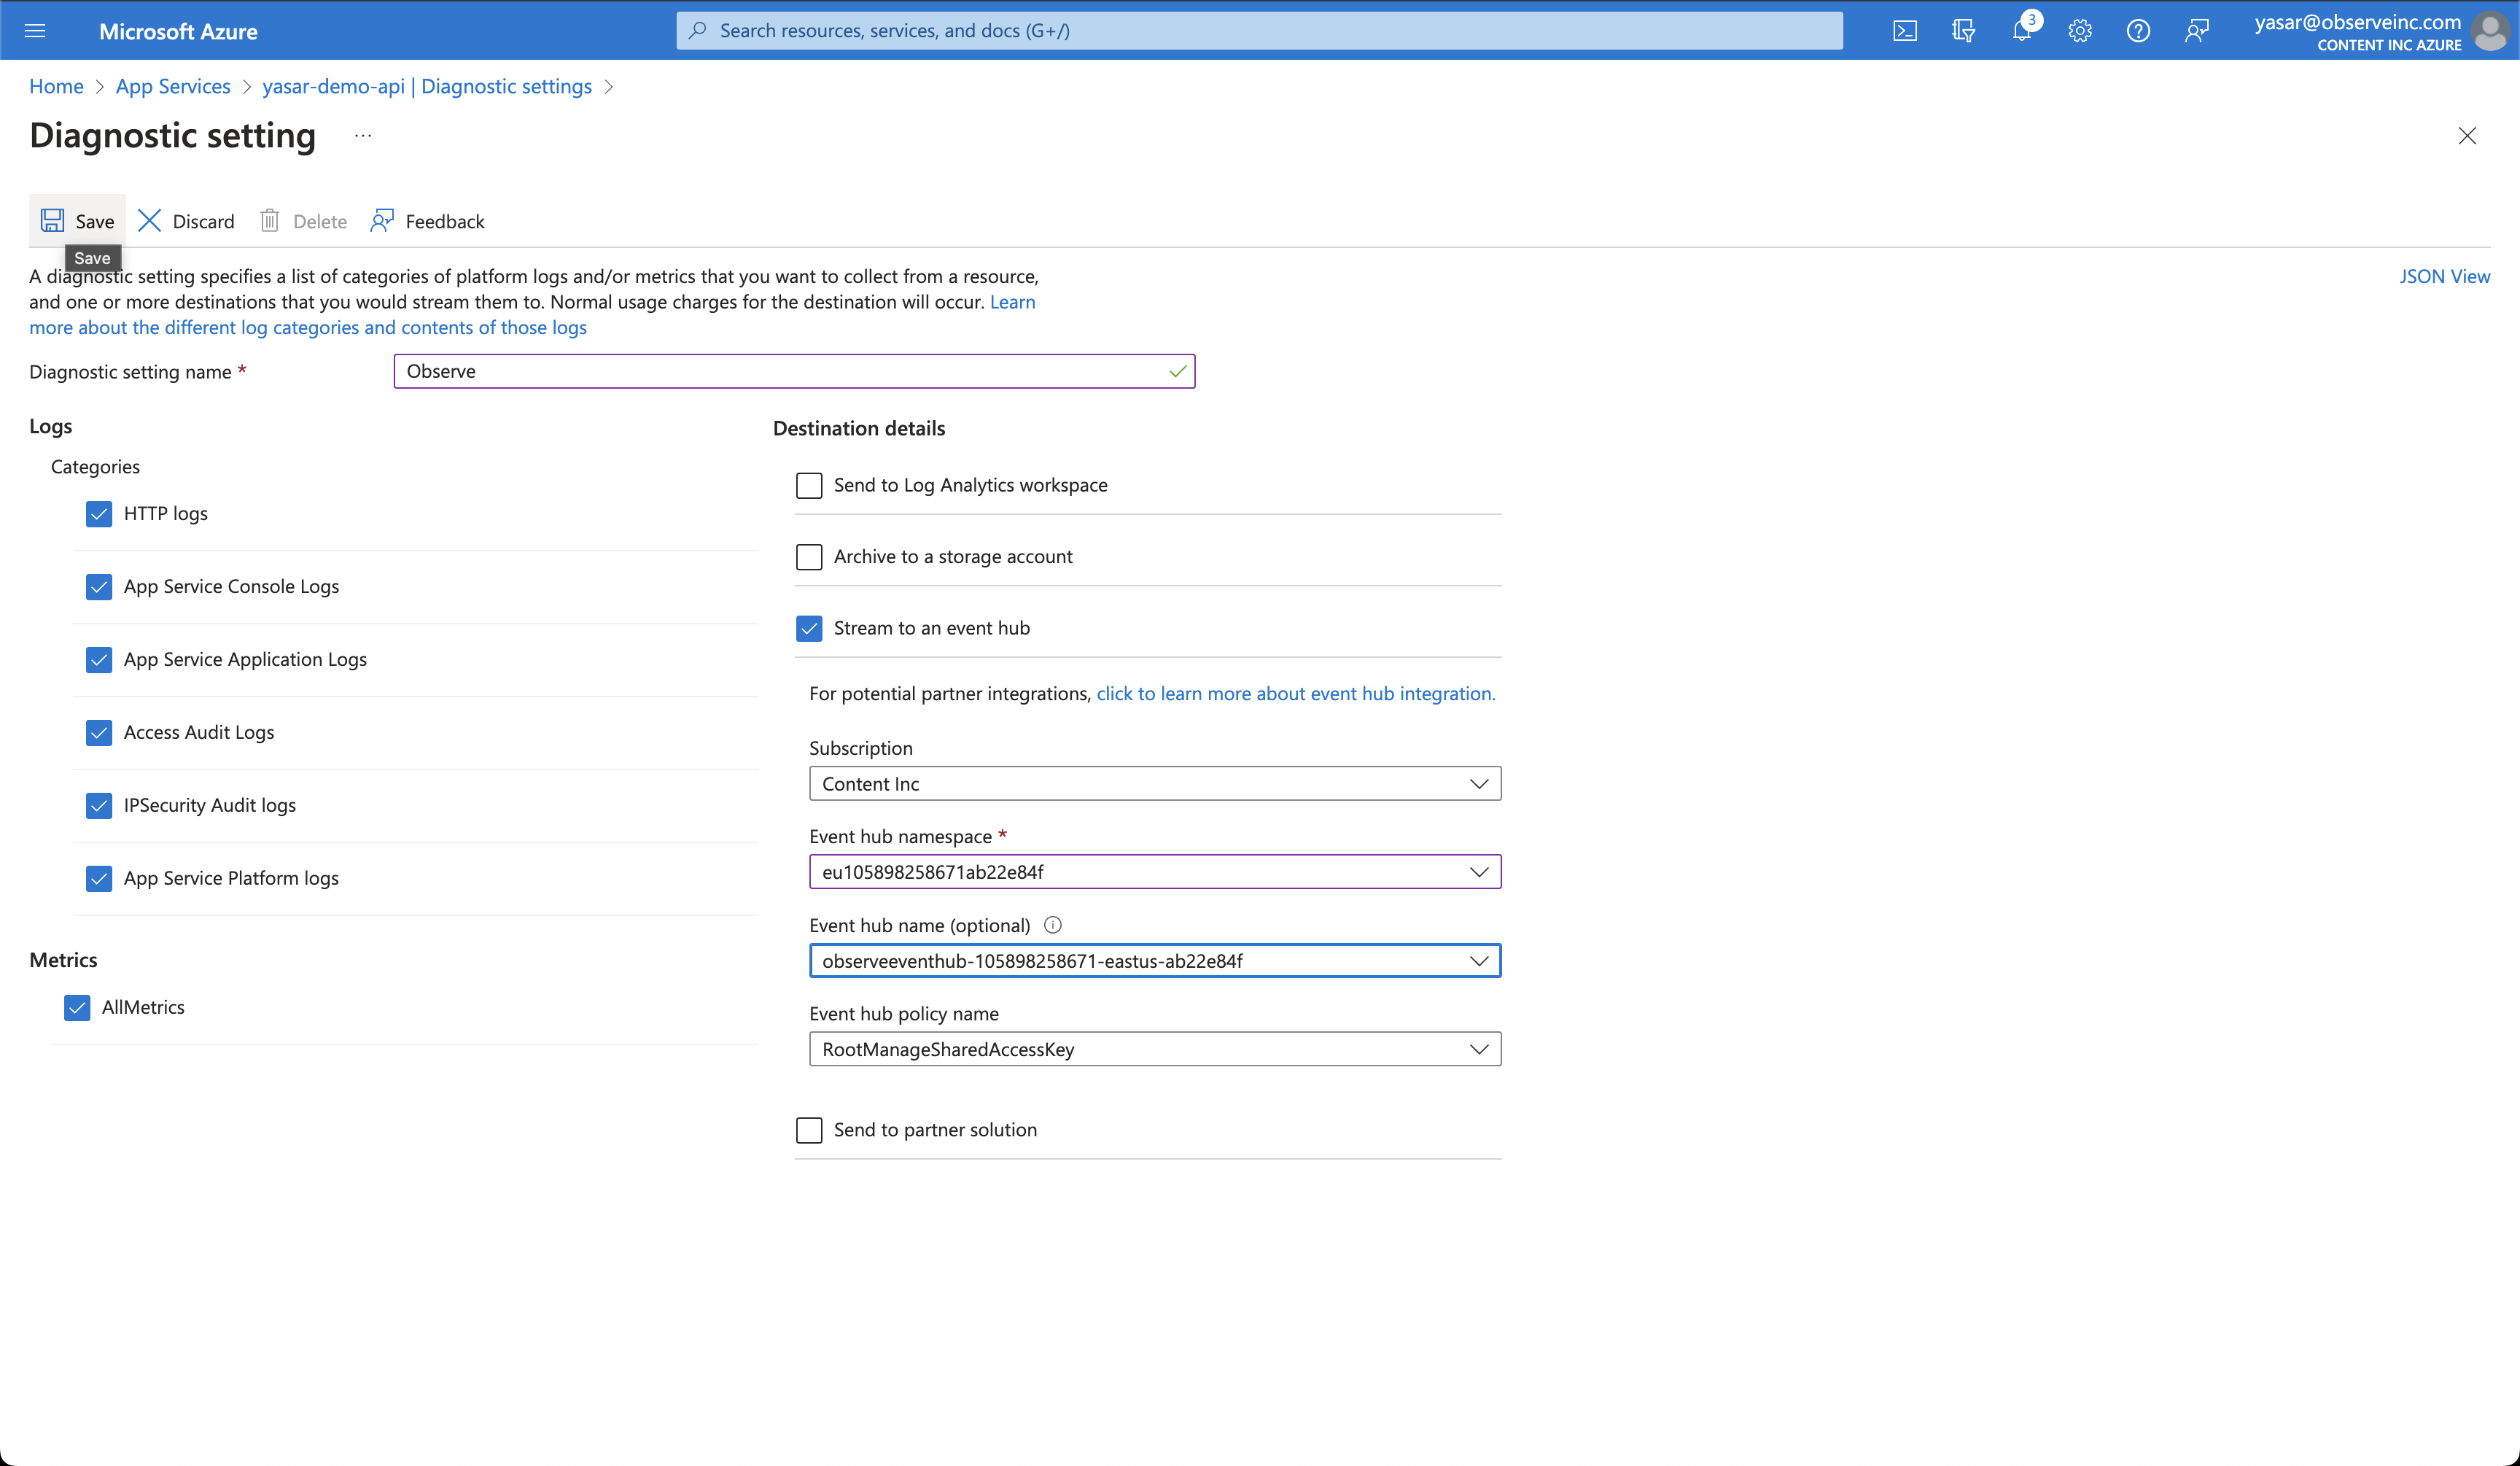
- Select the following options:
- Diagnostic setting name - Observe
- HTTP logs
- App Service Console Logs
- App Service Application Logs
- Access Audit Logs
- IPSecurity Audit logs
- App Service Platform logs
- All Metrics
- Stream to an event hub
- Select the event hub created by the Observe collection function.
- Click Save.
If you have Application Insights enabled and want to get detailed info for your App Service:
- Search for Application Insights and select it.
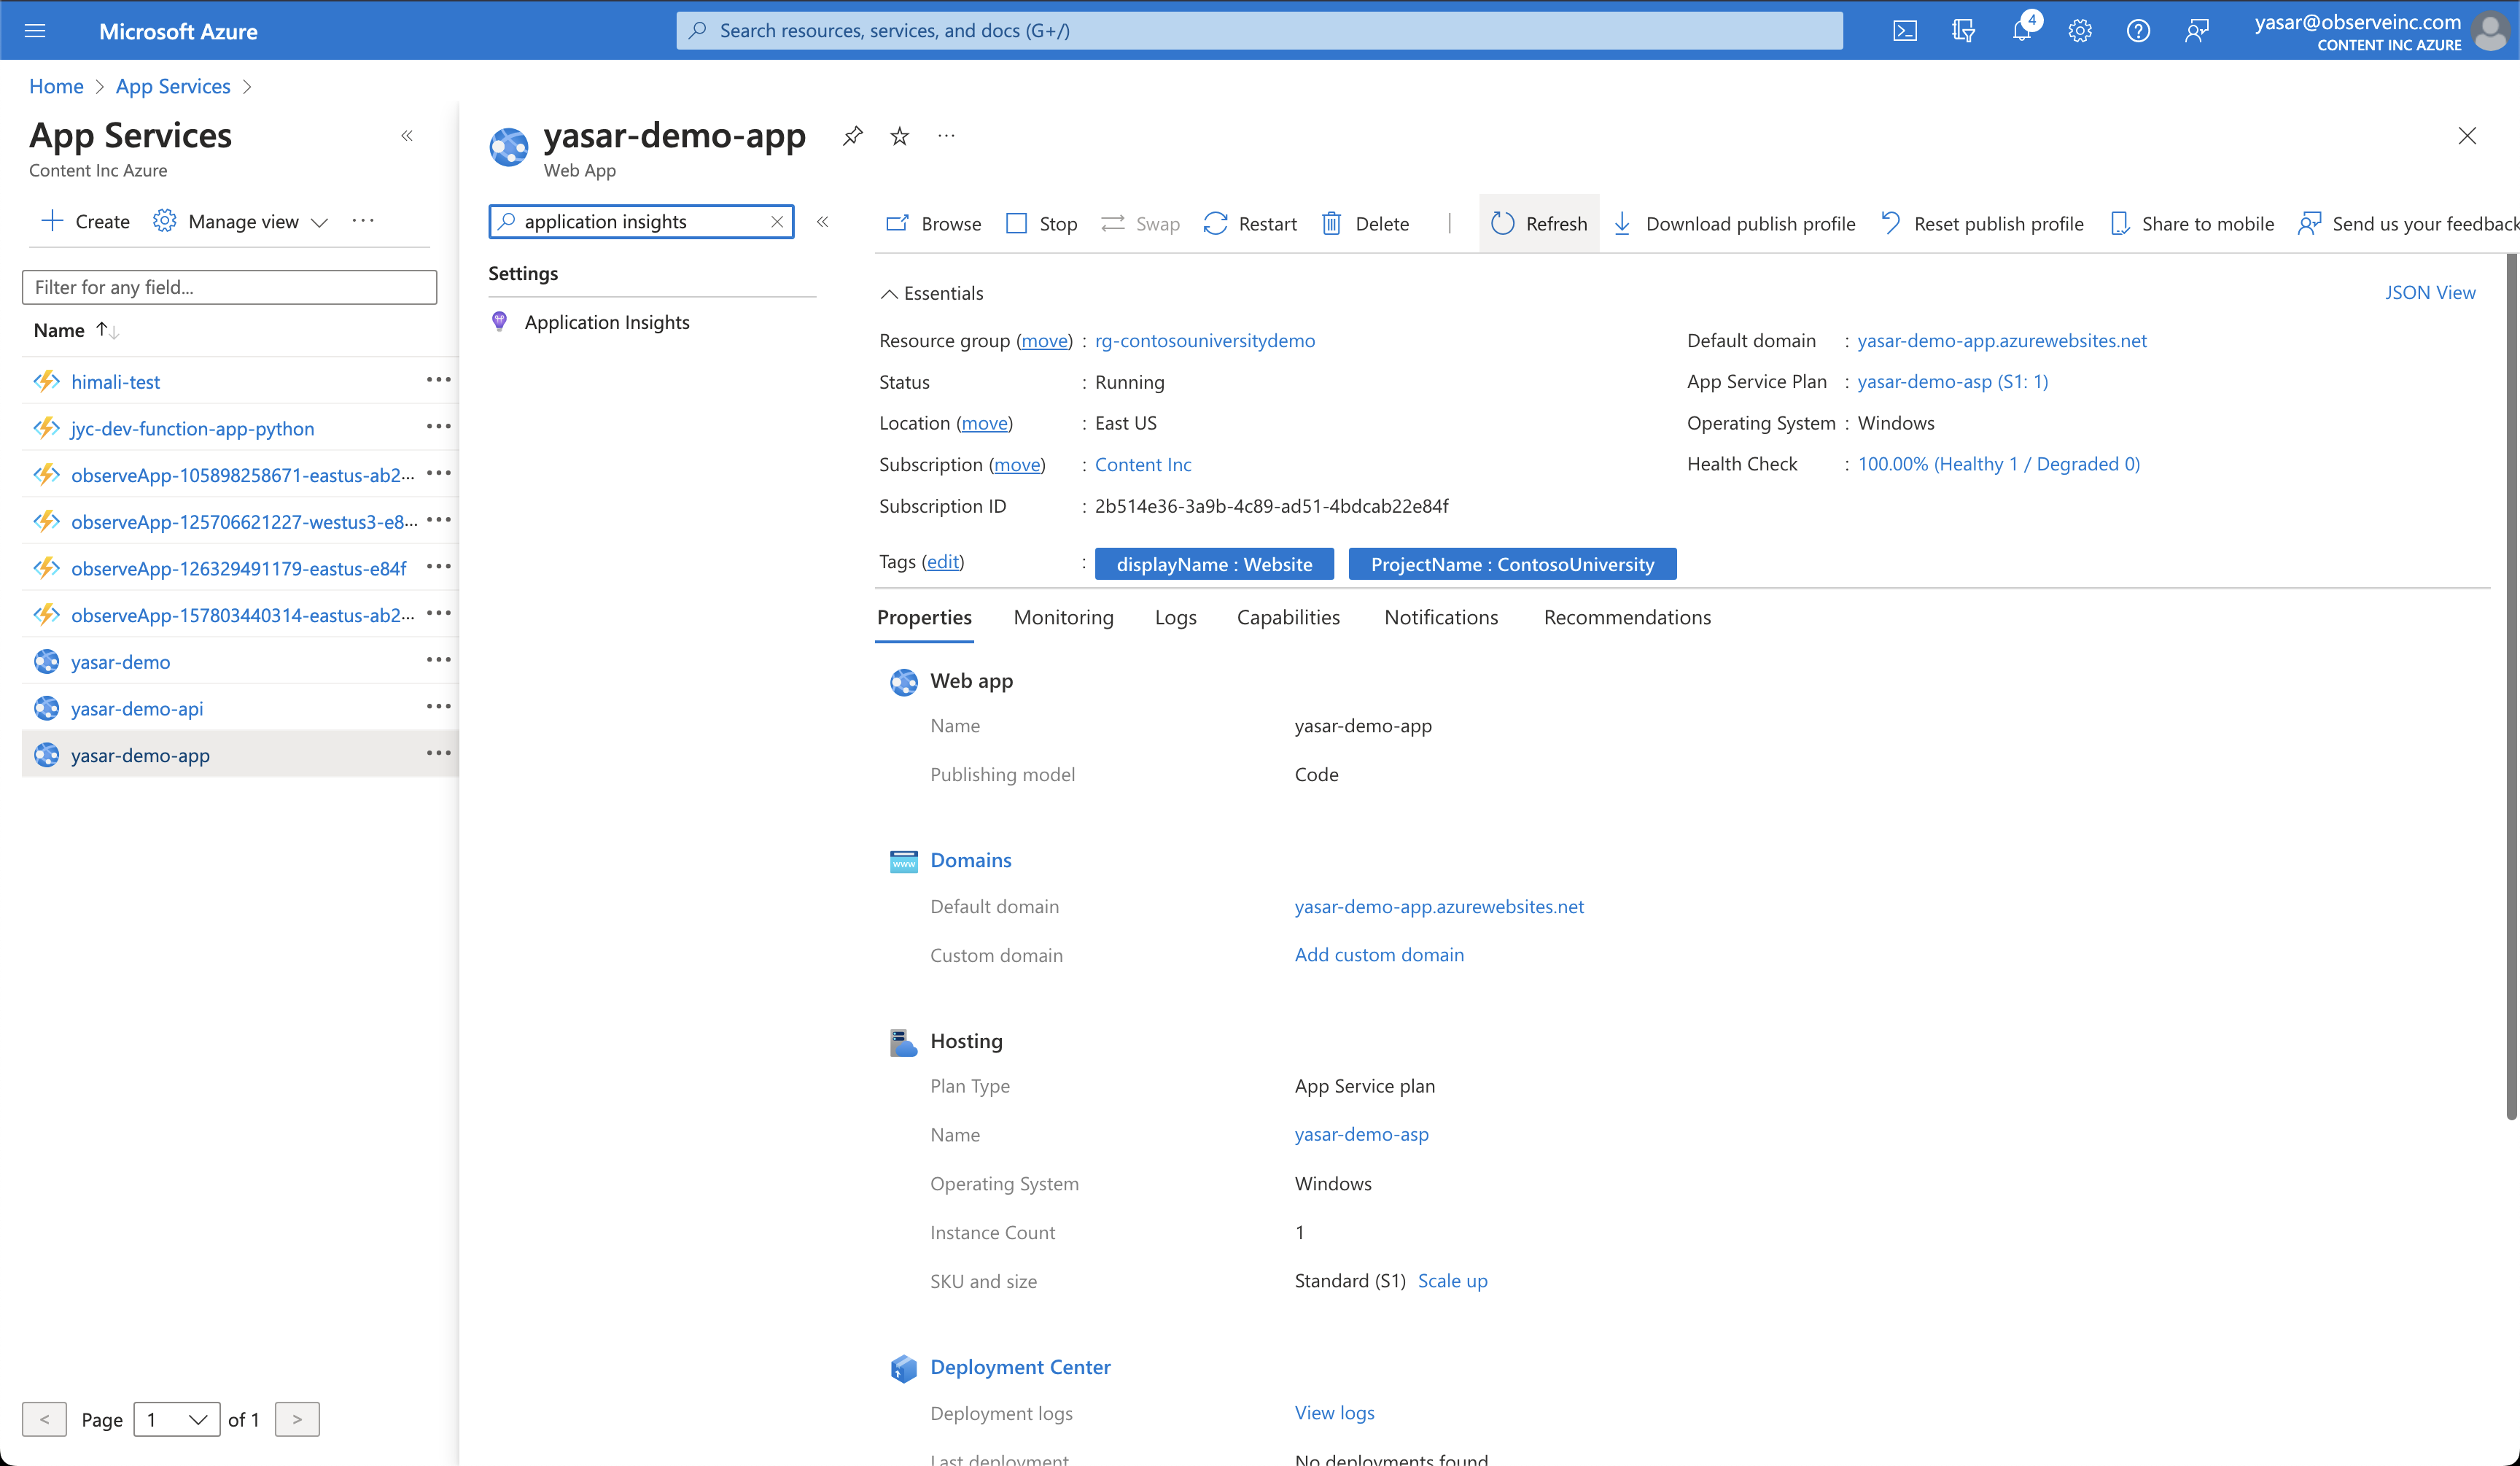
- Click View Application Insights data.
- Search for Diagnostic settings and select it.
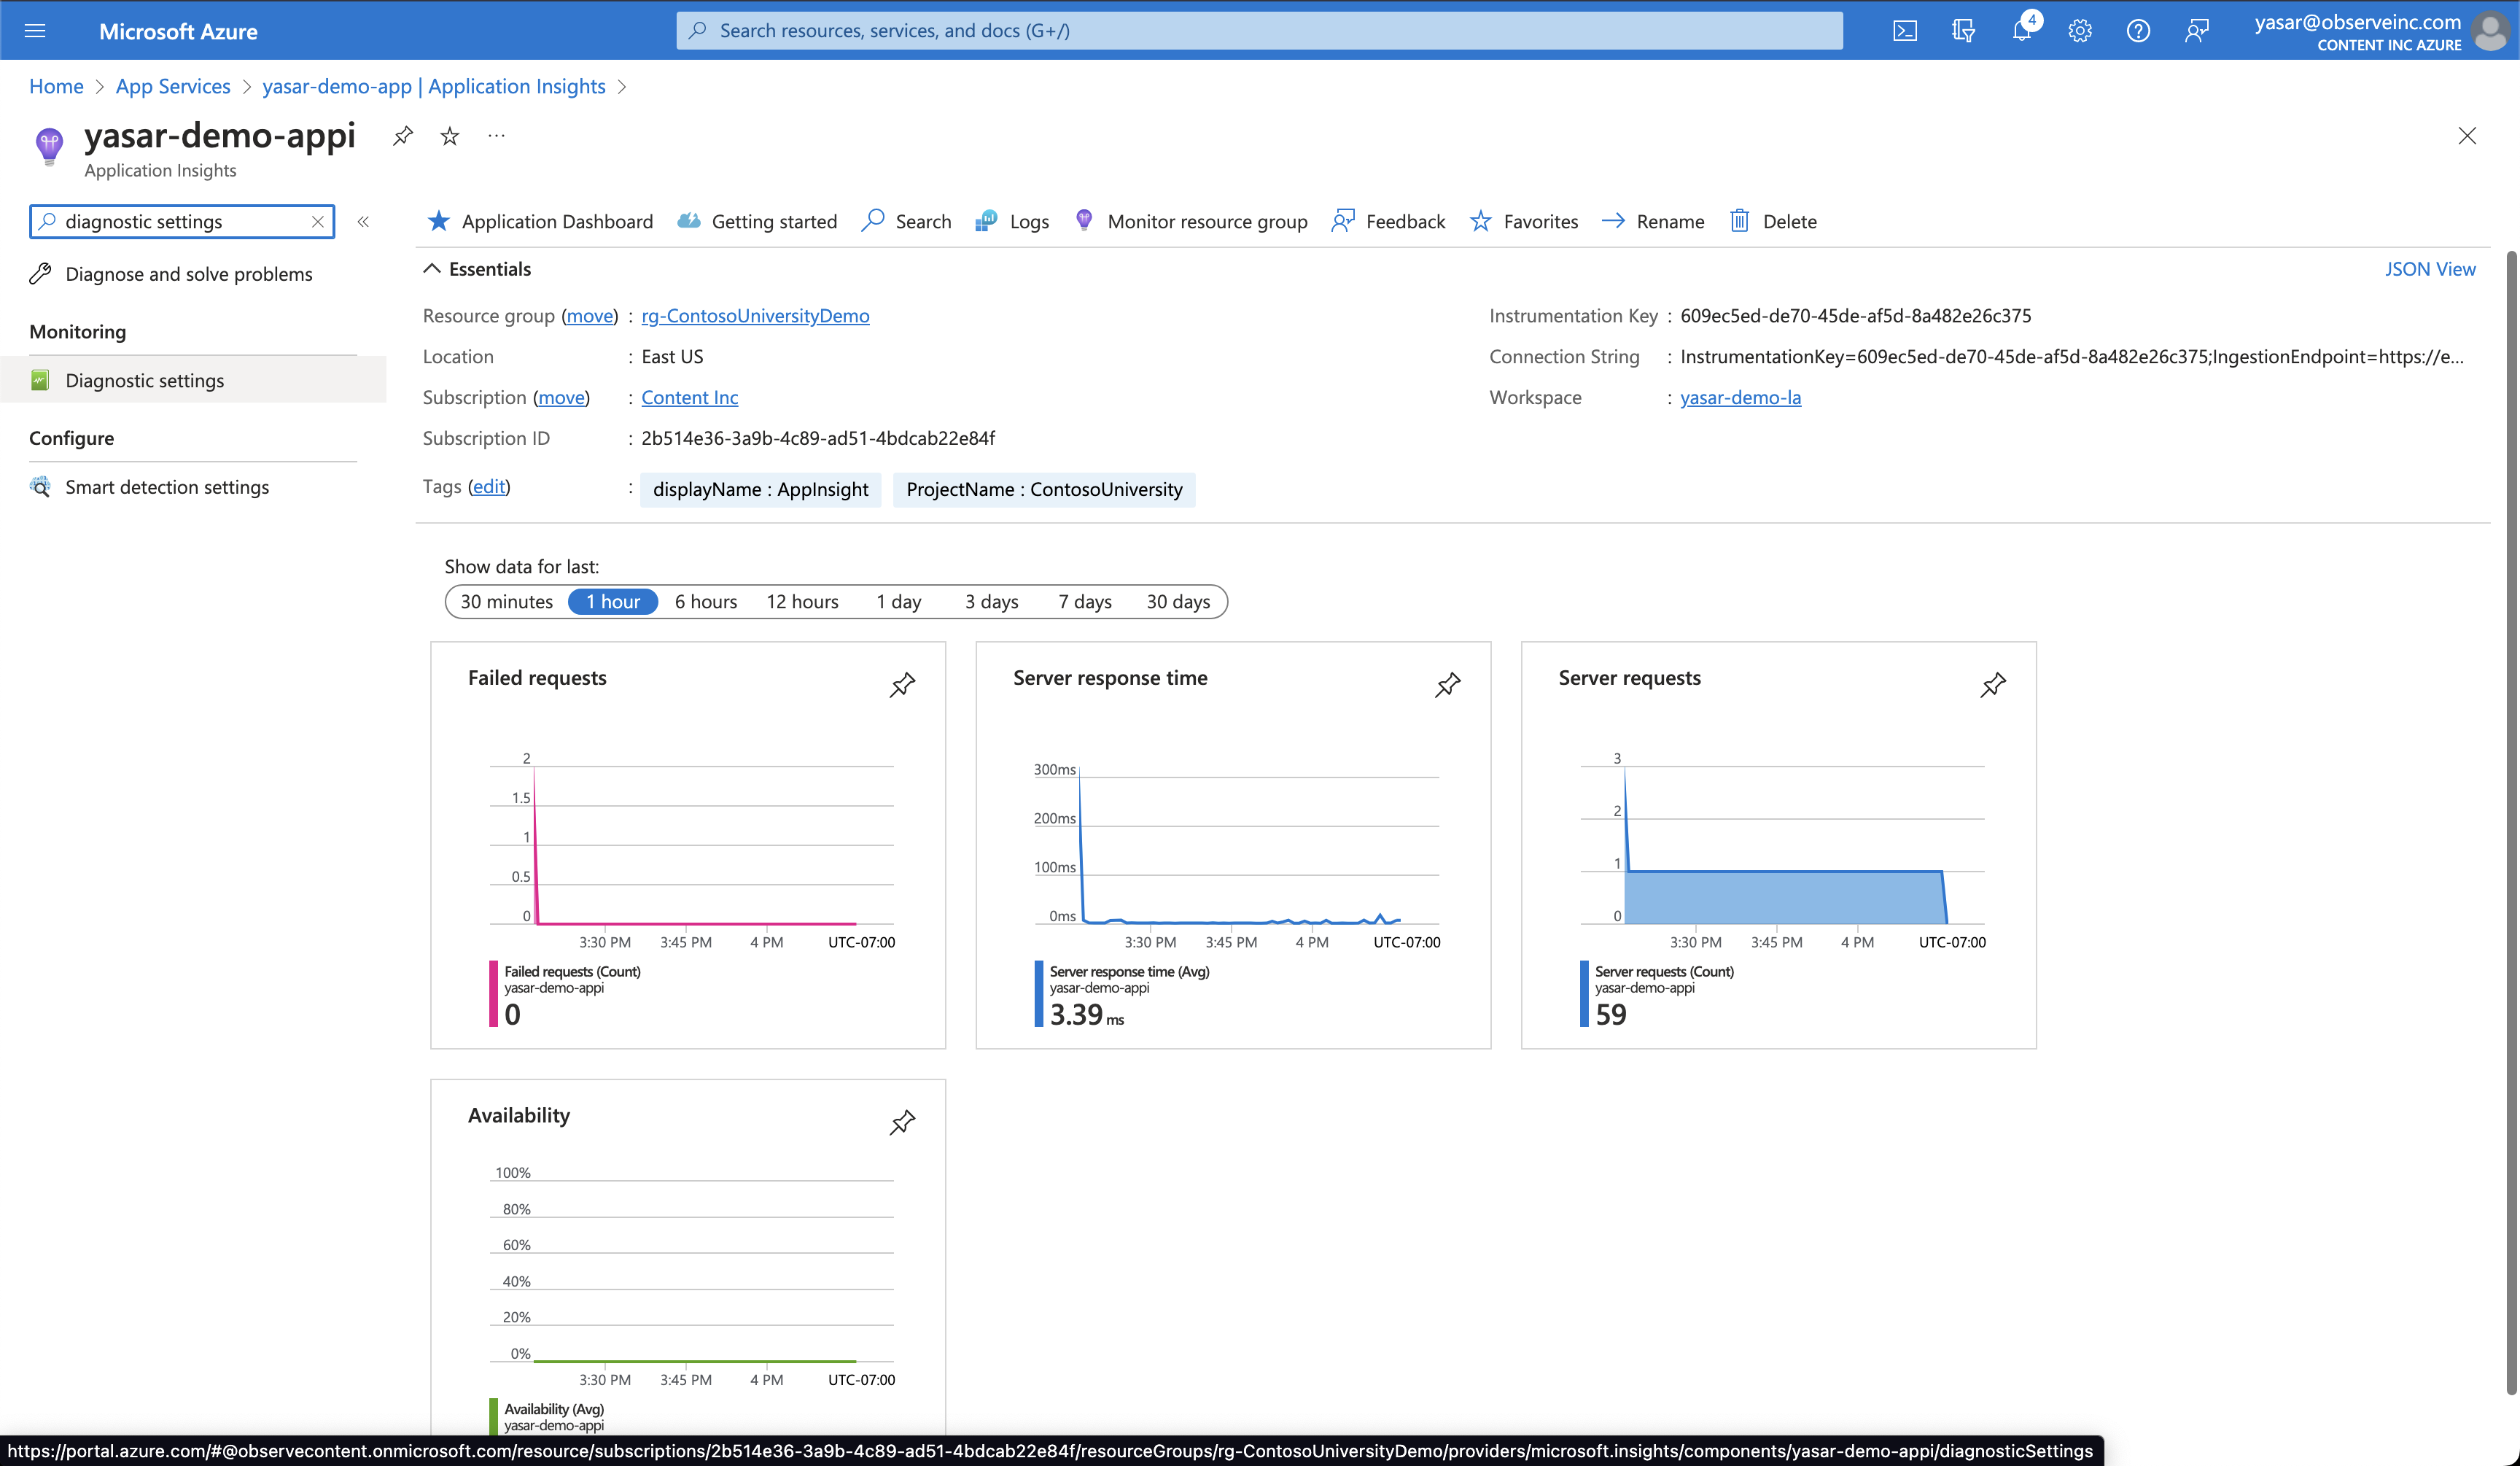
- Select Add diagnostic setting.
- Select the following options:
- Diagnostic setting name - Observe
- All logs
- All Metrics
- Stream to an event hub
- Select the event hub created by the Observe collection function.
- Click Save.

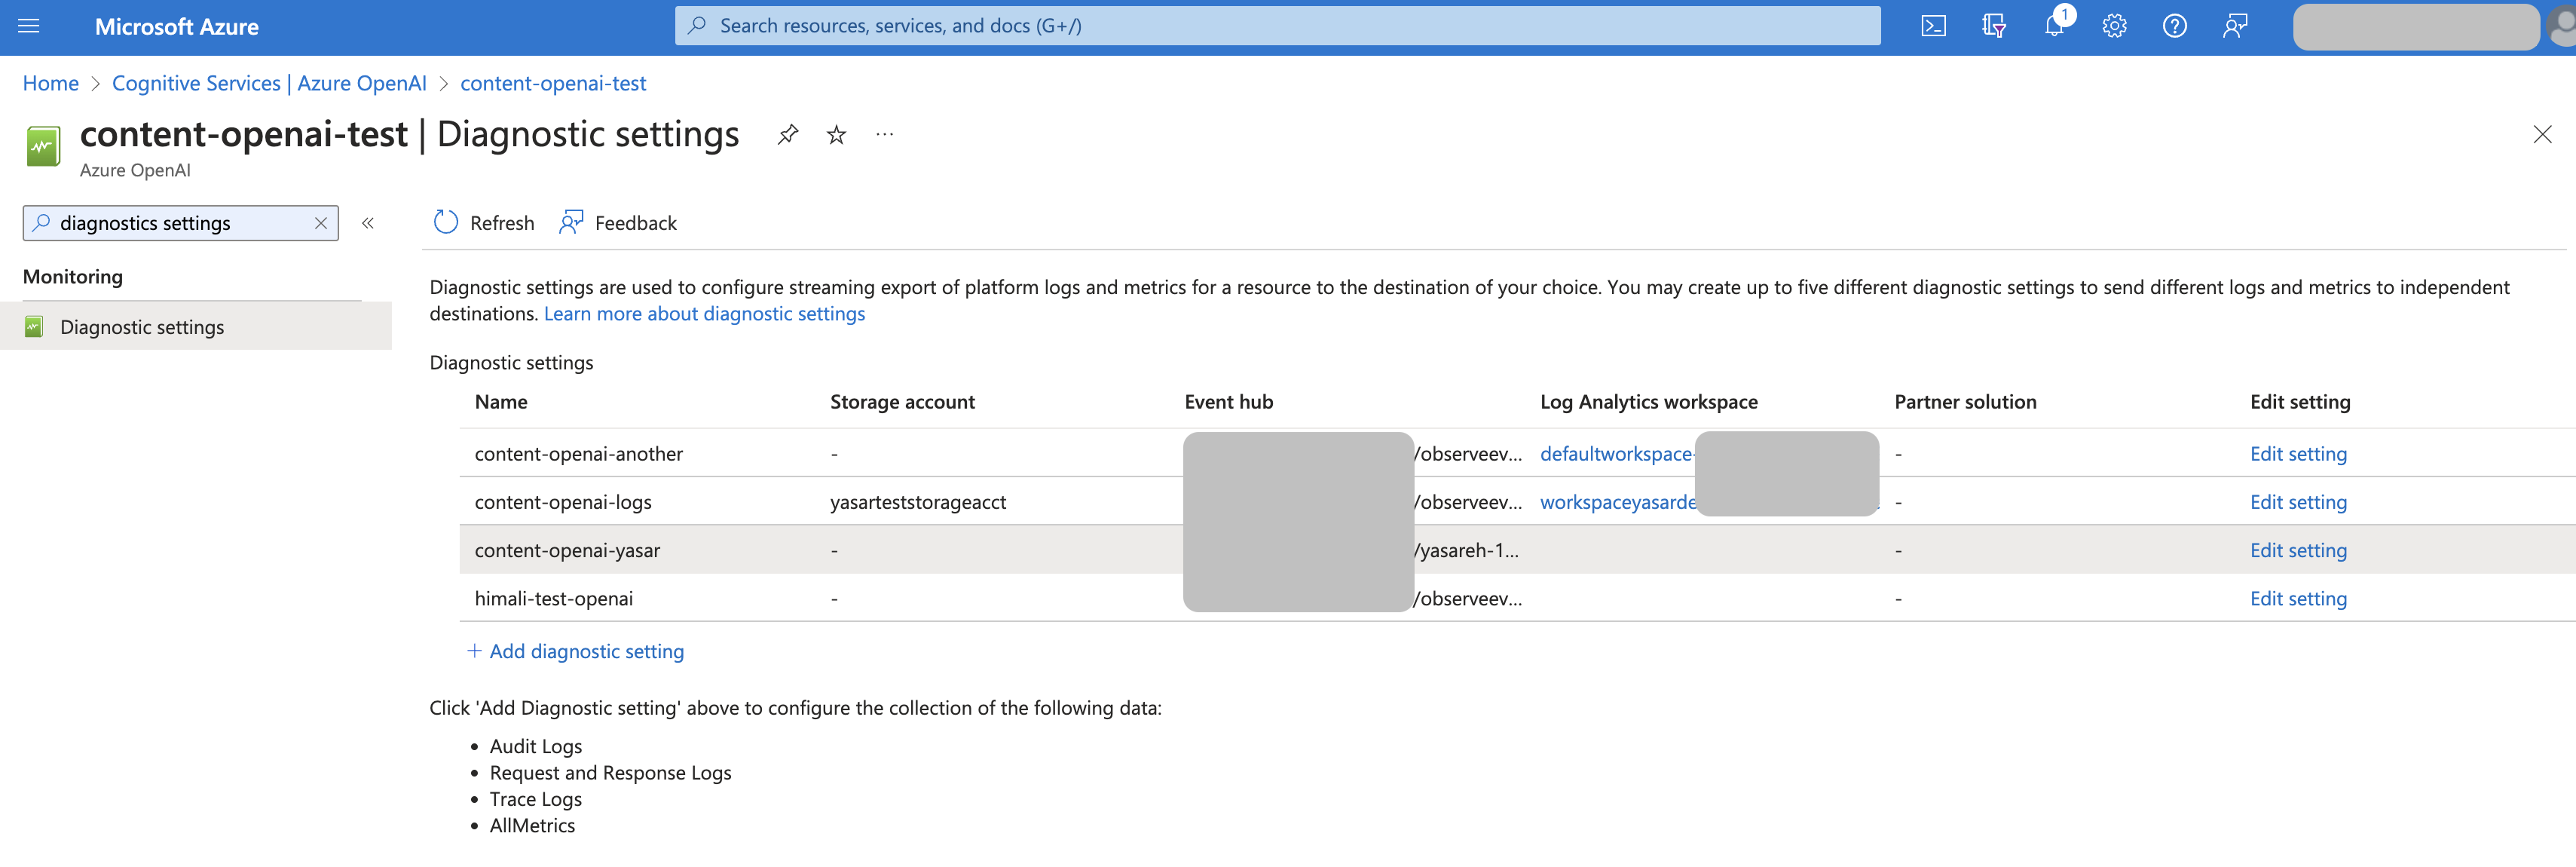
Azure Cognitive Services
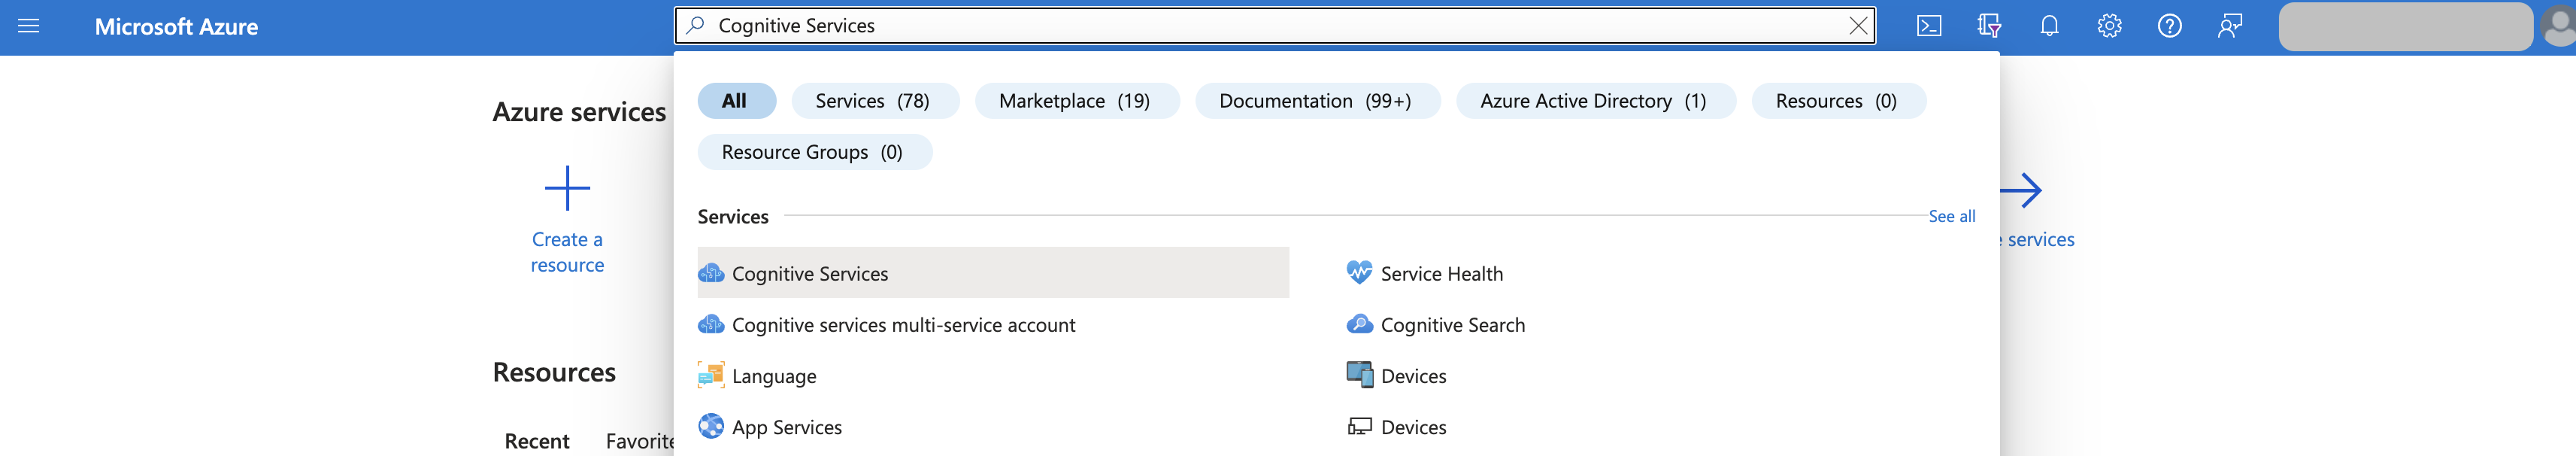
- Log into the Azure portal.
- Search for the Cognitive Services in the search field and select it.
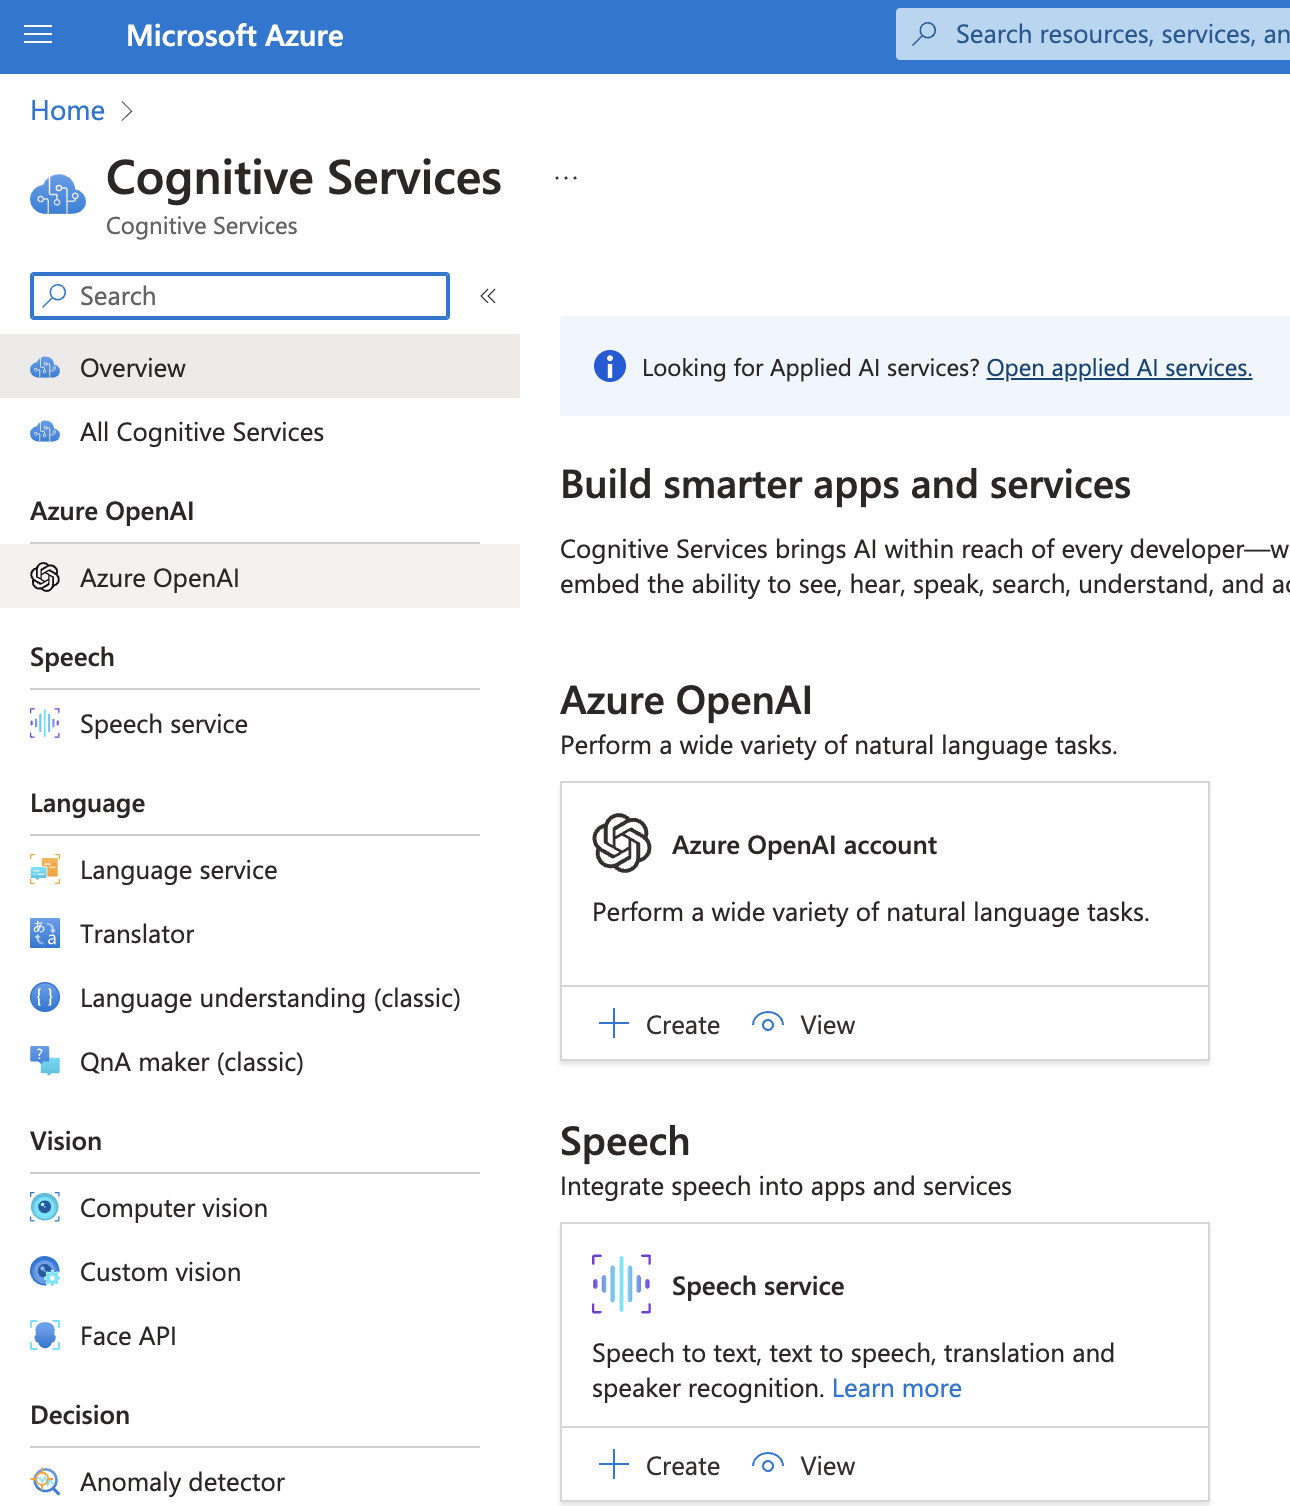
- Select the Cognitive Service Type you want to monitor.
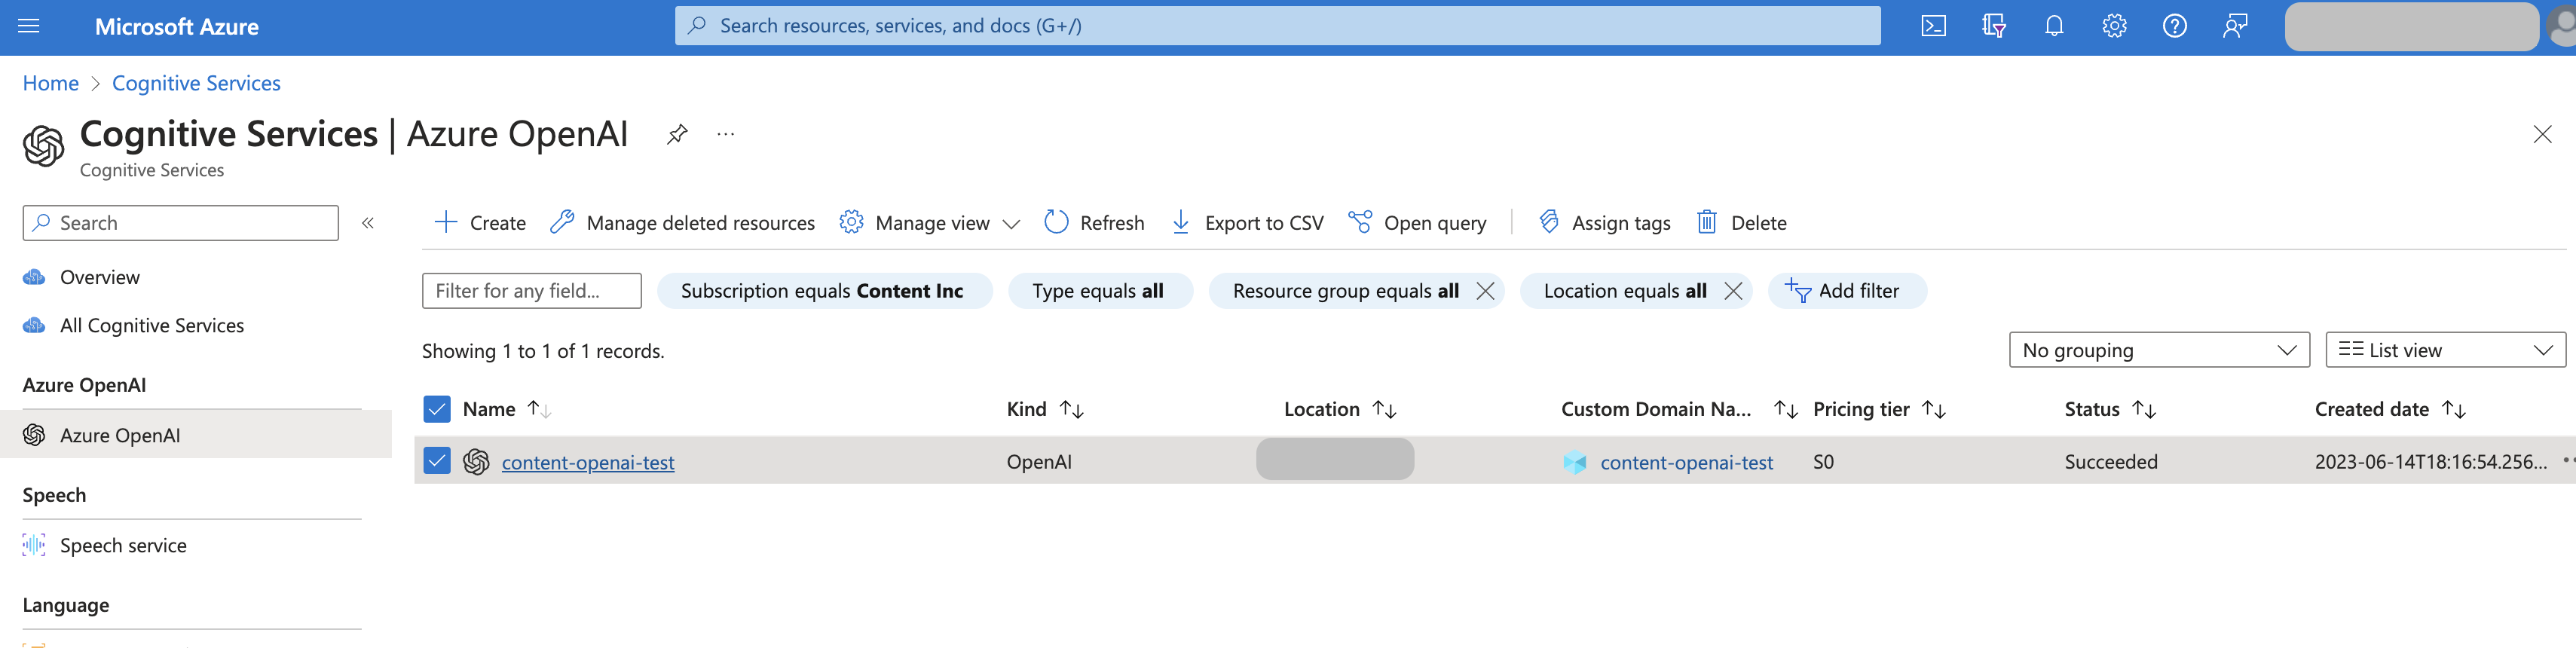
- Select the Cognitive Service you want to monitor.
- Search for Diagnostic settings and select it.
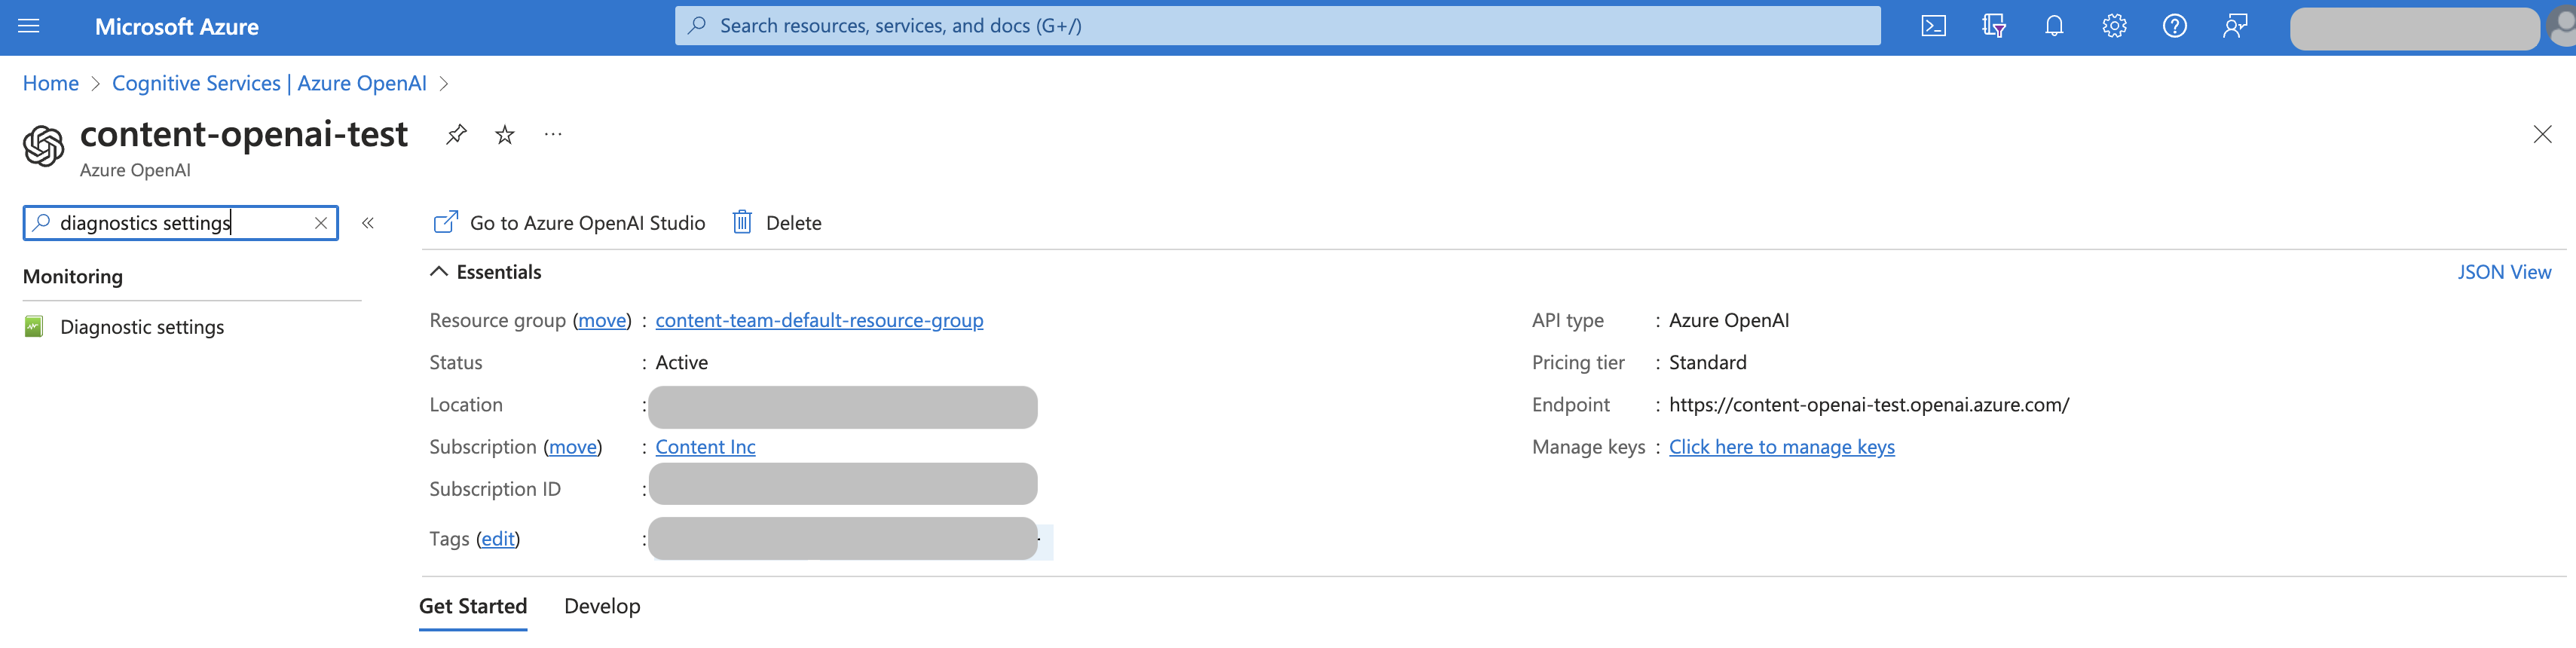
- Select Add diagnostic setting.
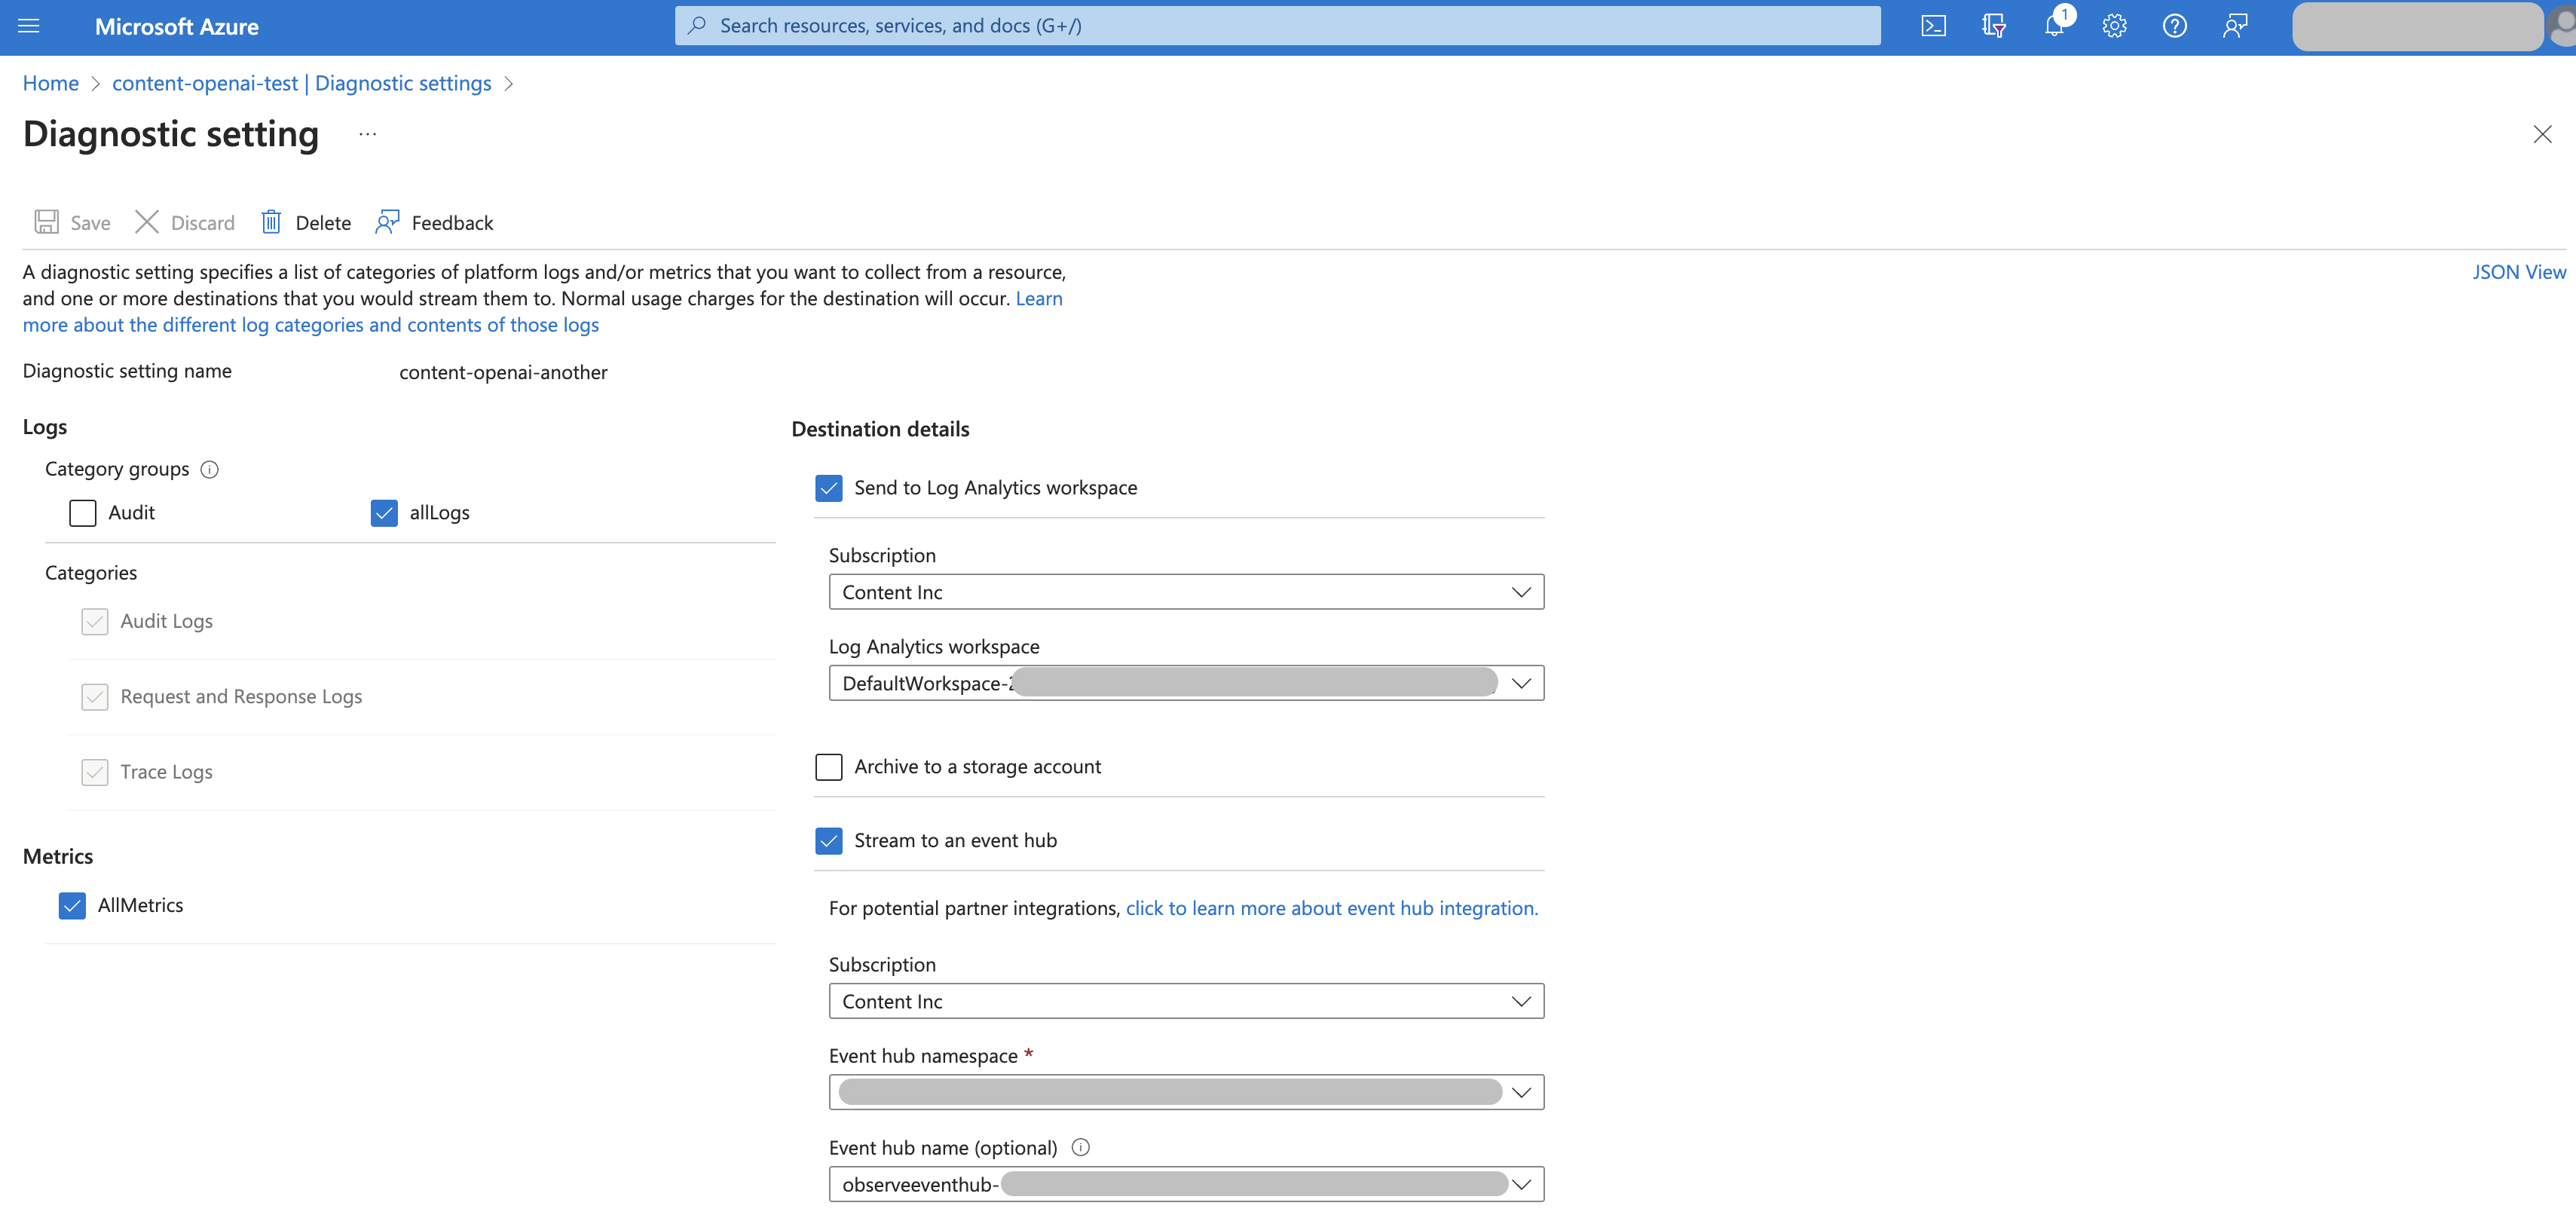
- Select the following options:
- Diagnostic setting name - Observe
- All Logs
- All Metrics
- Stream to an event hub
- Select the event hub created by the Observe collection function.
- Click Save.
Azure Functions
- Log into the Azure portal.
- Search for the Function App in the search field and select the Function App.
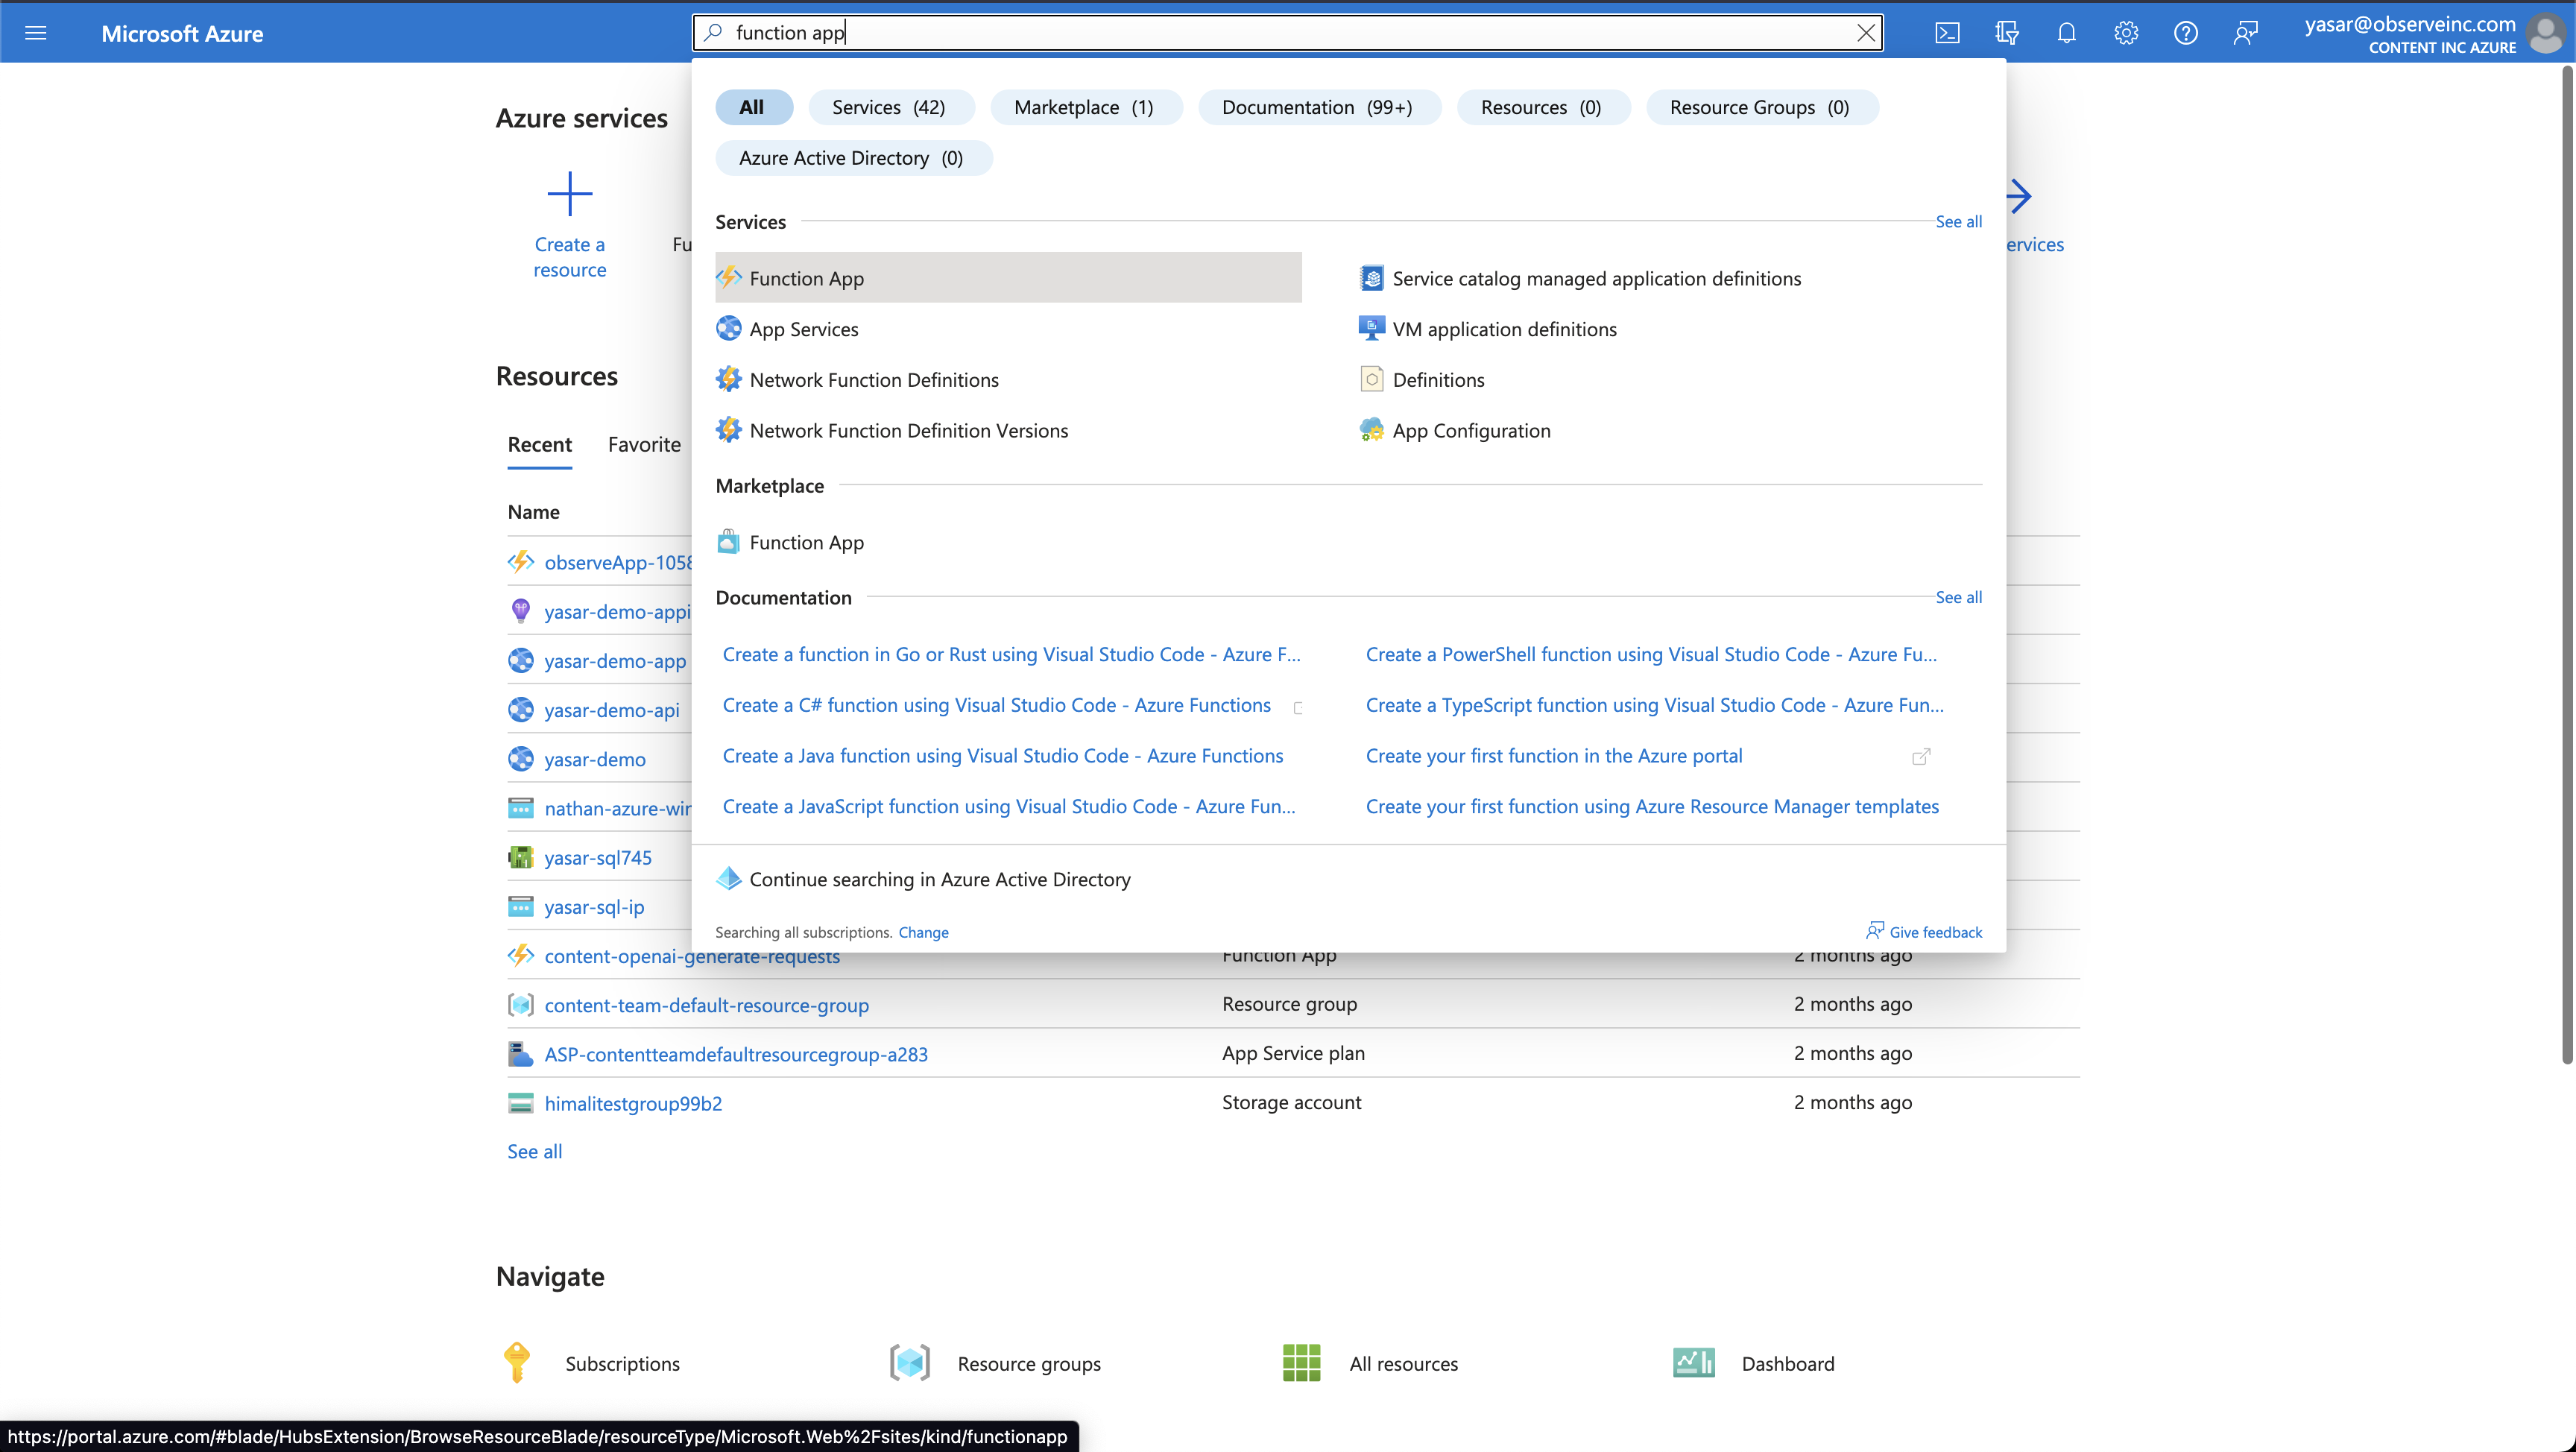
- Select the Function App you want to monitor.
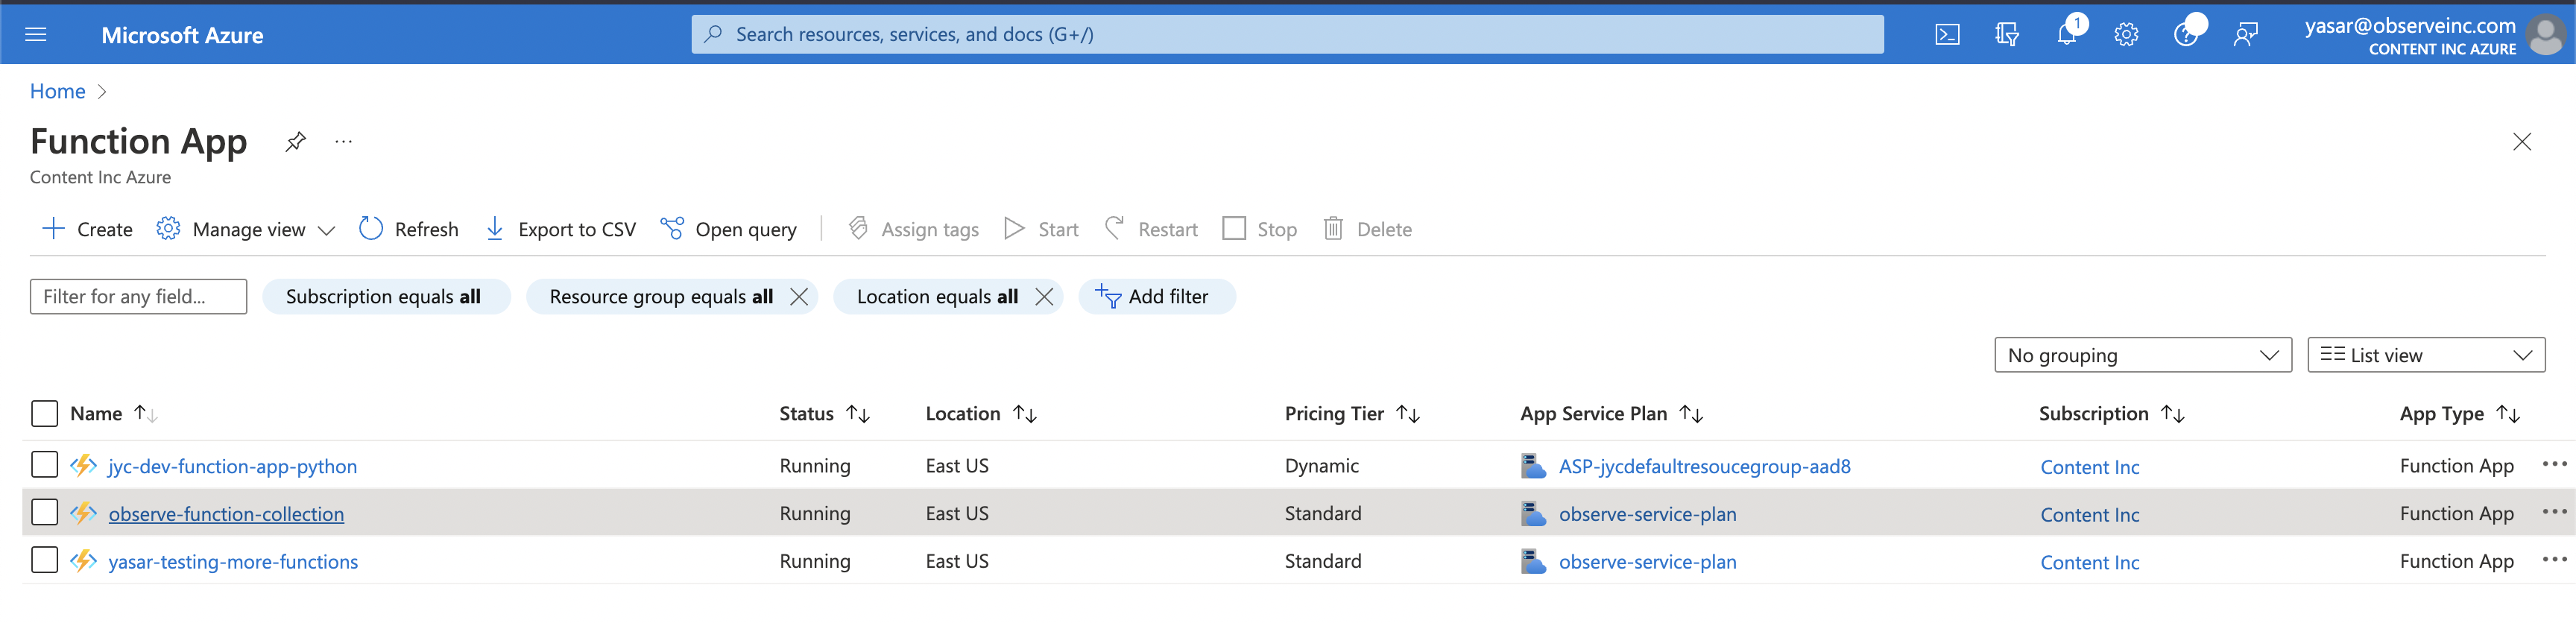
- Search for Diagnostic settings and select it.
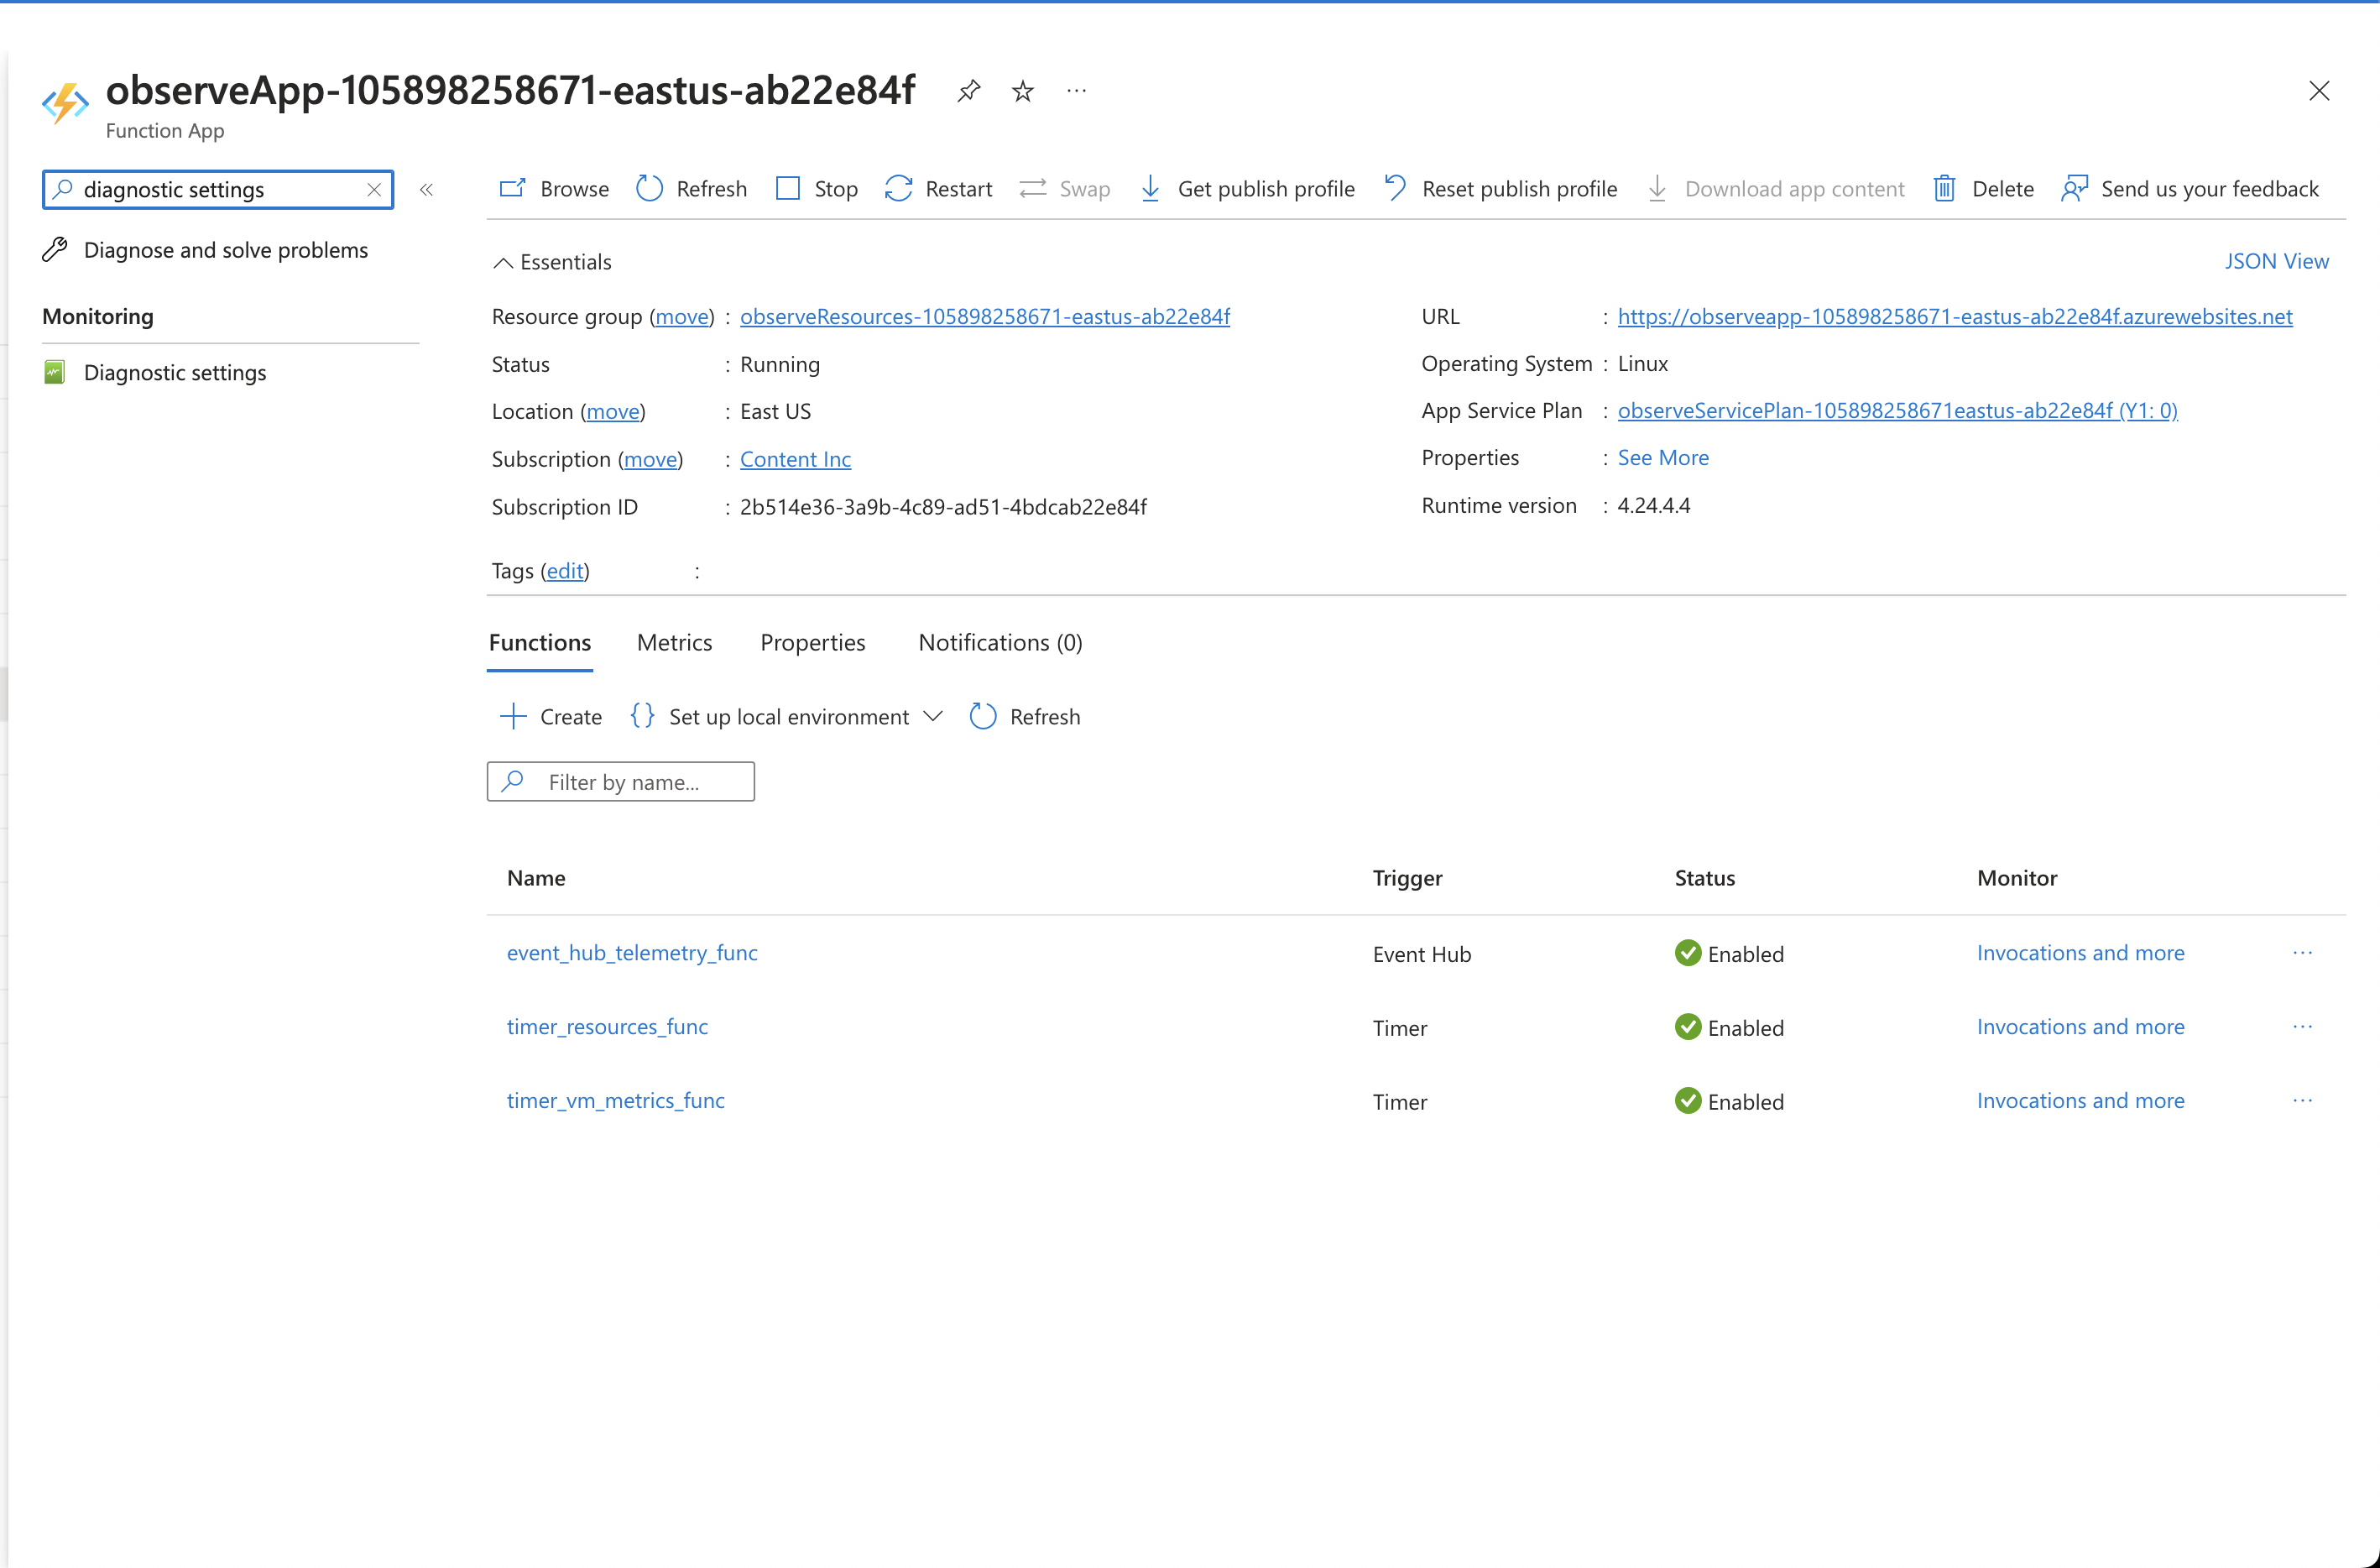
- Select Add diagnostic setting.
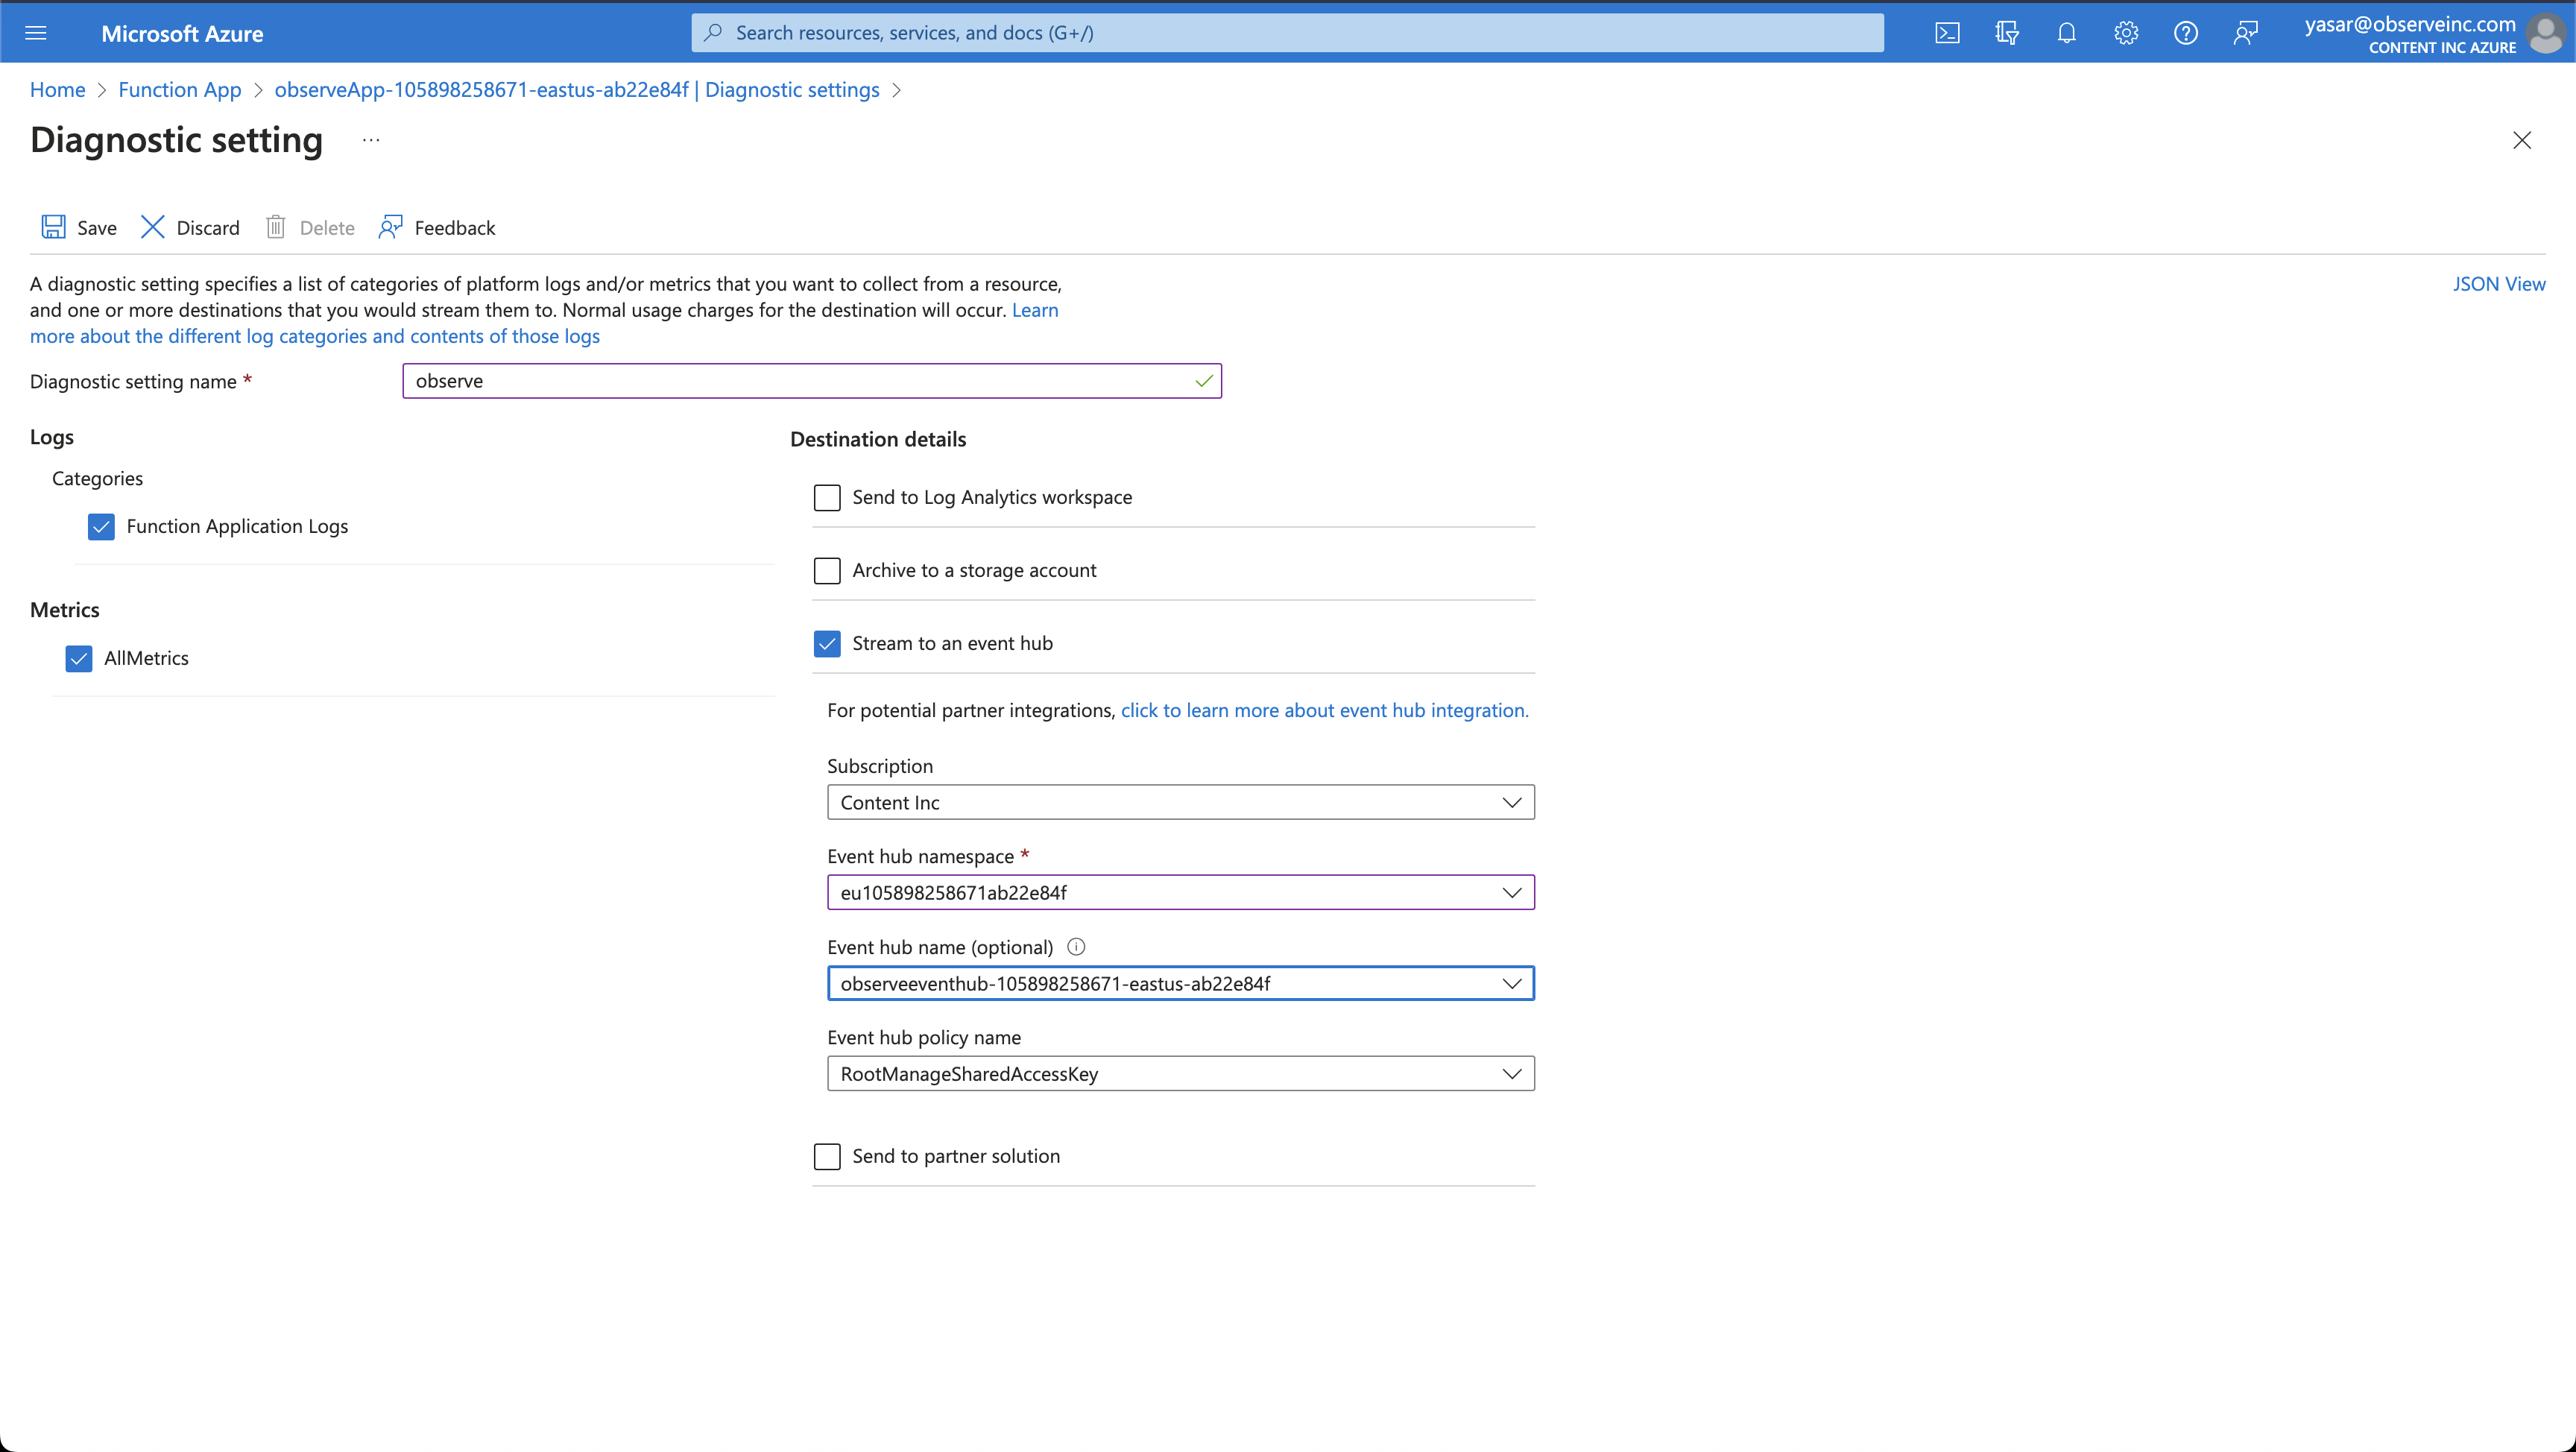
- Select the following options:
- Diagnostic setting name - Observe
- Function Application Logs
- All Metrics
- Stream to an event hub
- Select the event hub created by the Observe collection function.
- Click Save.
Azure SQL Database
- Log into the Azure portal.
- In the Azure search field, enter SQL Database.
- Select your database.
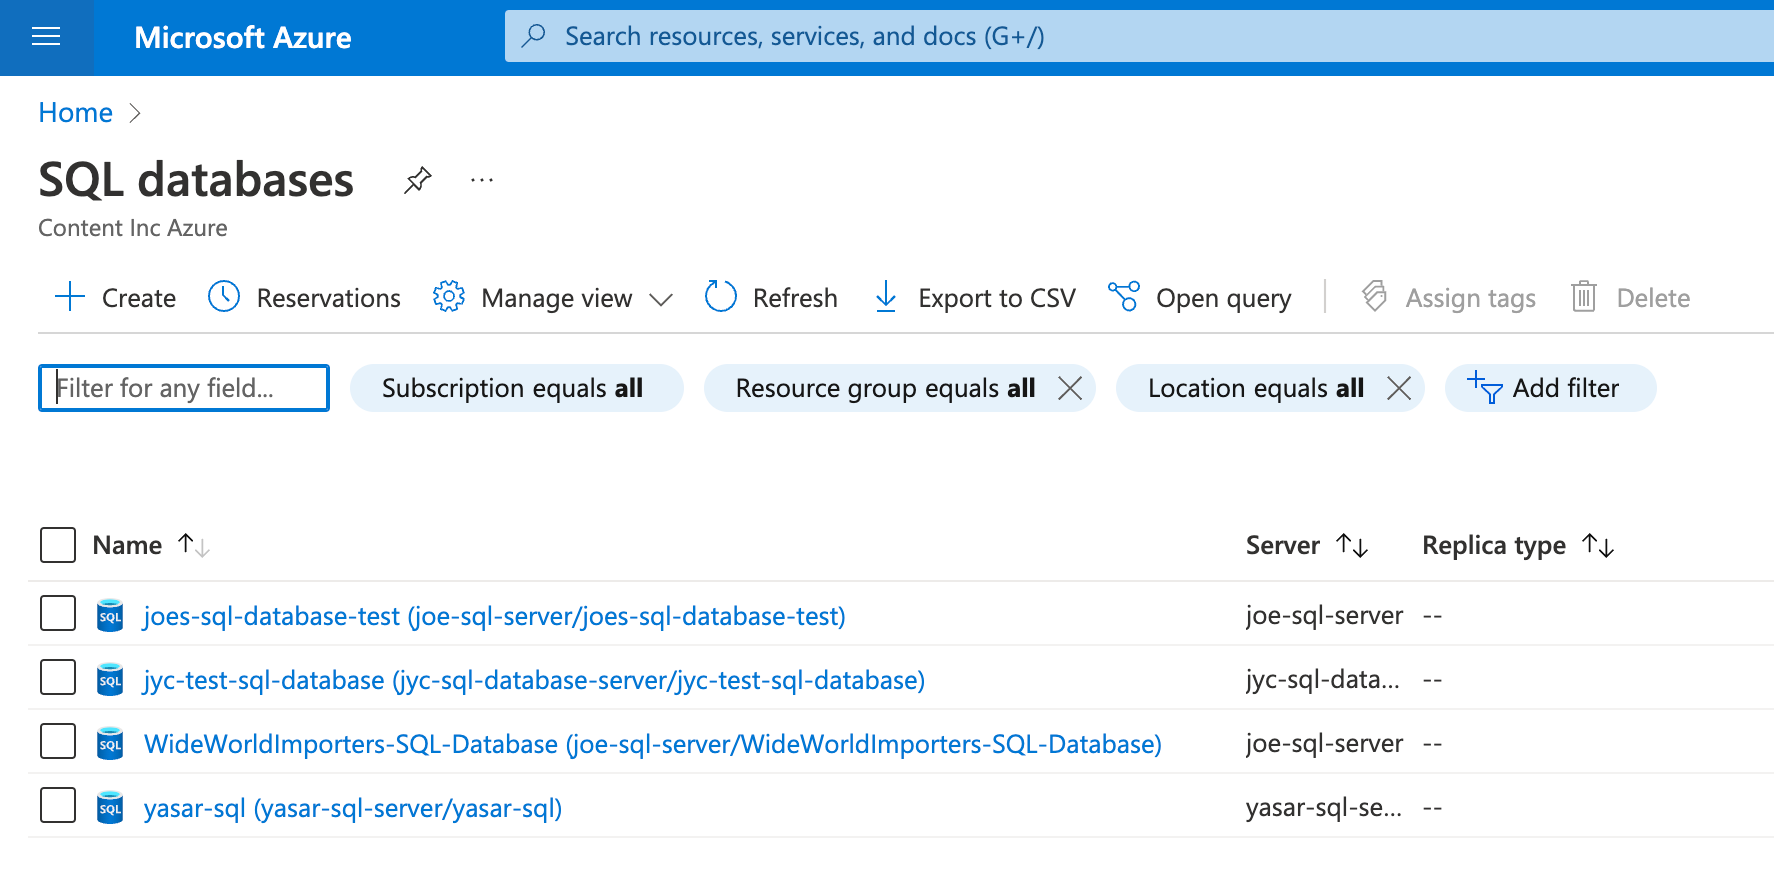
- From the left menu, choose Diagnostic Settings and click Add diagnostic setting.
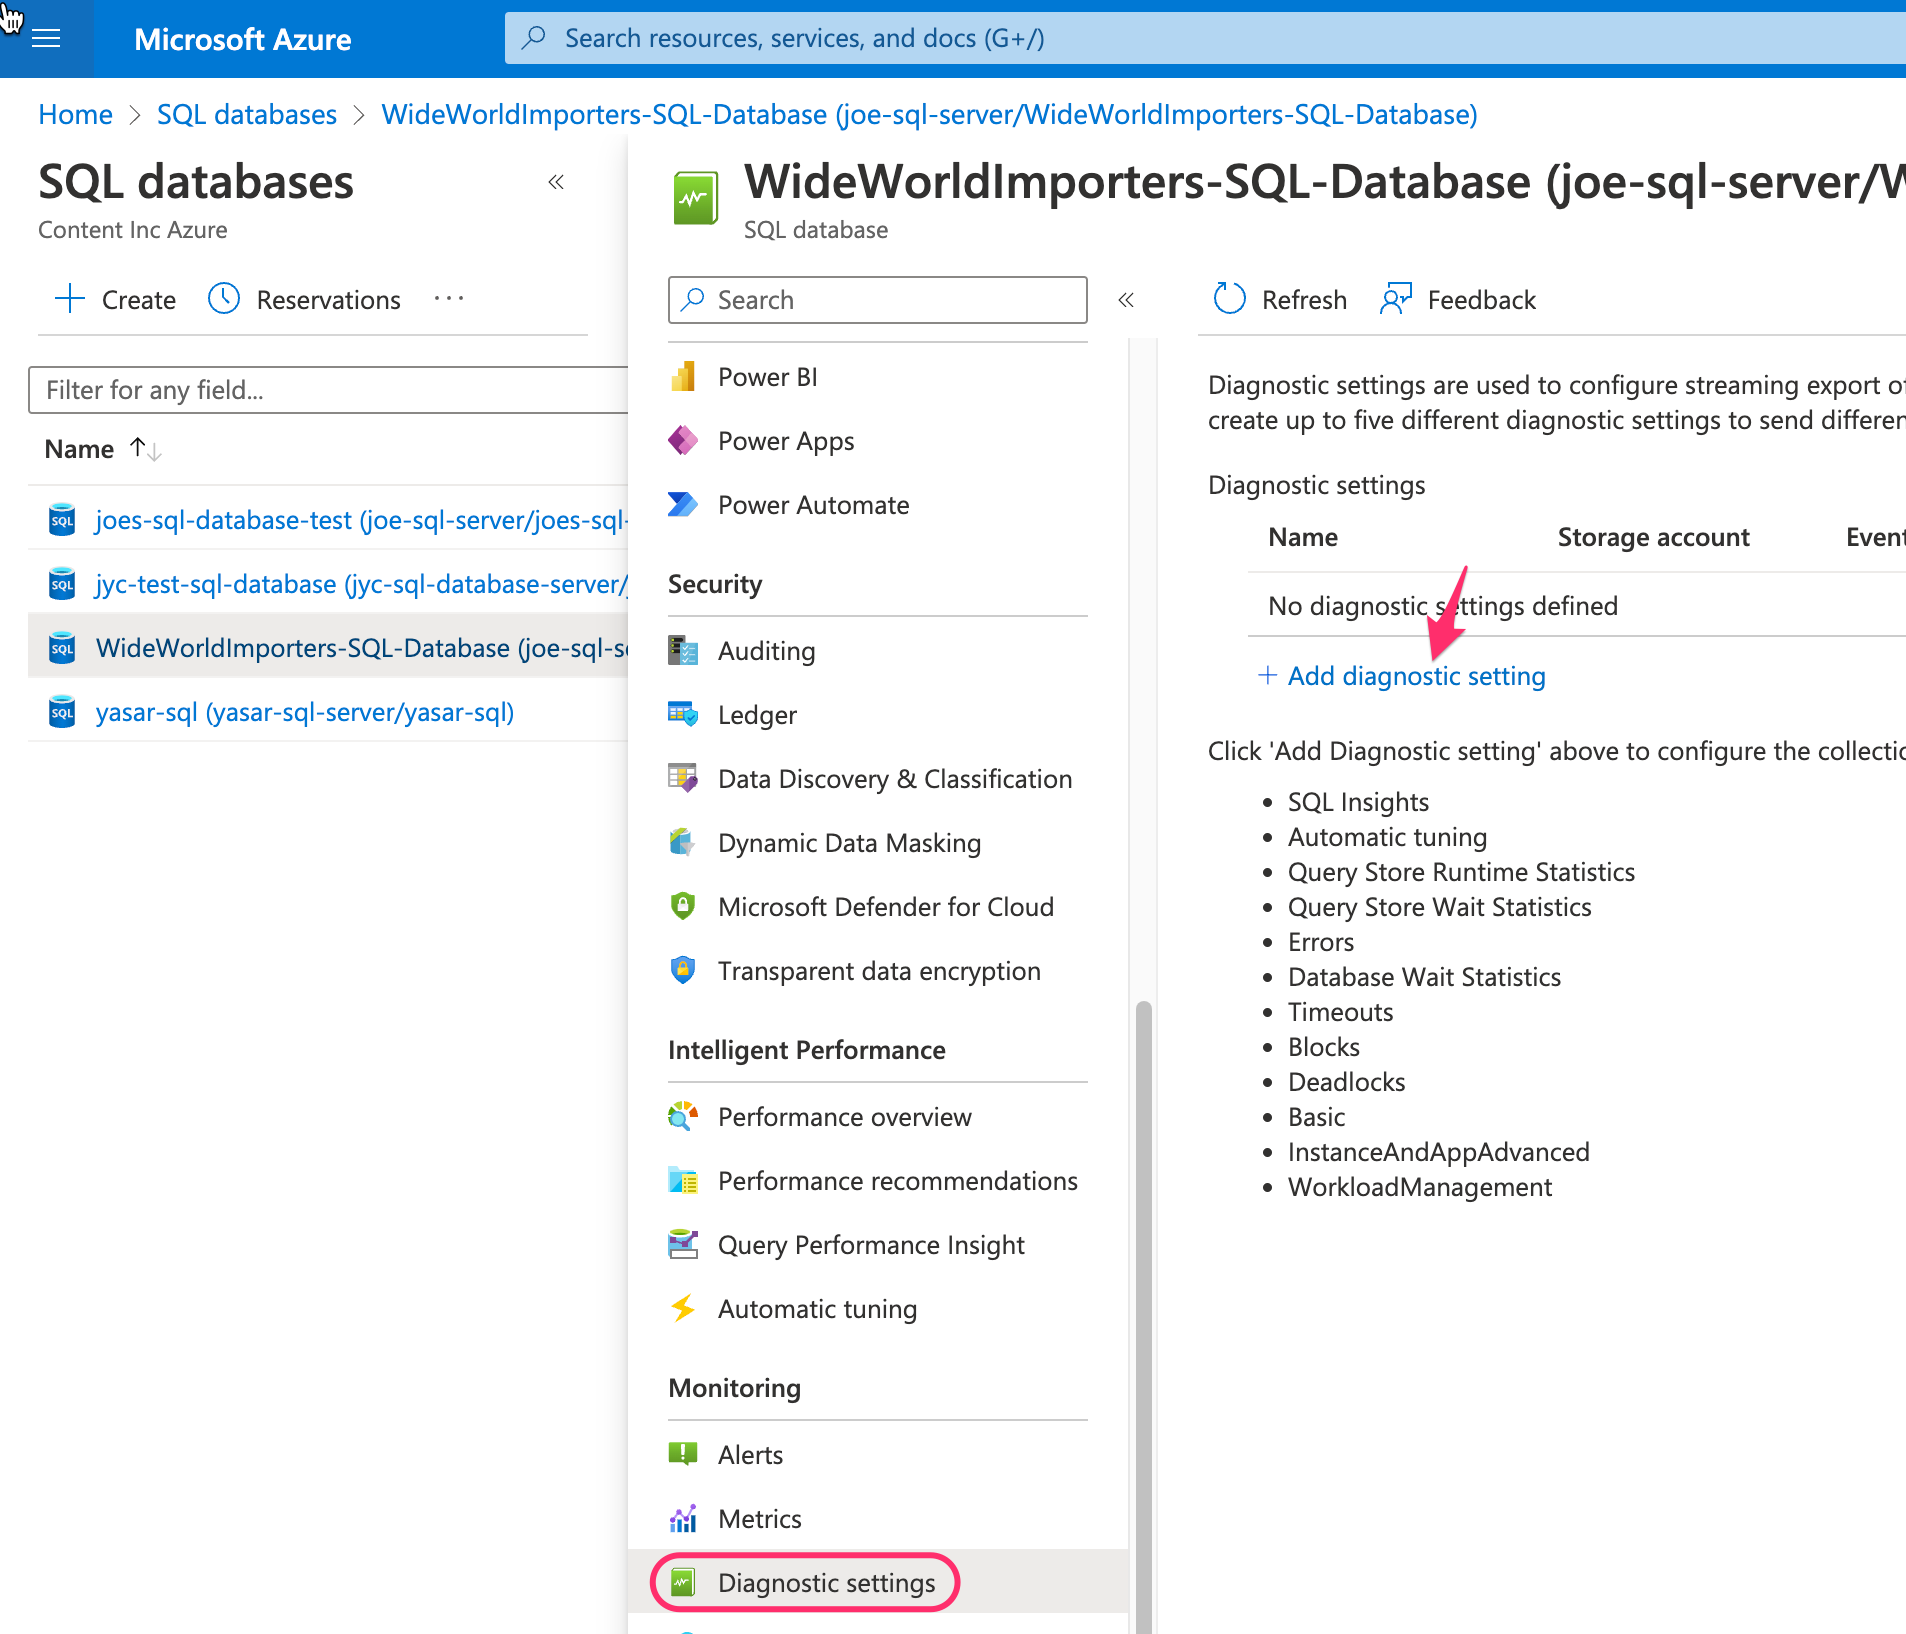
- Choose all Logs, Audit Logs, and all Metrics. Send to the event hub with your customer ID.
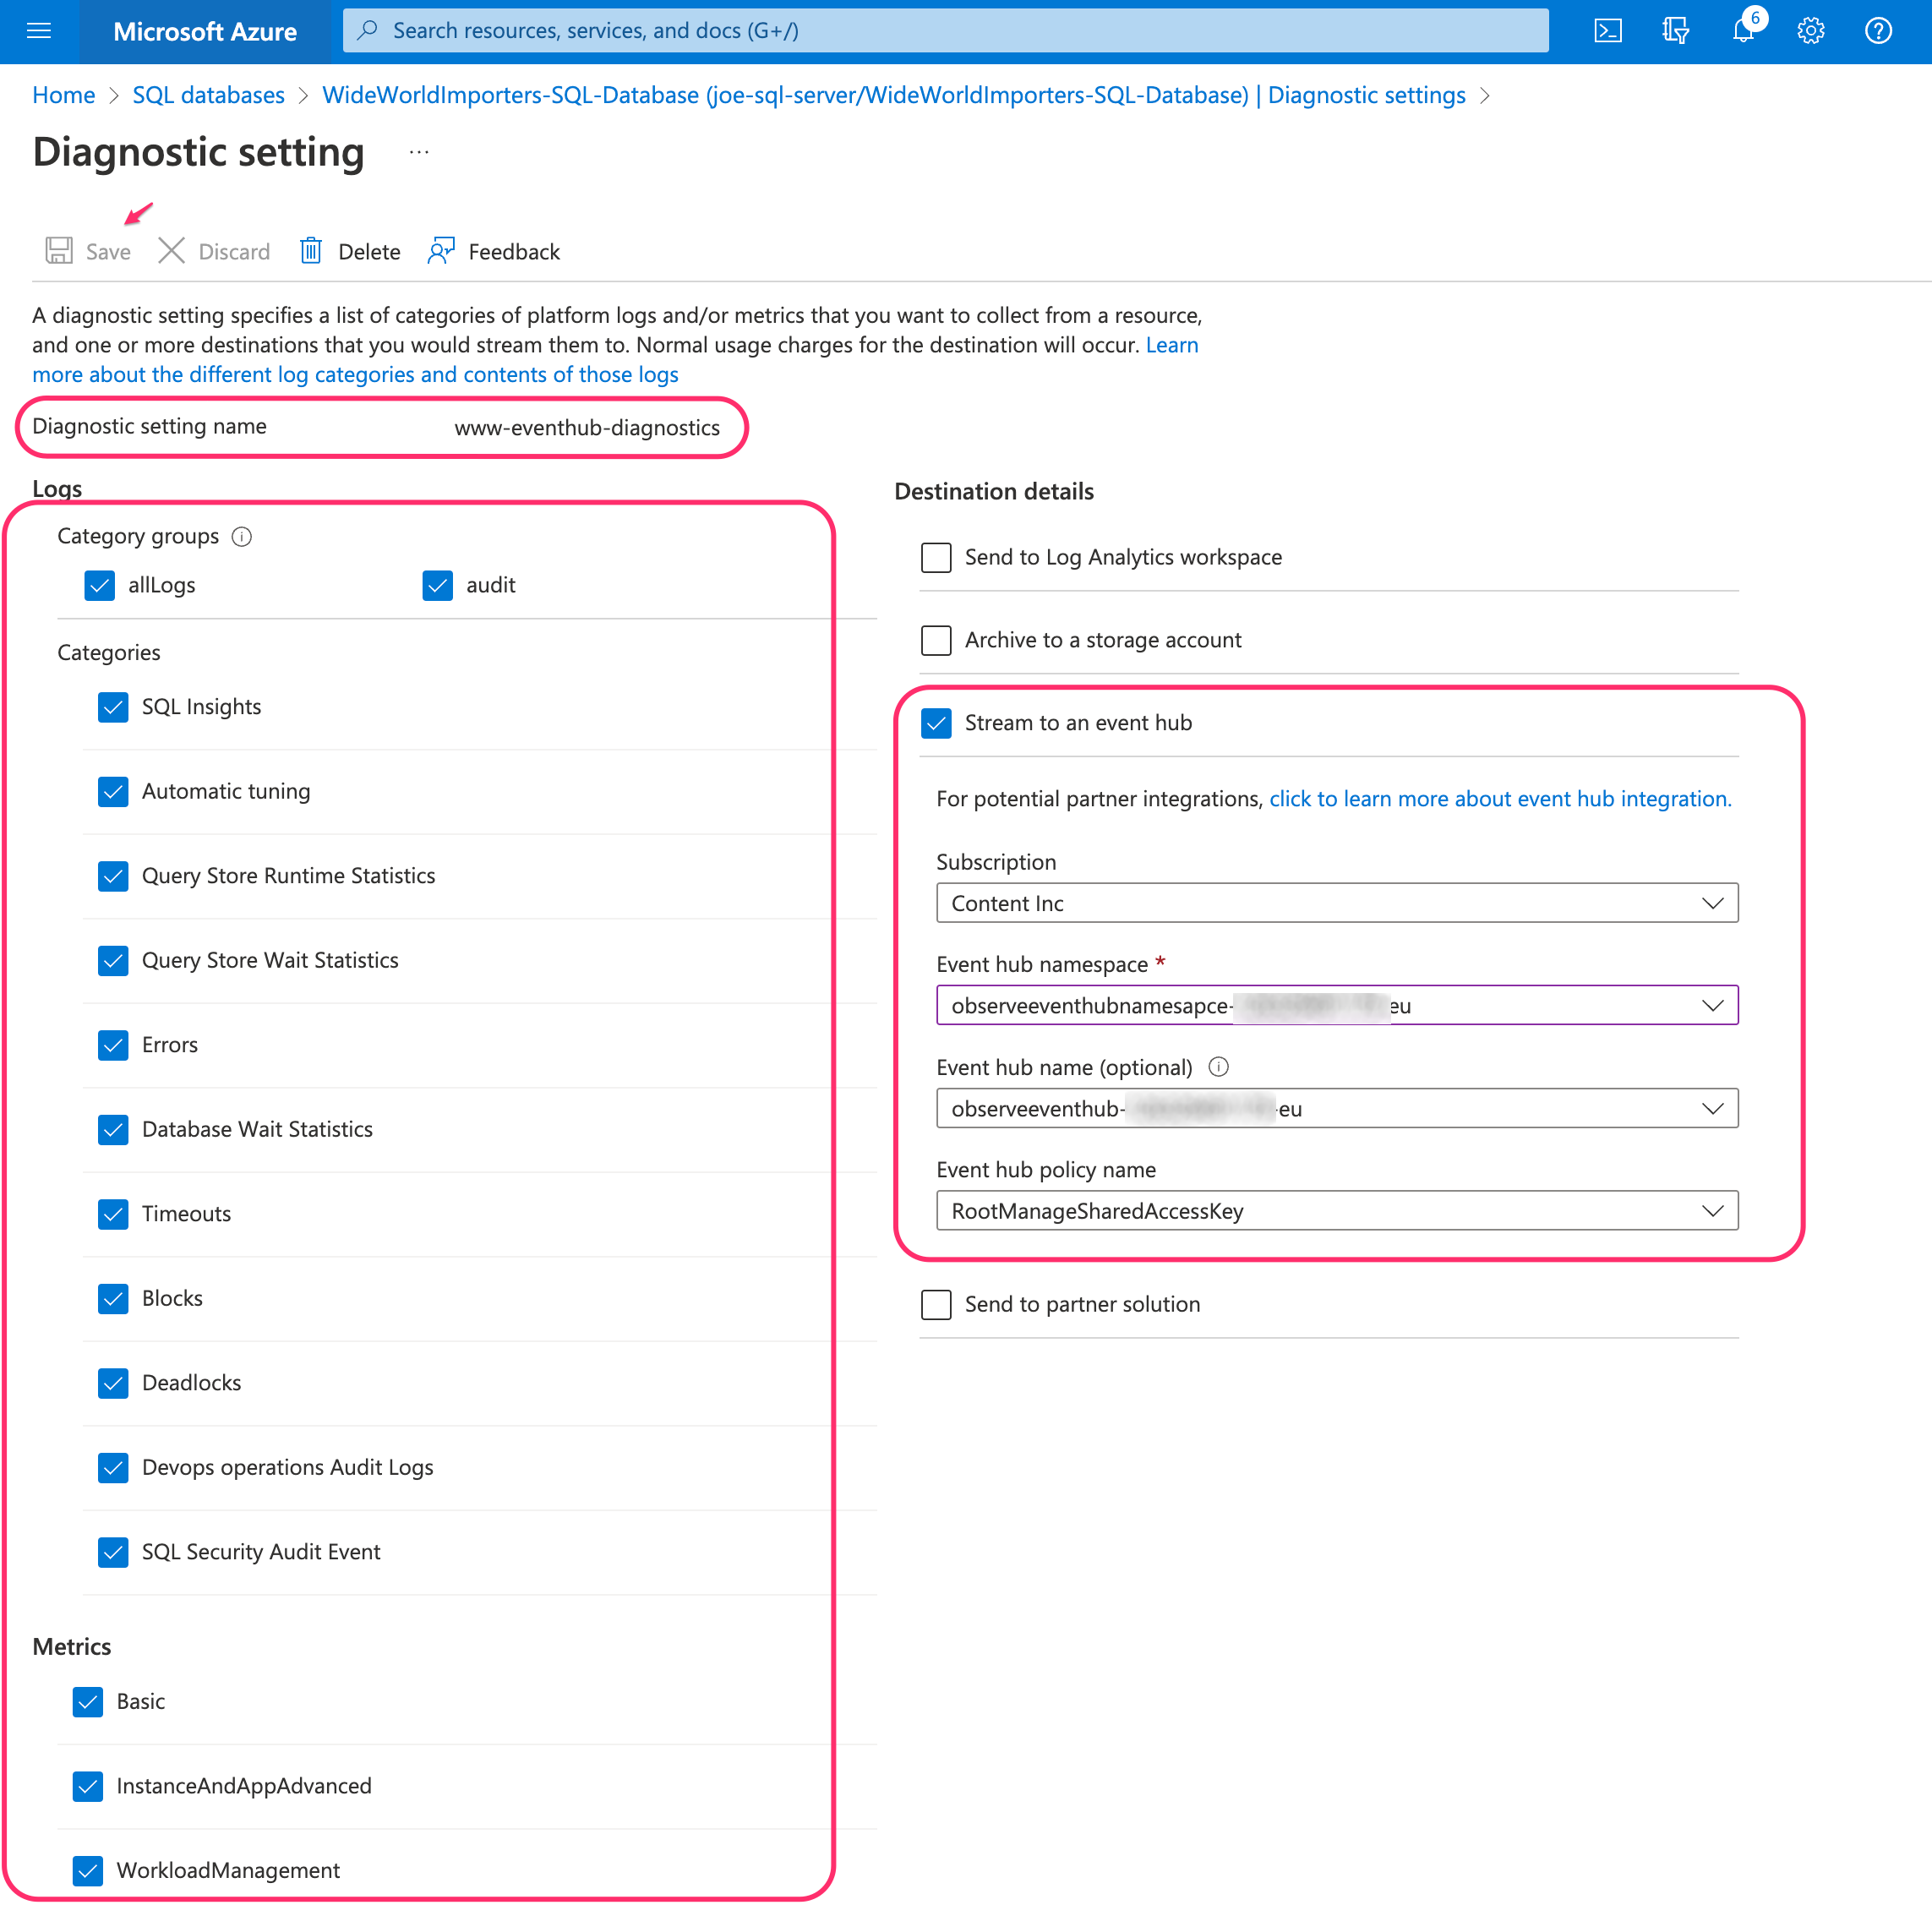
- Create a name for Diagnostic Setting and click Save.
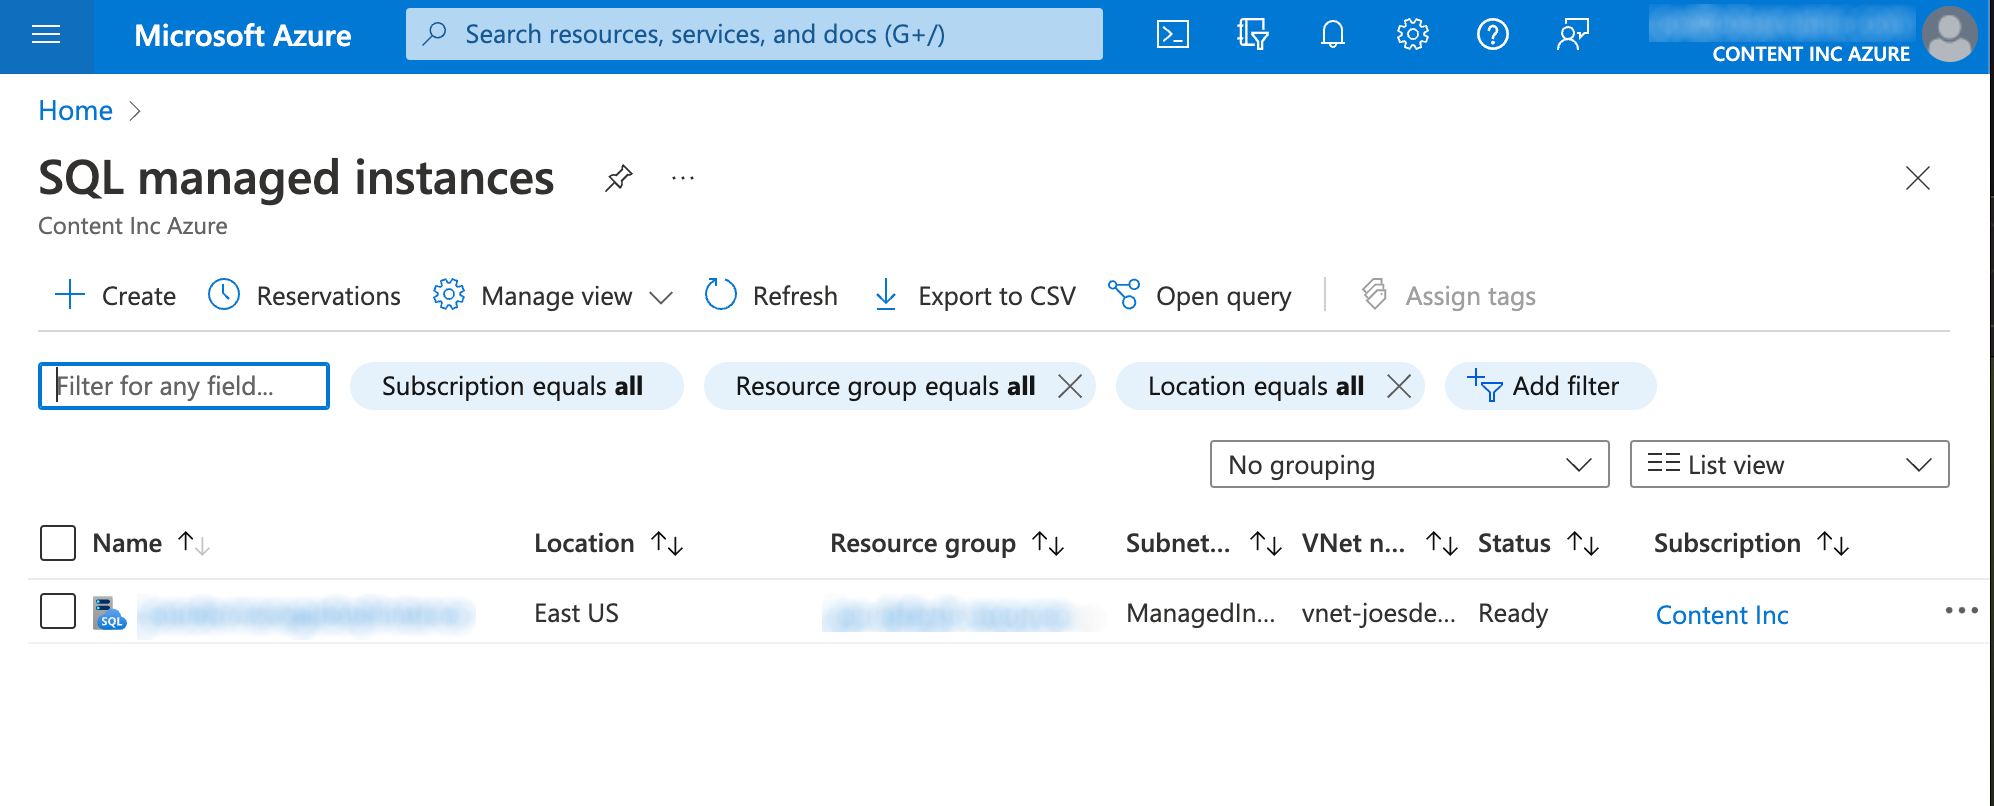
Azure SQL Managed Instances
- Log into the Azure portal.
- In the Azure search field, enter SQL Managed Instances.
- Select your SQL Managed Instance.
- From the left menu, choose Diagnostic Settings and click Add diagnostic setting.
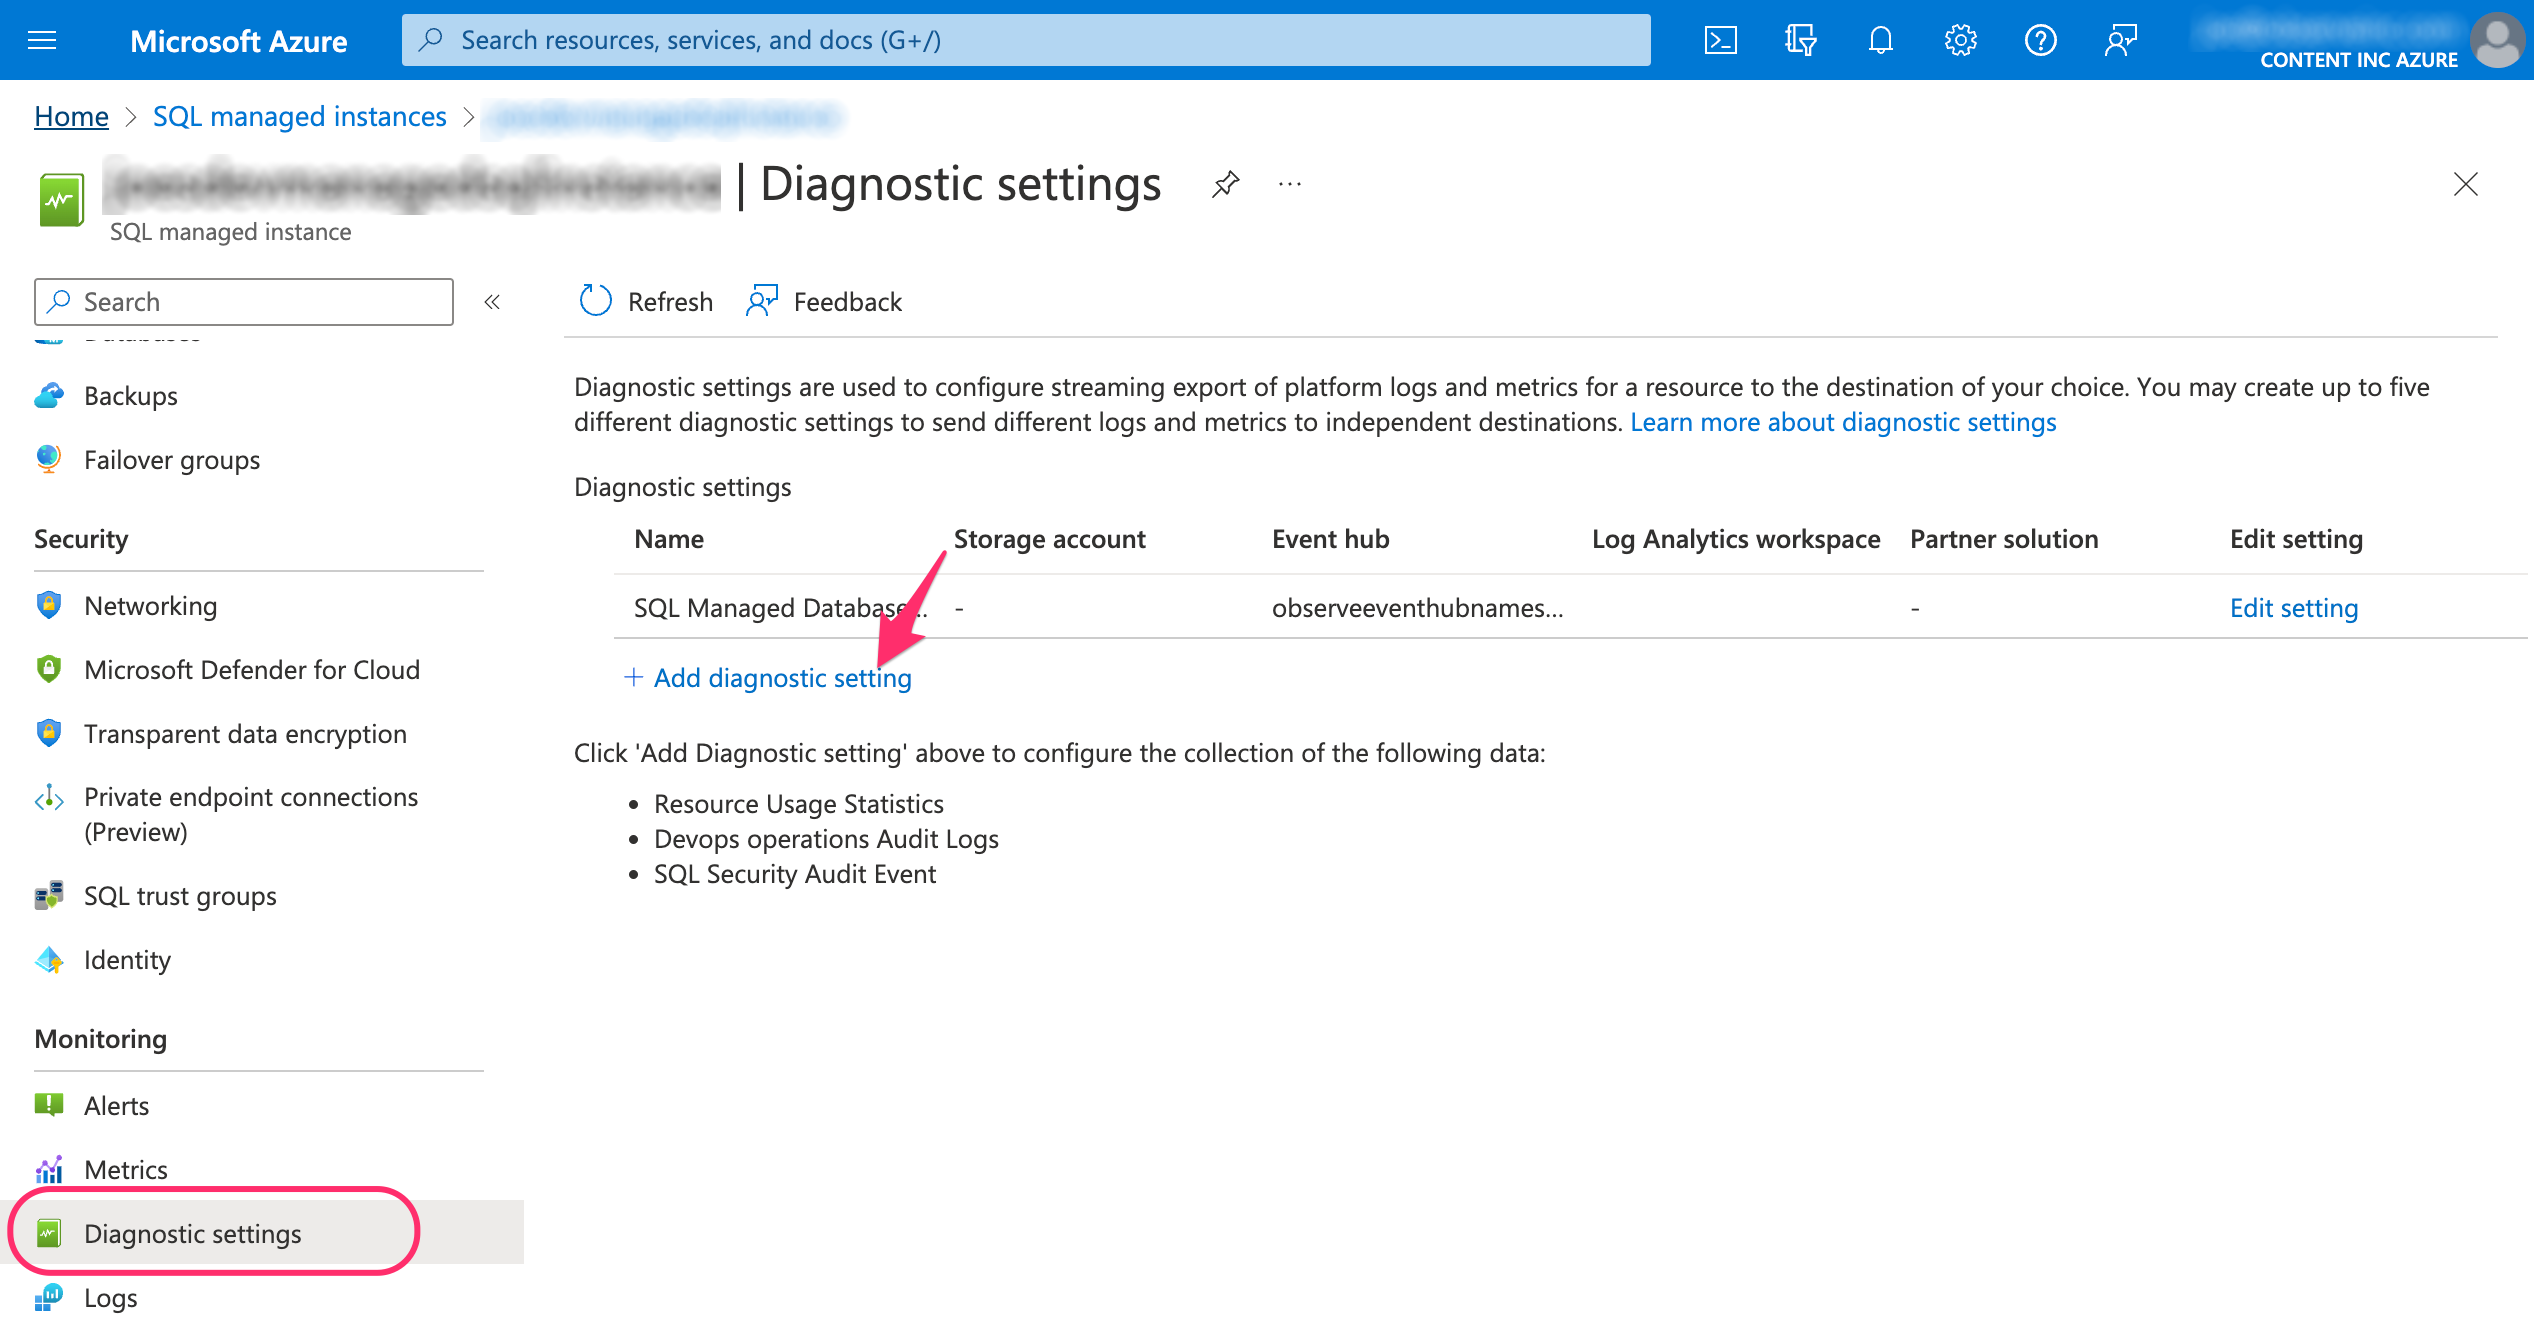
- Select all Logs, Audit logs, and all Metrics. Send to event hub with your customer-id.
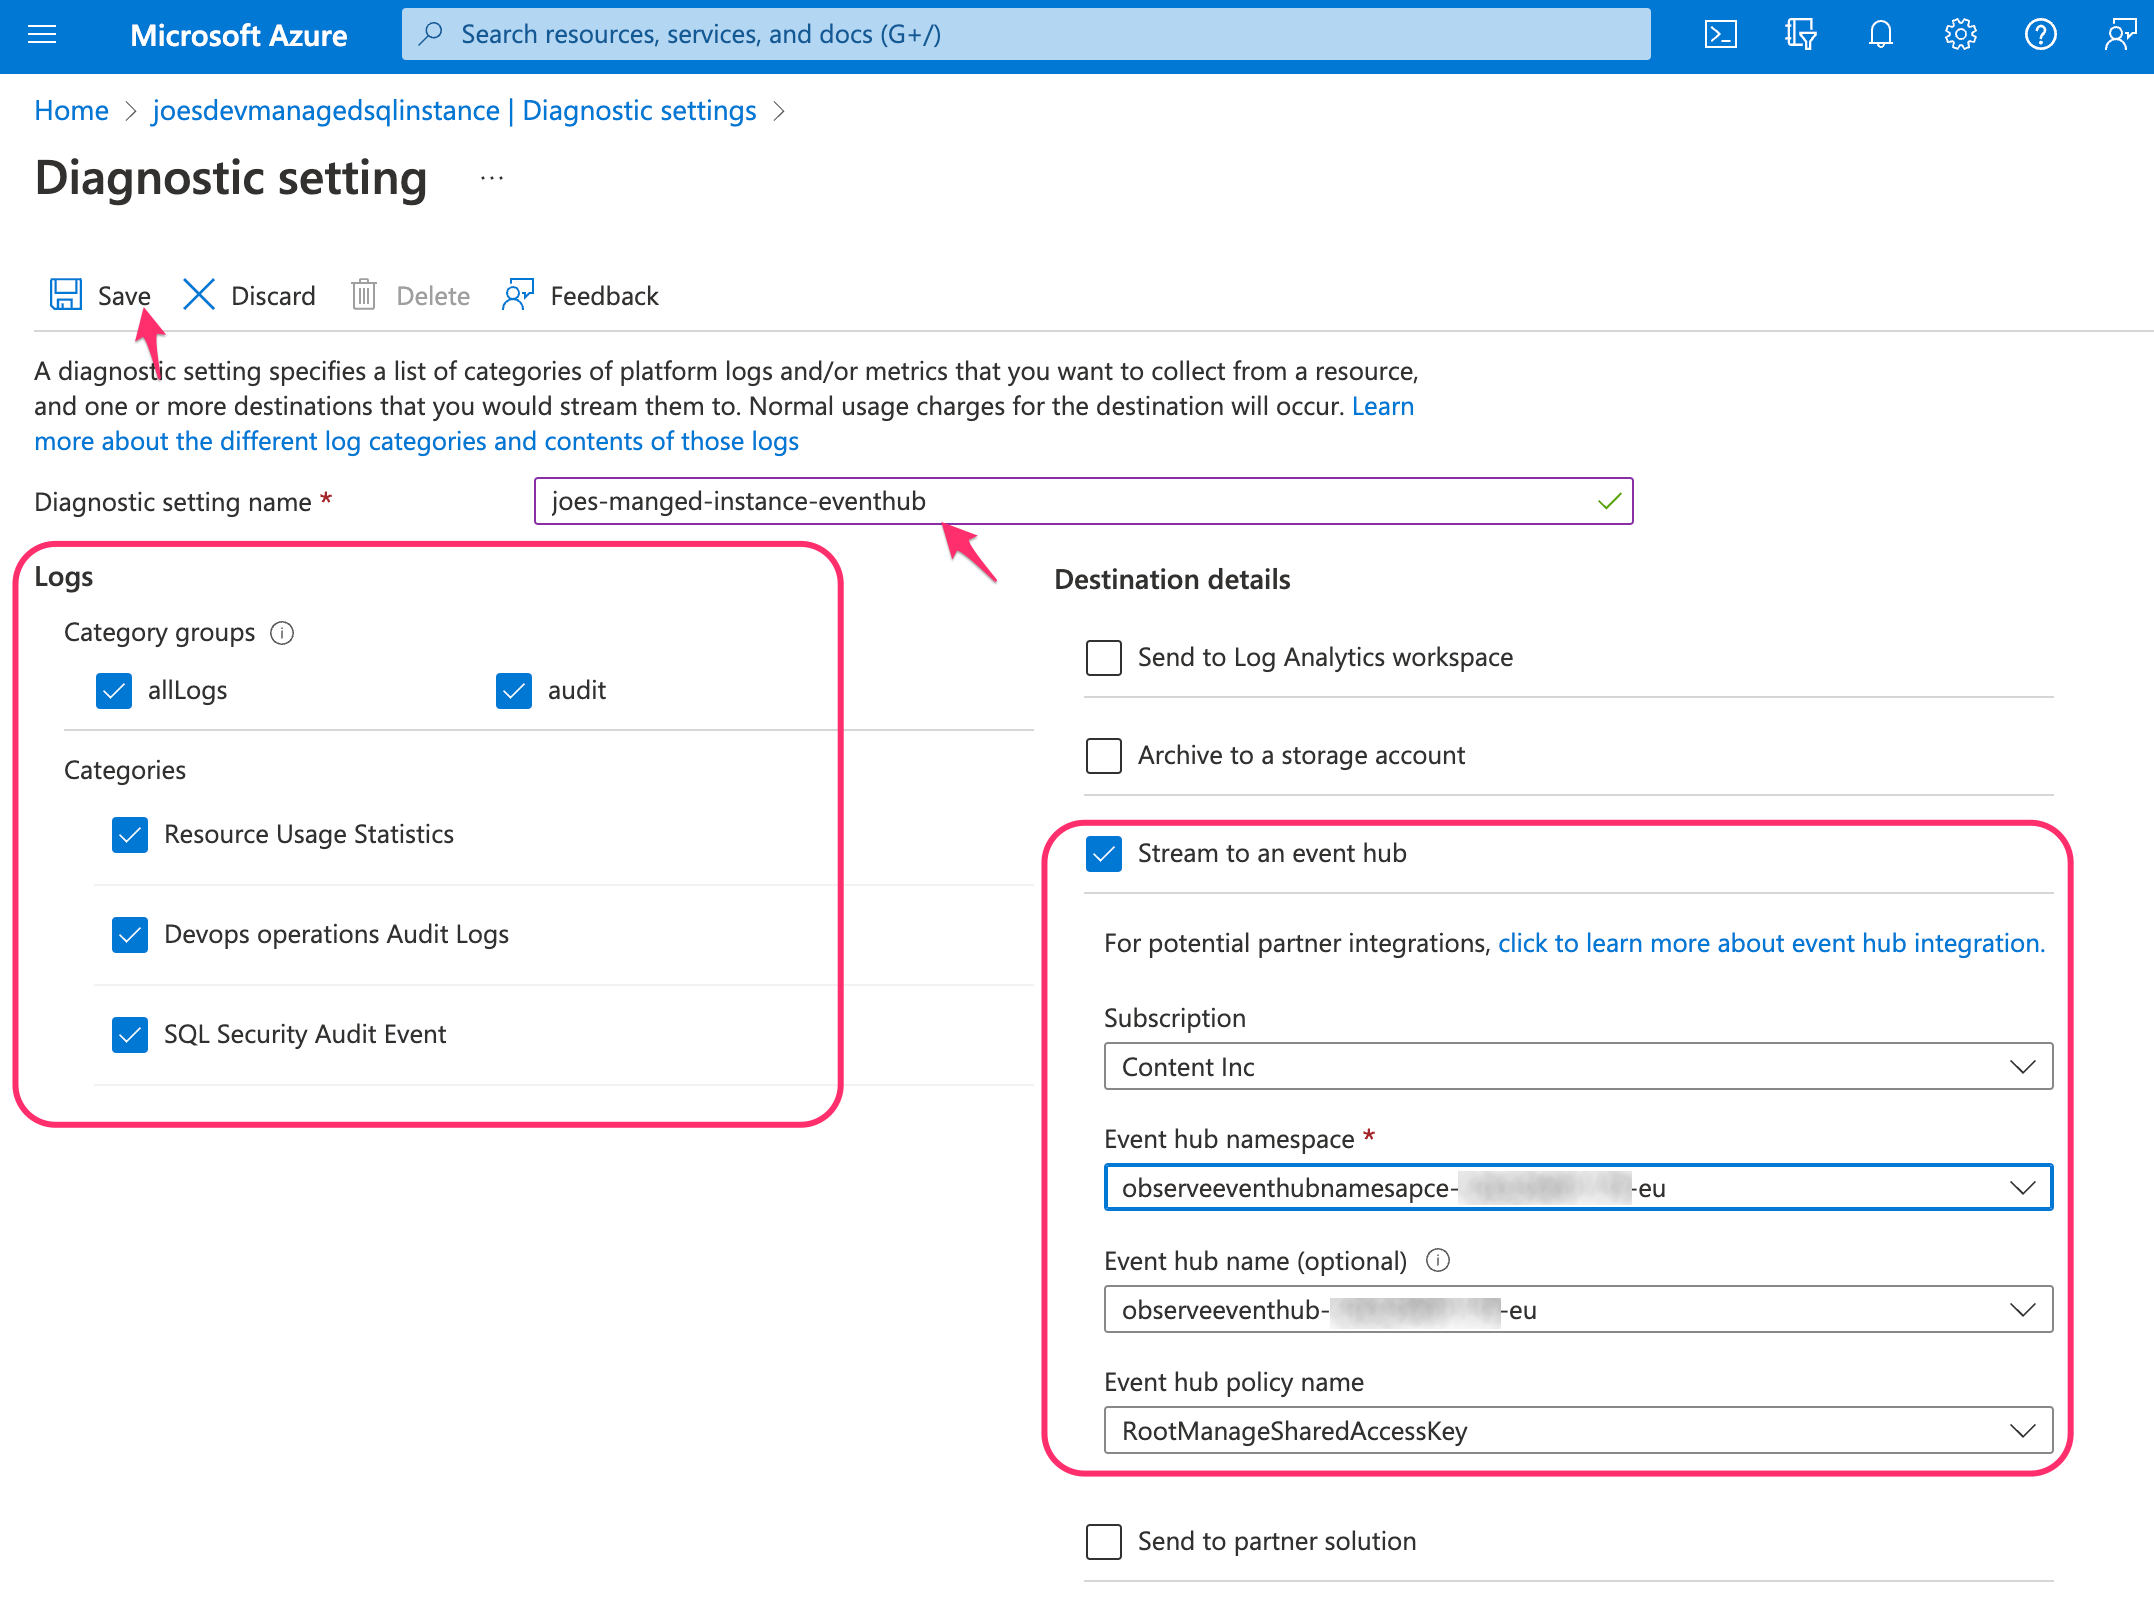
- Create a name for the diagnostic setting and click Save.
Azure Storage Account
- Log into the Azure portal.
- Search for the Storage Accounts in the search field.
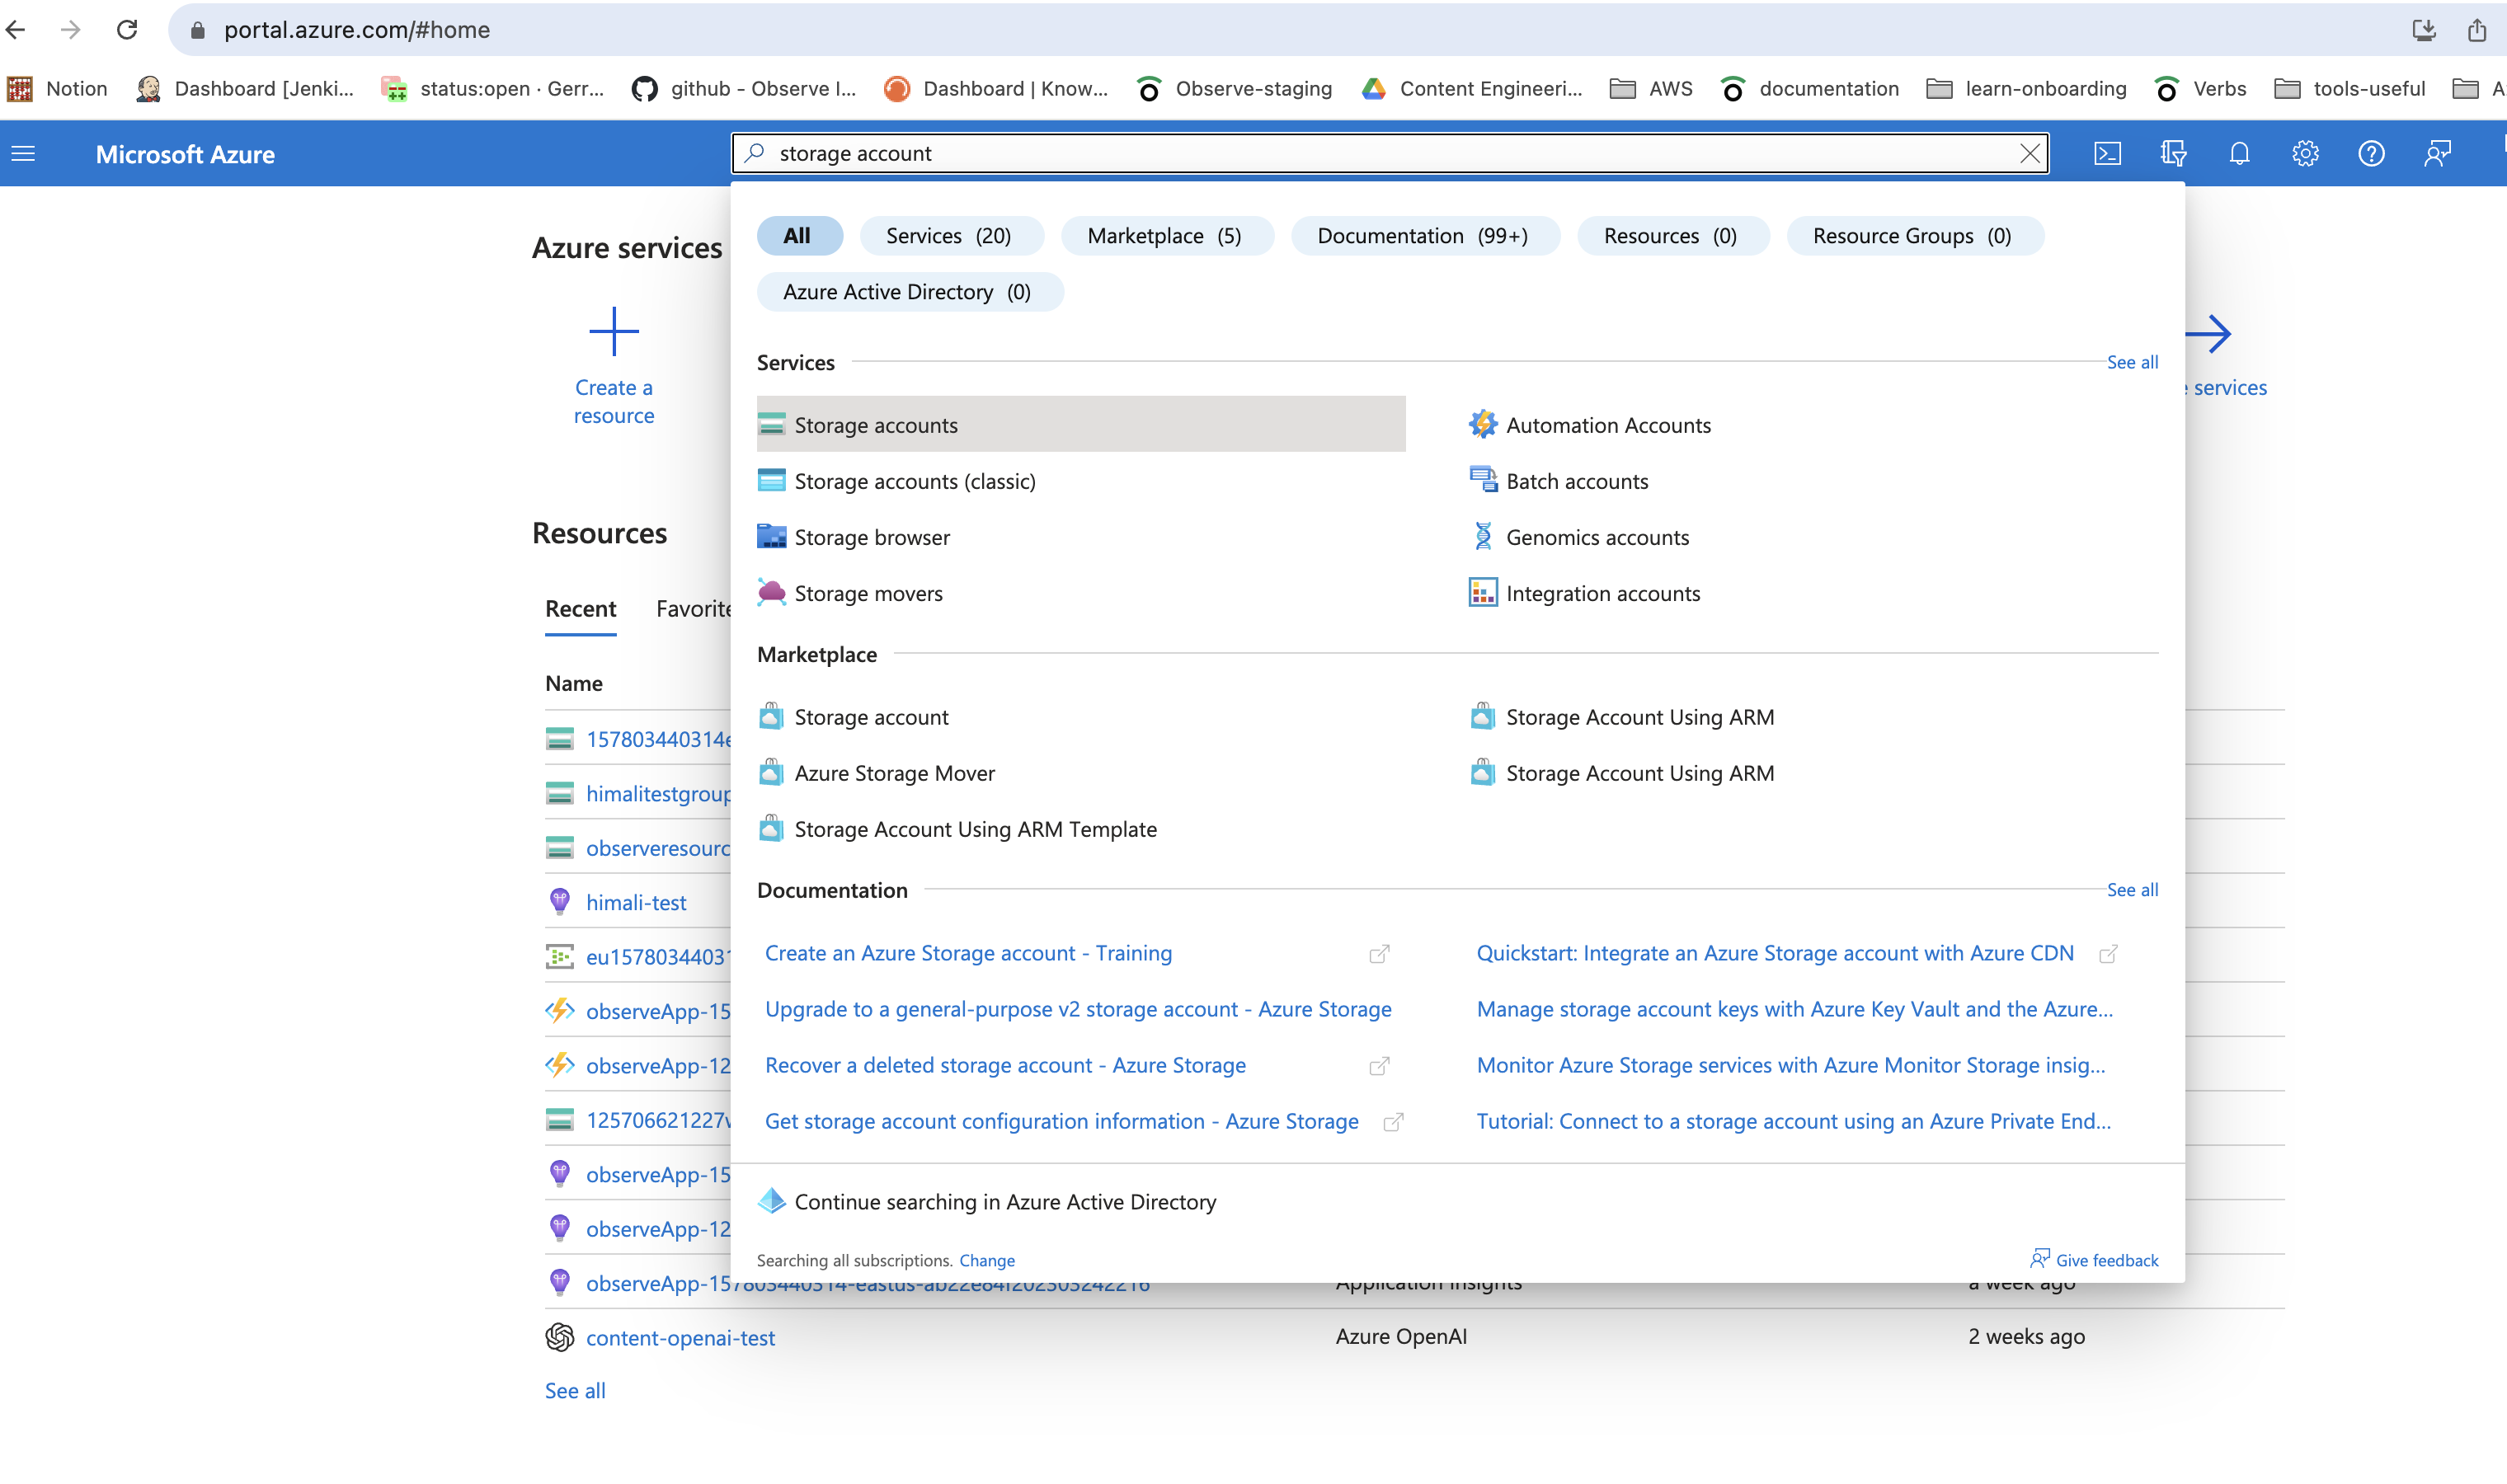
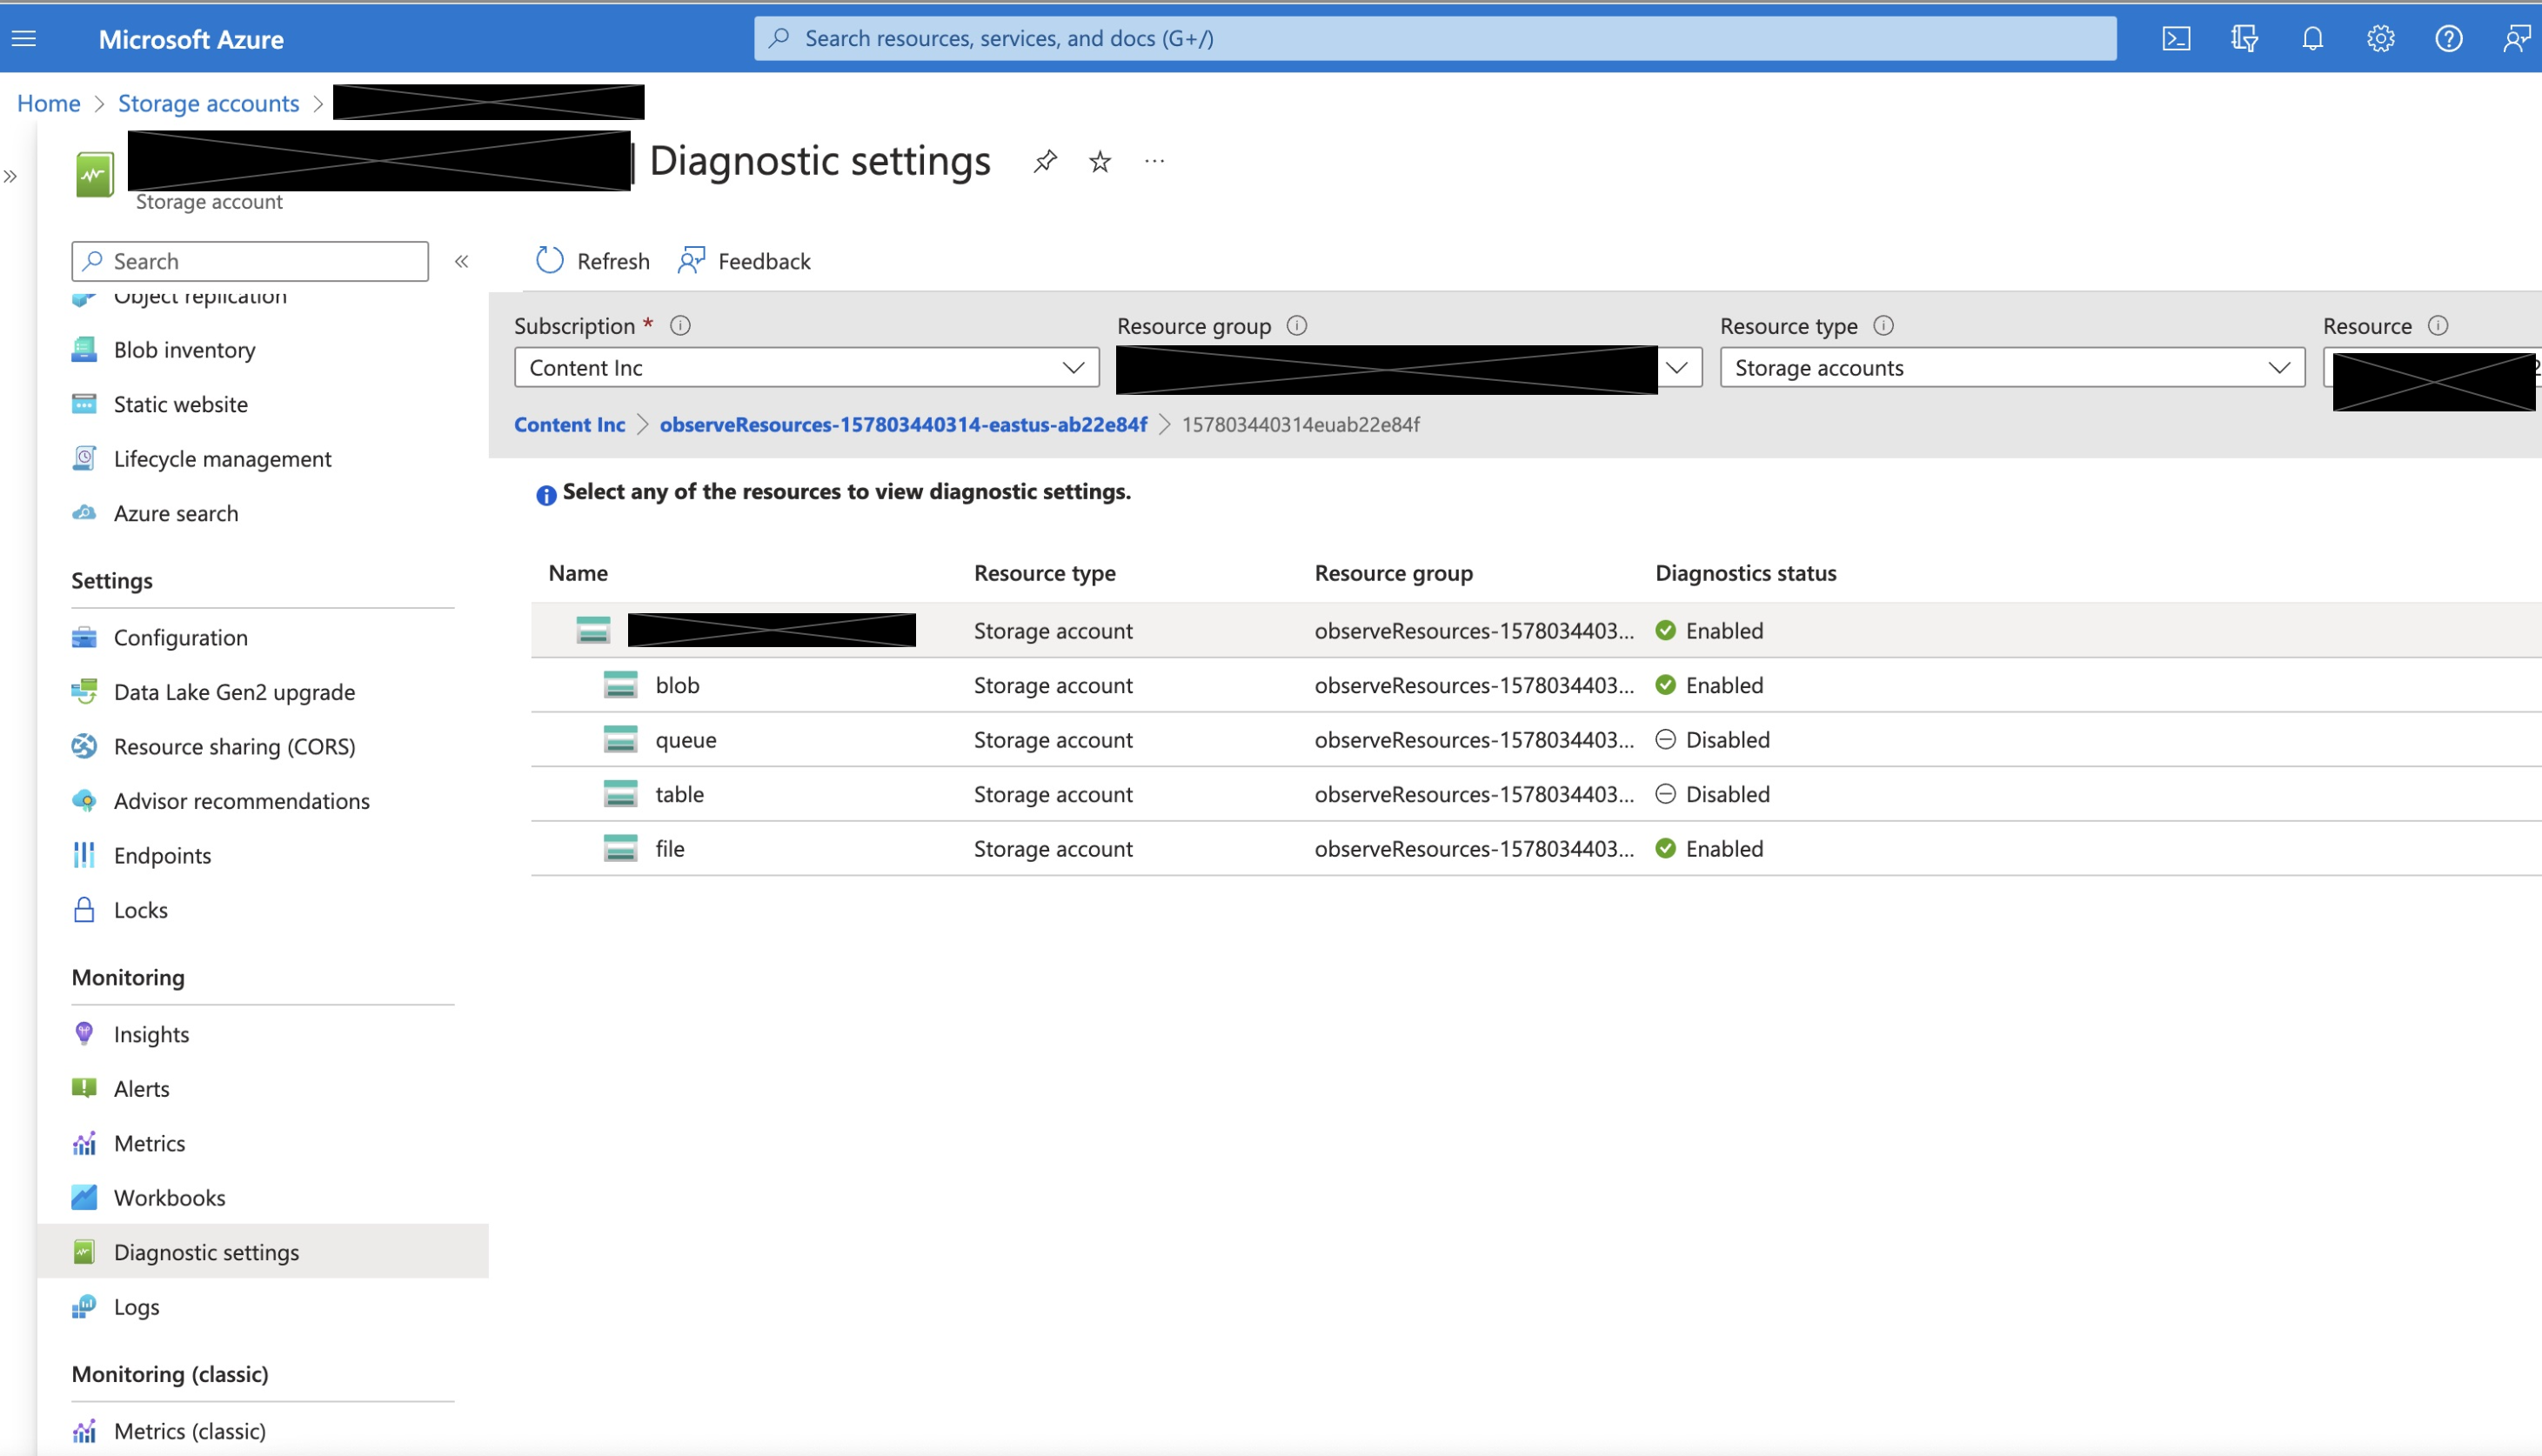
- Go to the Monitoring section and select Diagnostic setting.
This enables logs and metrics at the Storage Account level.
- Select Add Diagnostics Settings.
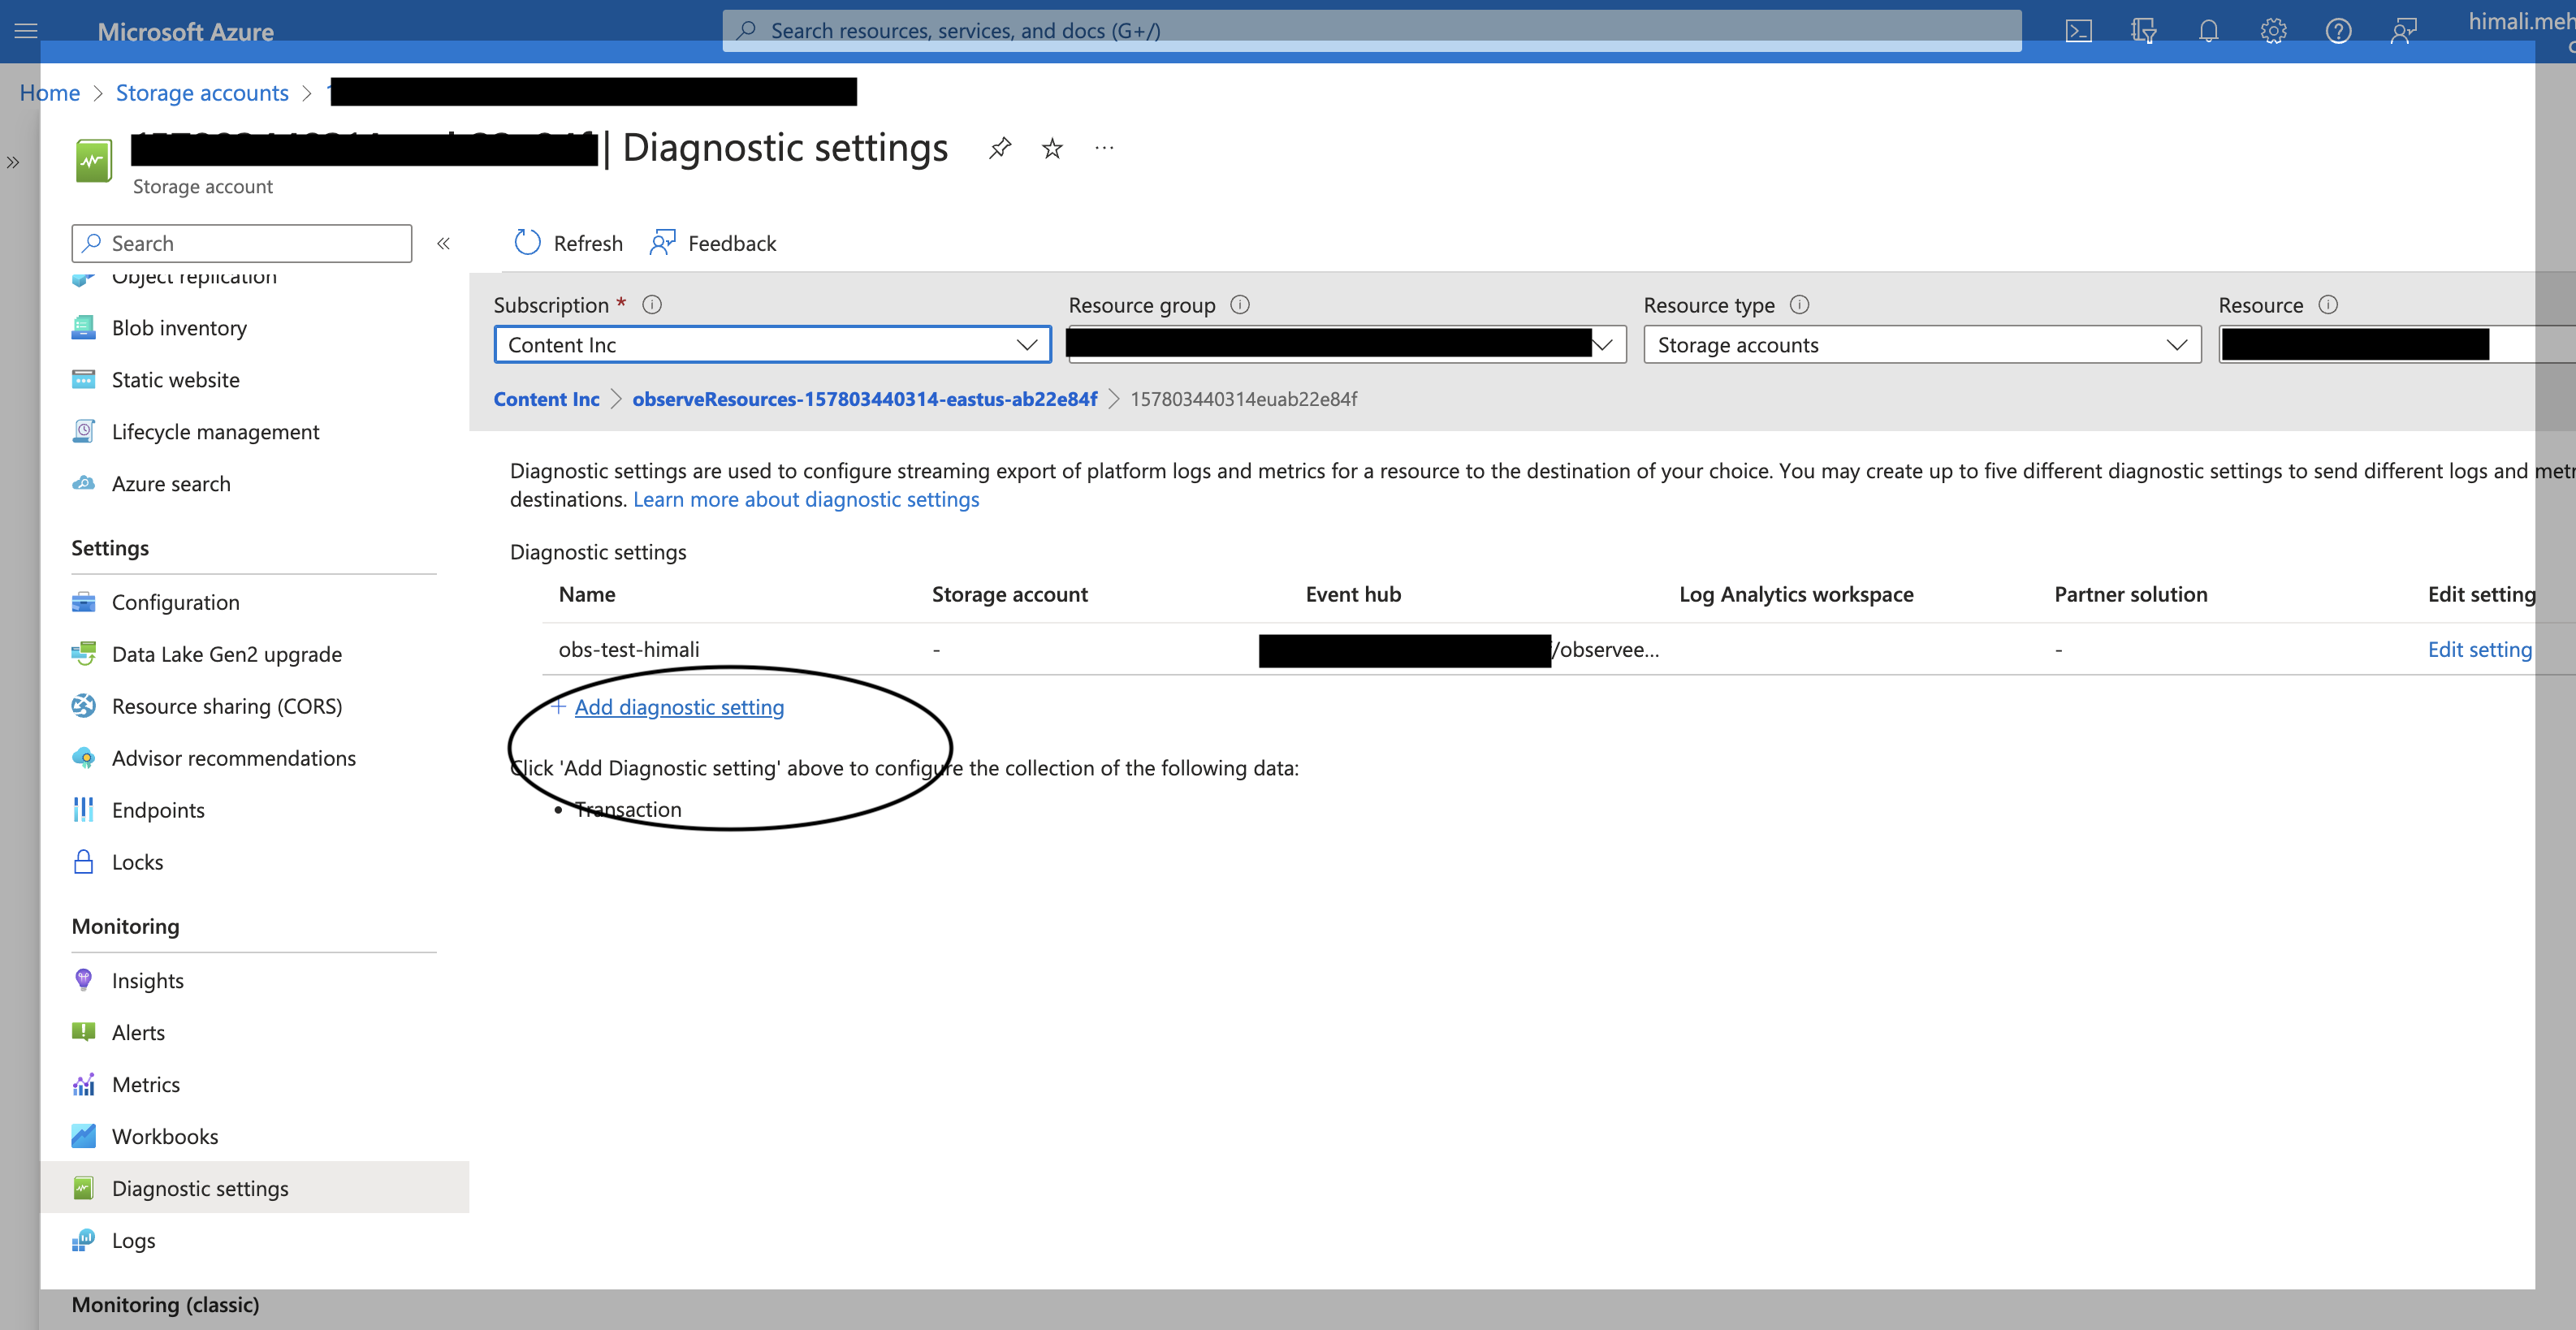
- Select Metrics -> Transaction and select the event hub created by the Observe collection function.
- Click Save.
- Go to the Monitoring and Diagnostic settings. Select Diagnostic setting. Select blob under the Storage Account.
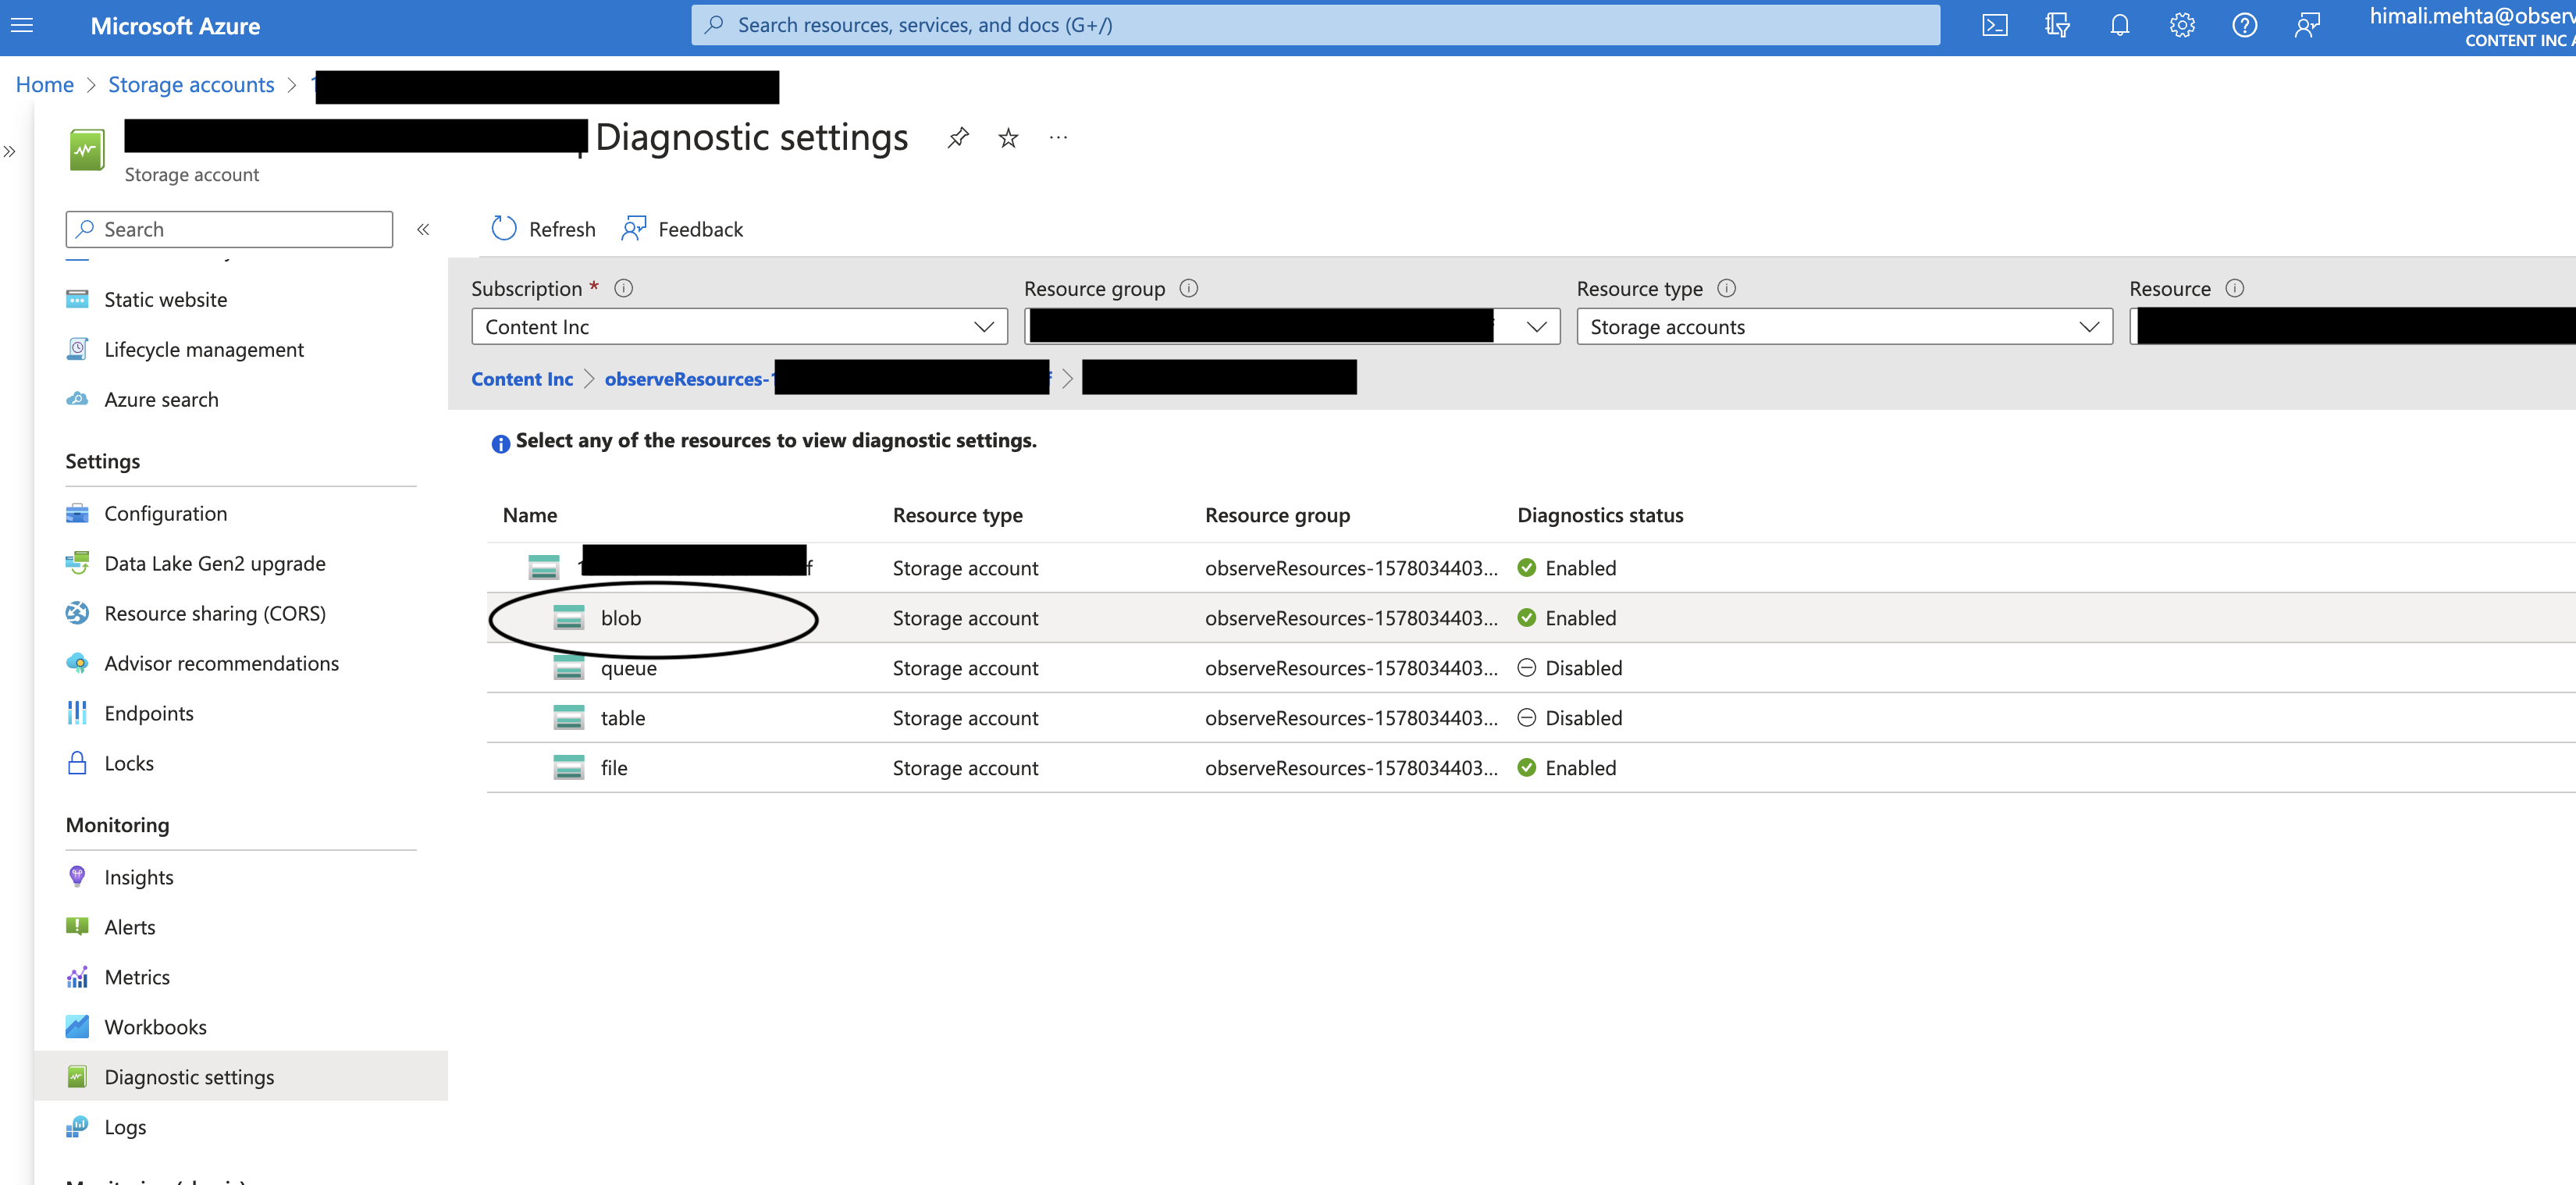
- Select Add Diagnostics Settings.
- Select Metrics -> Transaction. Select Logs -> Categories -> StorageRead, StorageWrite, StorageDelete.
- Select the event hub created by the Observe collection function.
- Click Save.
Azure virtual machine
Currently, the Azure app collects this data using the timer_resources_func and timer_vm_metrics_func functions within the Observe Function app deployed. It does not require any diagnostic settings.
Create diagnostic settings at scale
Create Azure policies
If you want to create Diagnostic Settings for all resources of a resource type, you can configure an Azure Policy. Create custom policy definitions for each type of resource to monitor. Microsoft provides documentation on how to accomplish this.
Once you create the policies in your Azure account, Observe recommends creating a policy initiative, assigning the relevant policies, assigning that policy to a Management Group, and then adding your subscriptions to that management group.
Create a management group
- Log into the Azure portal.
- In the Azure search field, enter Management Groups.
- Click Create.
- Give the policy an ID such as observeDiagnosticSettings.
- Set the policy display name such as Observe Diagnostic Settings.
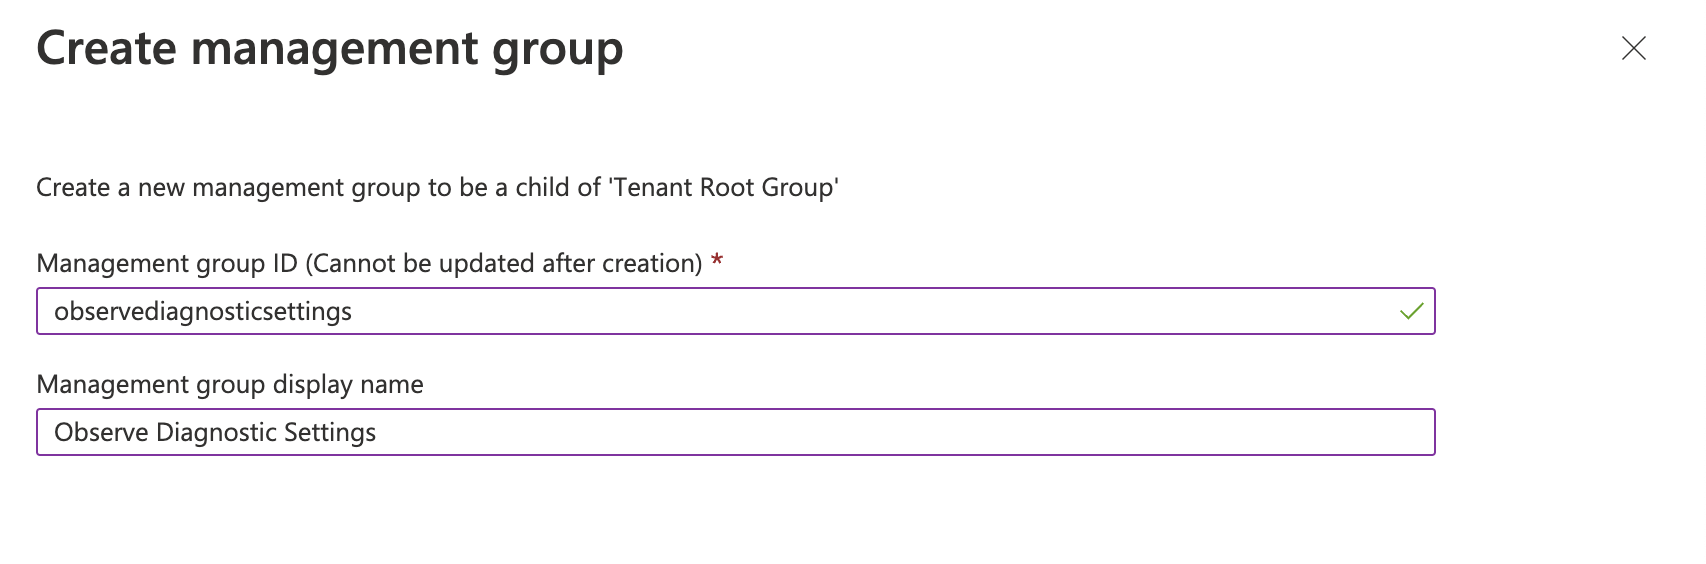
- Click Submit.
Populate the management group
Once you create the management group, you need to move any other management groups or subscriptions to apply under the Observe Diagnostic Settings management group. Use the following steps:
- Log into the Azure portal.
- In the Azure search field, enter Management Groups.
- Click on the three dots on the right of the management group or subscription.
- Click Move.
- Select the Observe Diagnostic Settings management group as the destination.
- Click Save.
Create an initiative
An initiative consists of a collection of one or more policies that allow for simpler policy management. To create an initiative, use the following steps:
- Log into the Azure portal.
- In the Azure search field, enter Policy.
- Select Definitions from the left menu of the page.
- Click Initiative Definition at the top of the page.
- Choose the management group created in the previous step for Initiative location.
- Set the name of the initiative to Send to Observe.
- Set the category to Monitoring after selecting on Use existing.
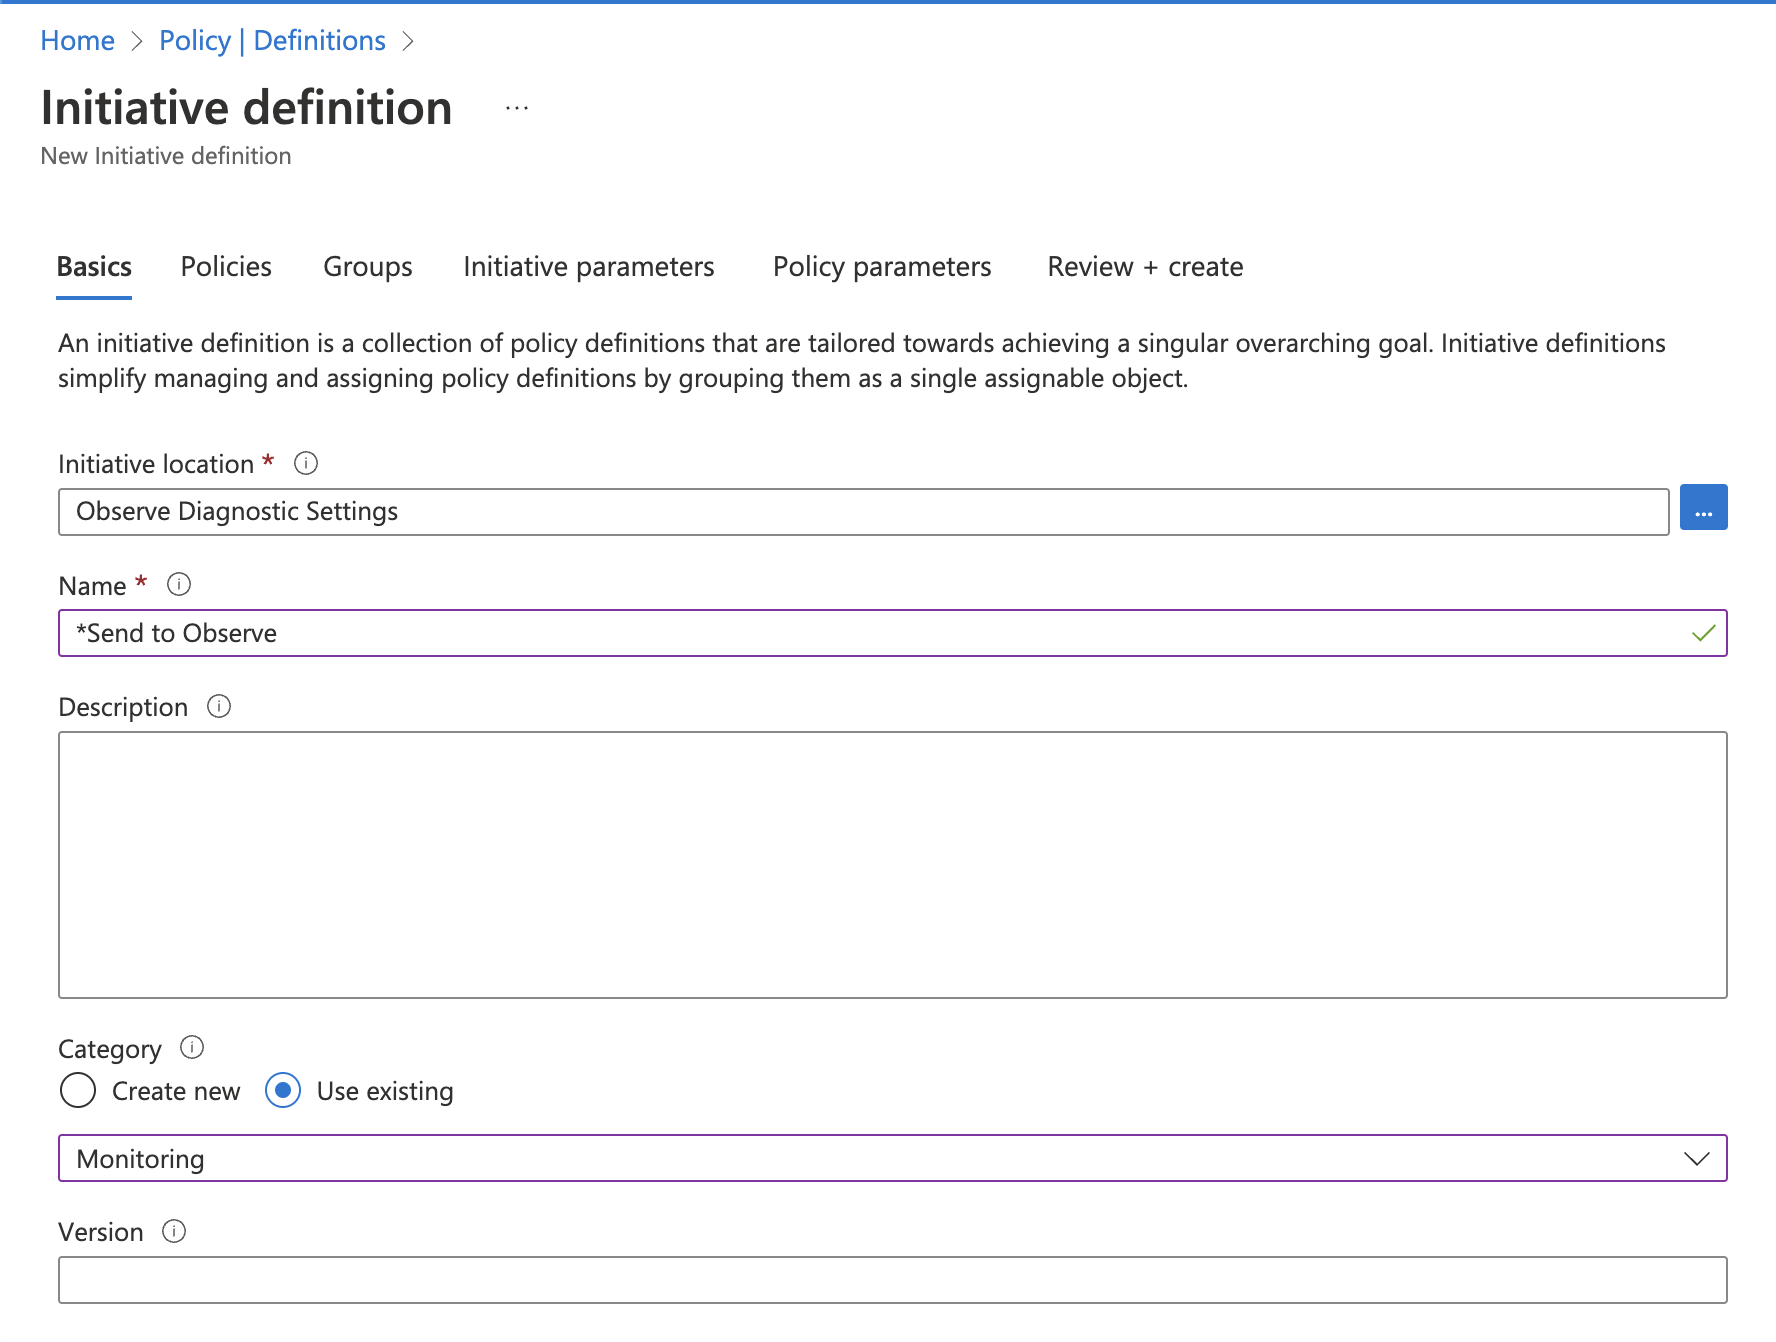
- Click Next.
- Select all of the policies for the diagnostic settings for the resource types to monitor.
- Click Initiative Parameters at the top of the page.
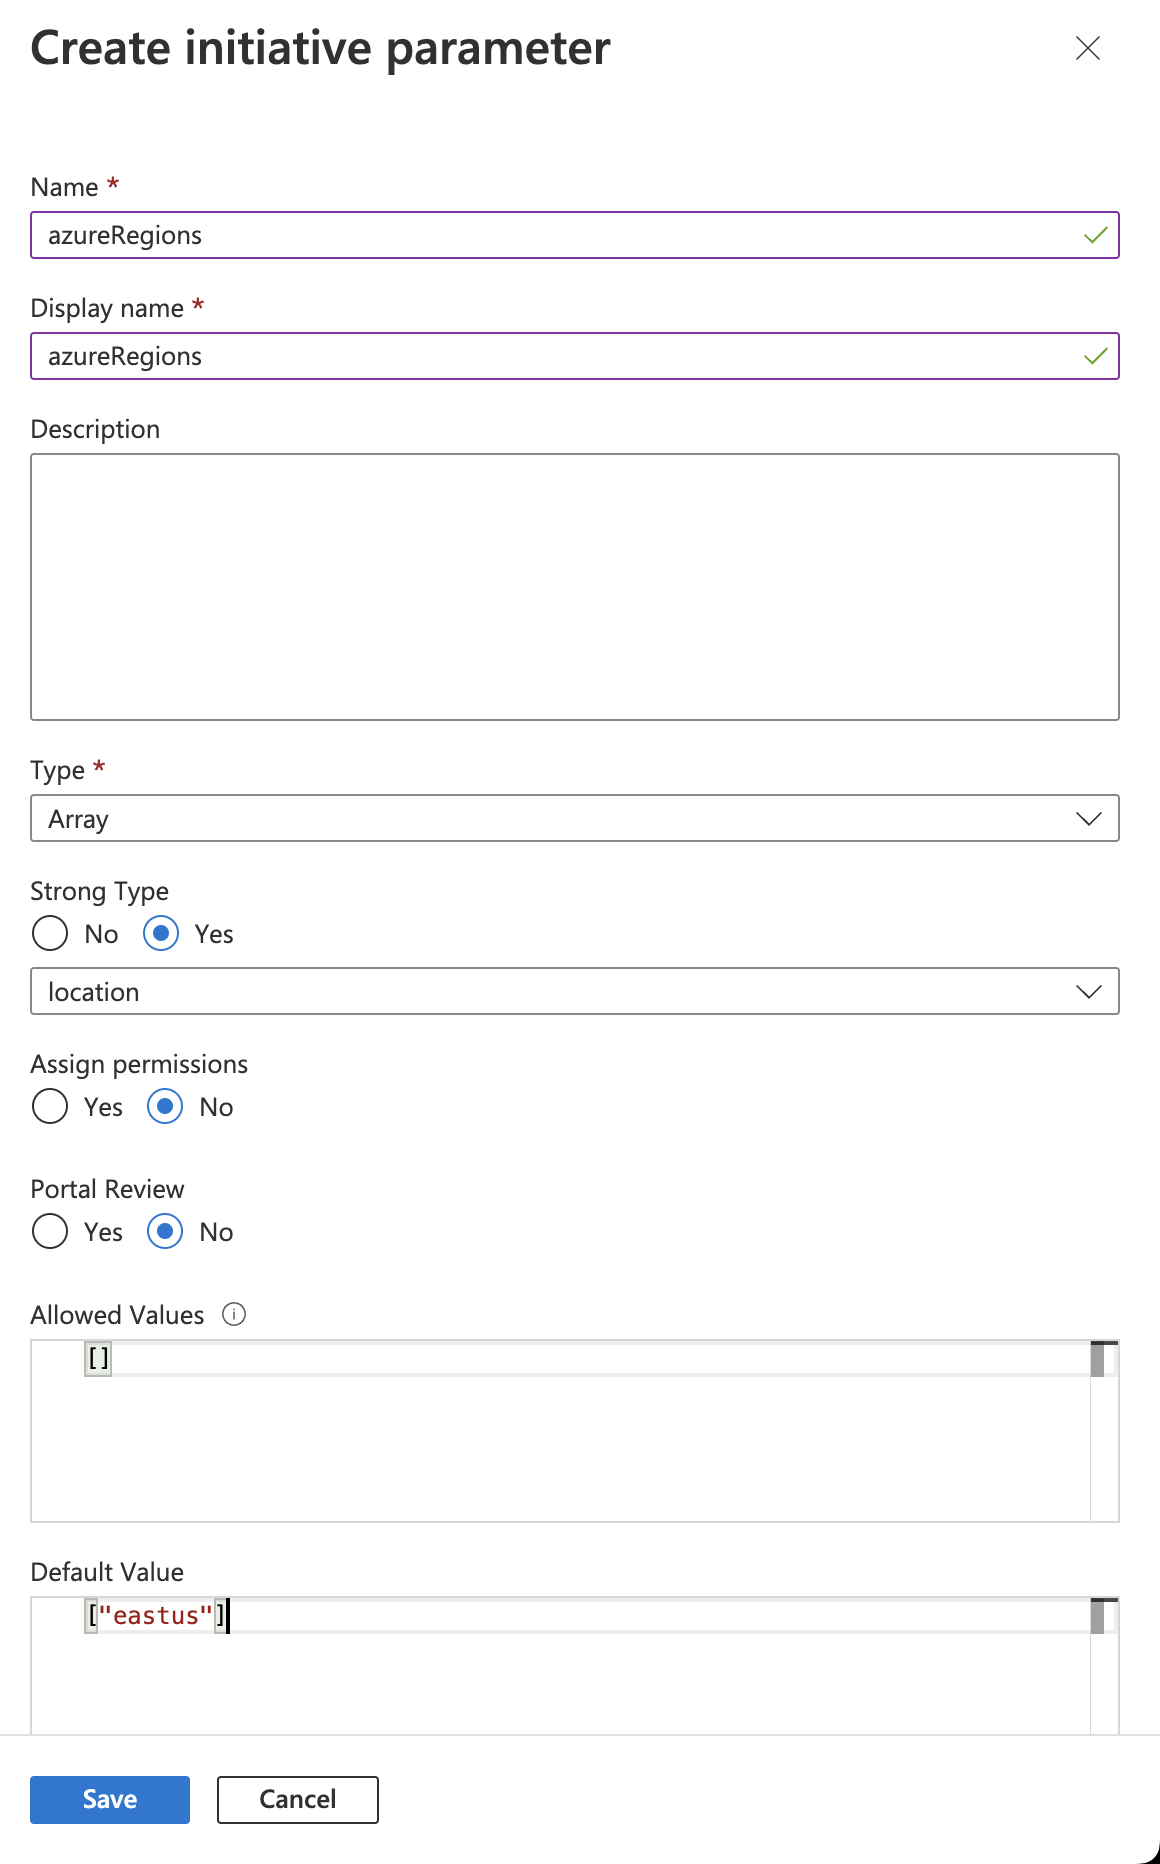
- Click Create initiative parameter to create a new initiative parameter.
- Create an initiative parameter called azureRegions. Set the type to array, and add a strong type of location. Add a default value, and then click Save.
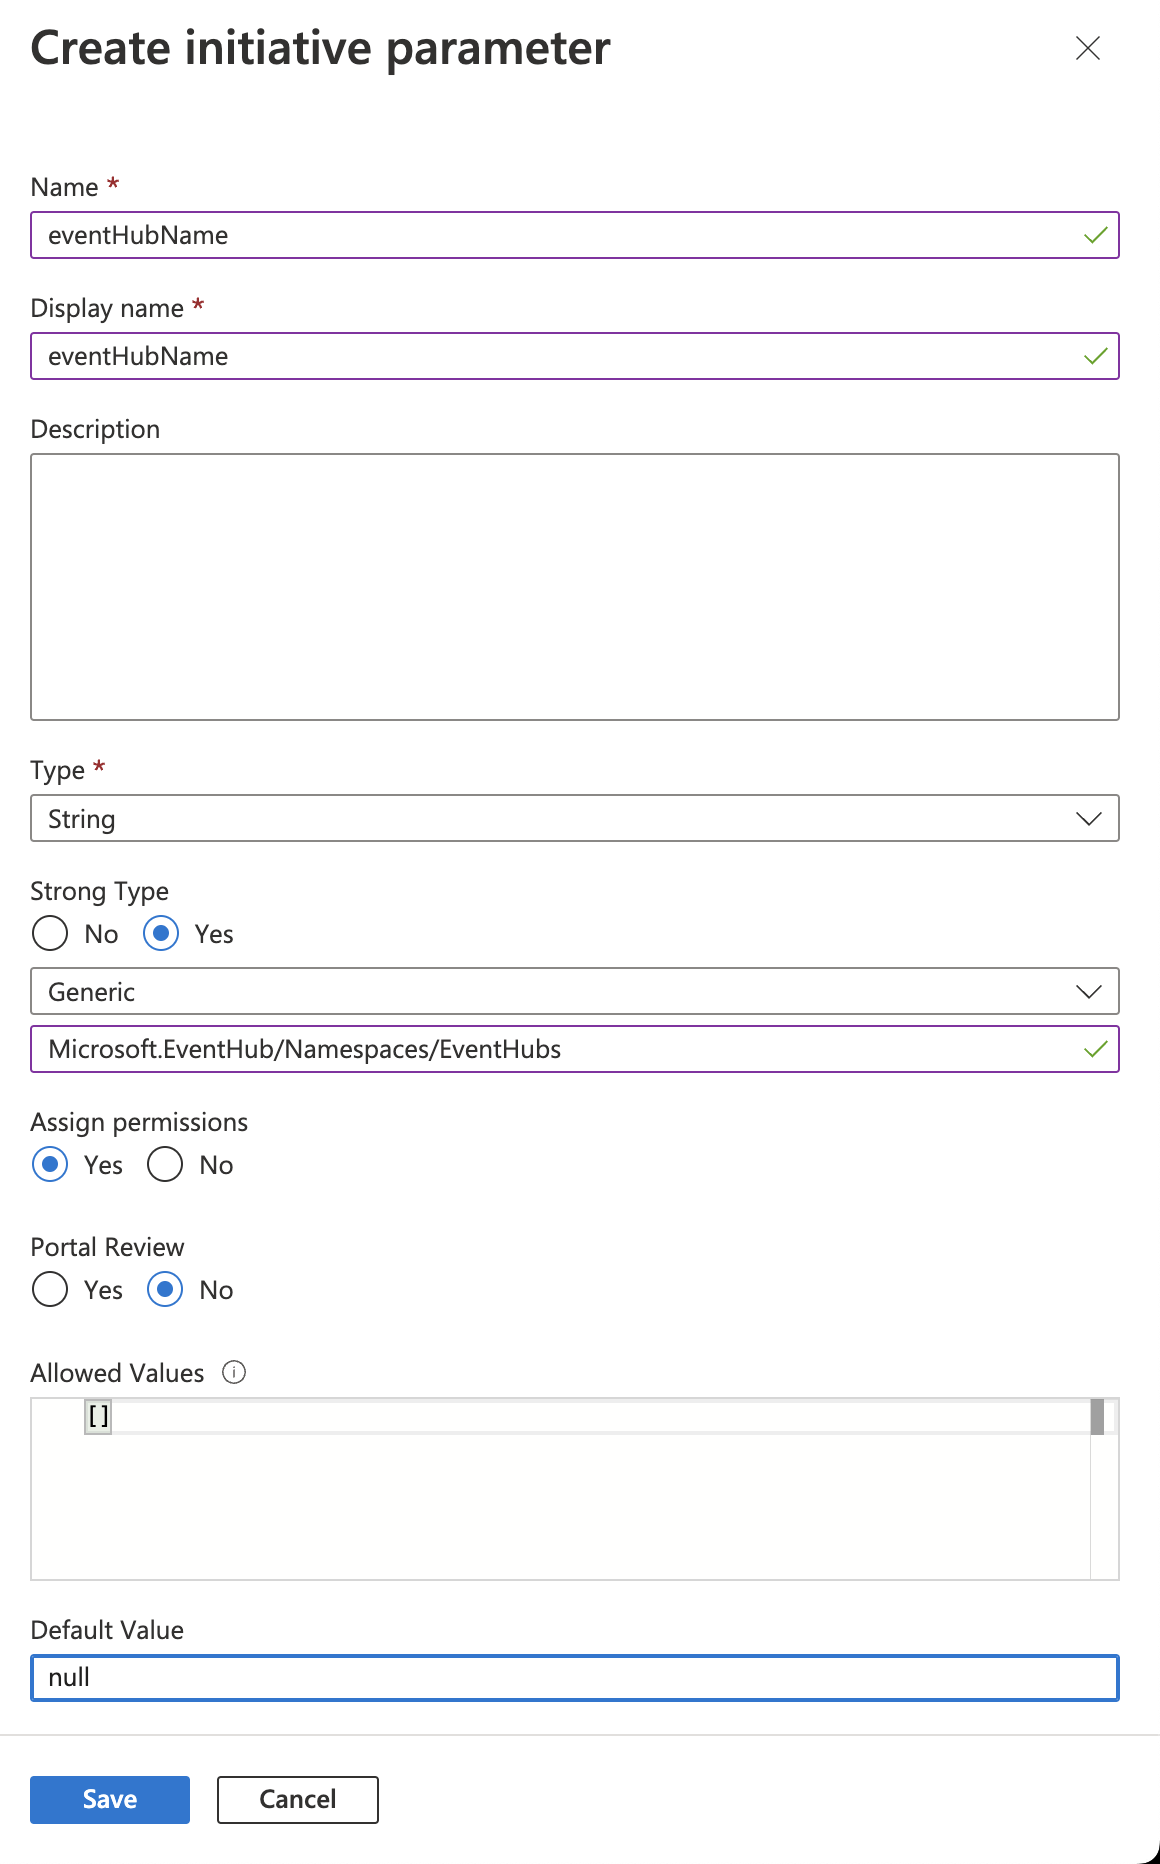
- Create an initiative parameter called eventHubName. Set the type to string, and give it a strong type of Generic - Microsoft.EventHub/Namespaces/EventHubs.
- Select yes for Assign Permissions, and then click Save.
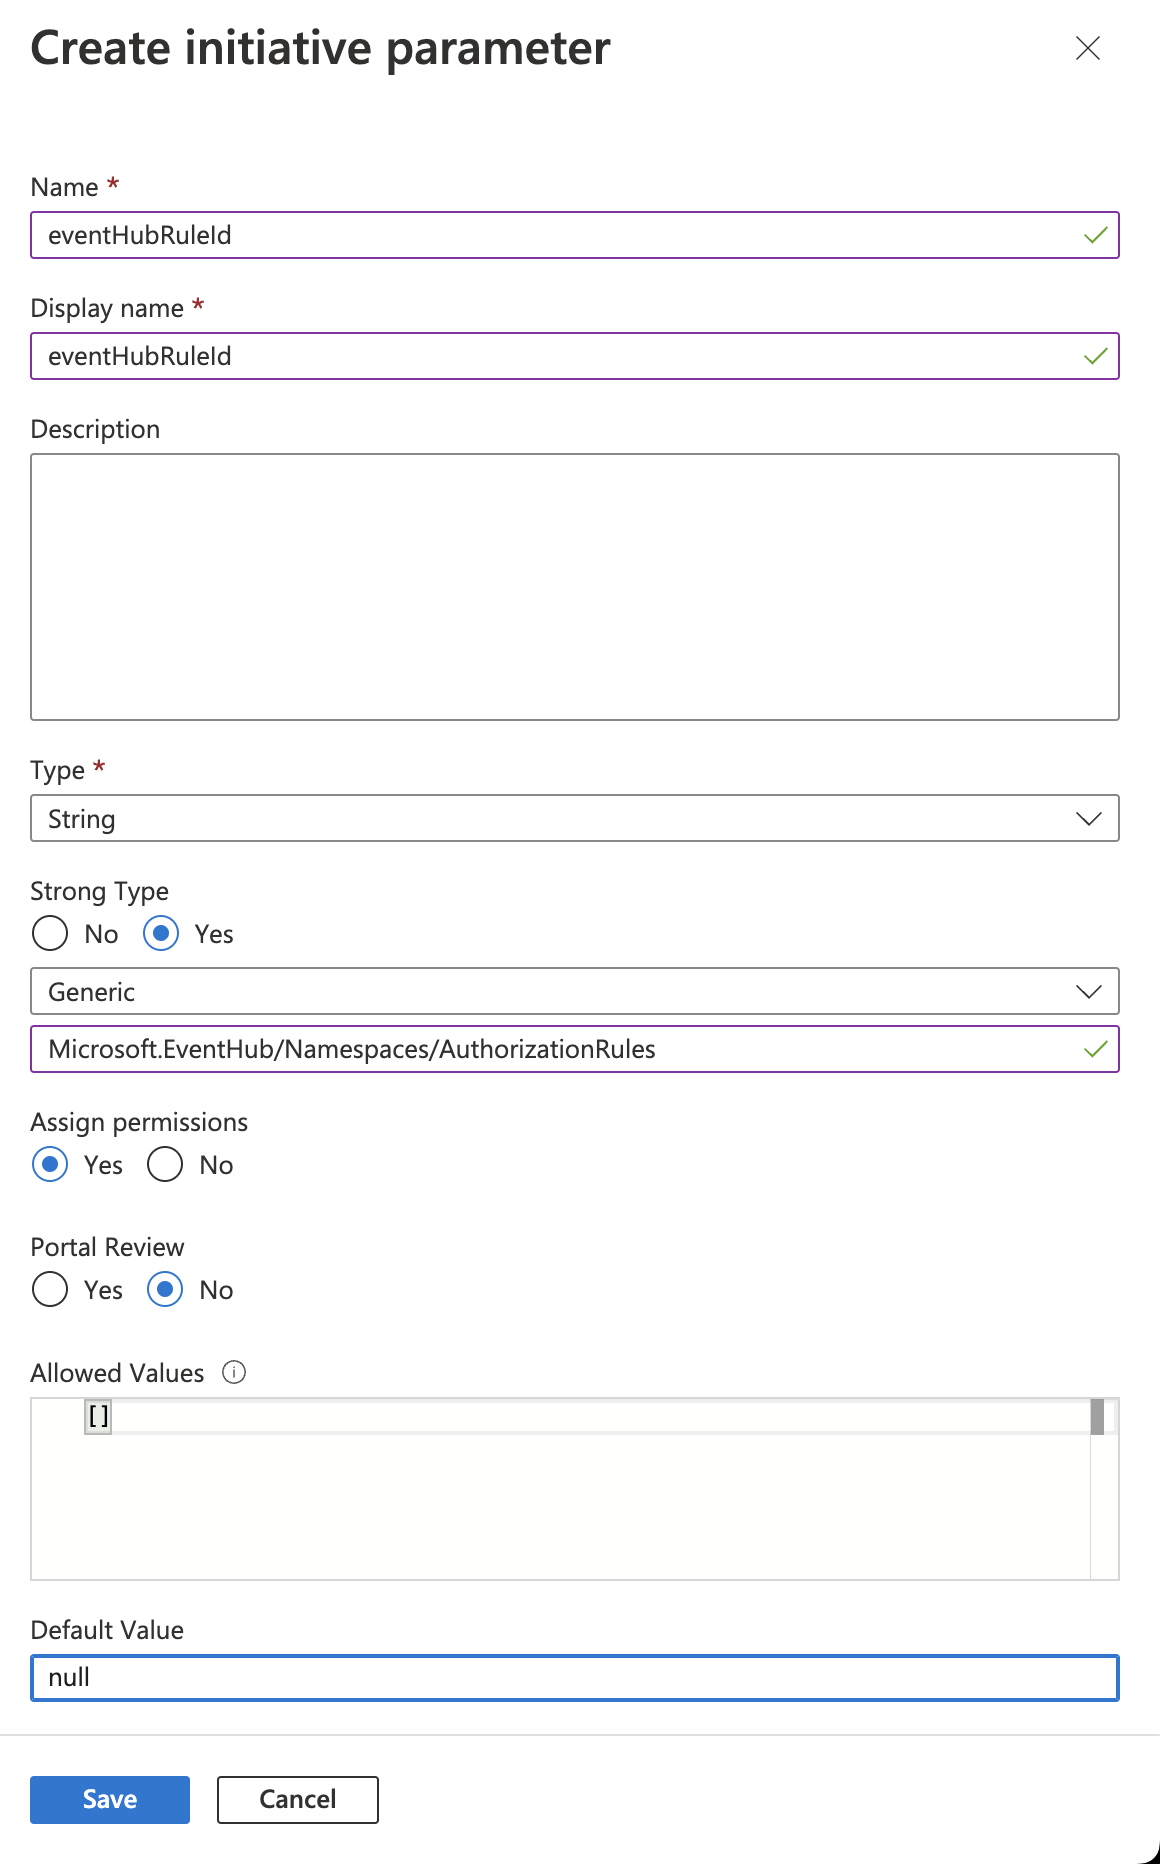
- Create an initiative parameter called eventHubRuleId.
- Set the type to string, and add a strong type of Generic - Microsoft.EventHub/Namespaces/AuthorizationRules.
- Select Yes for Assign Permissions, and then click Save.
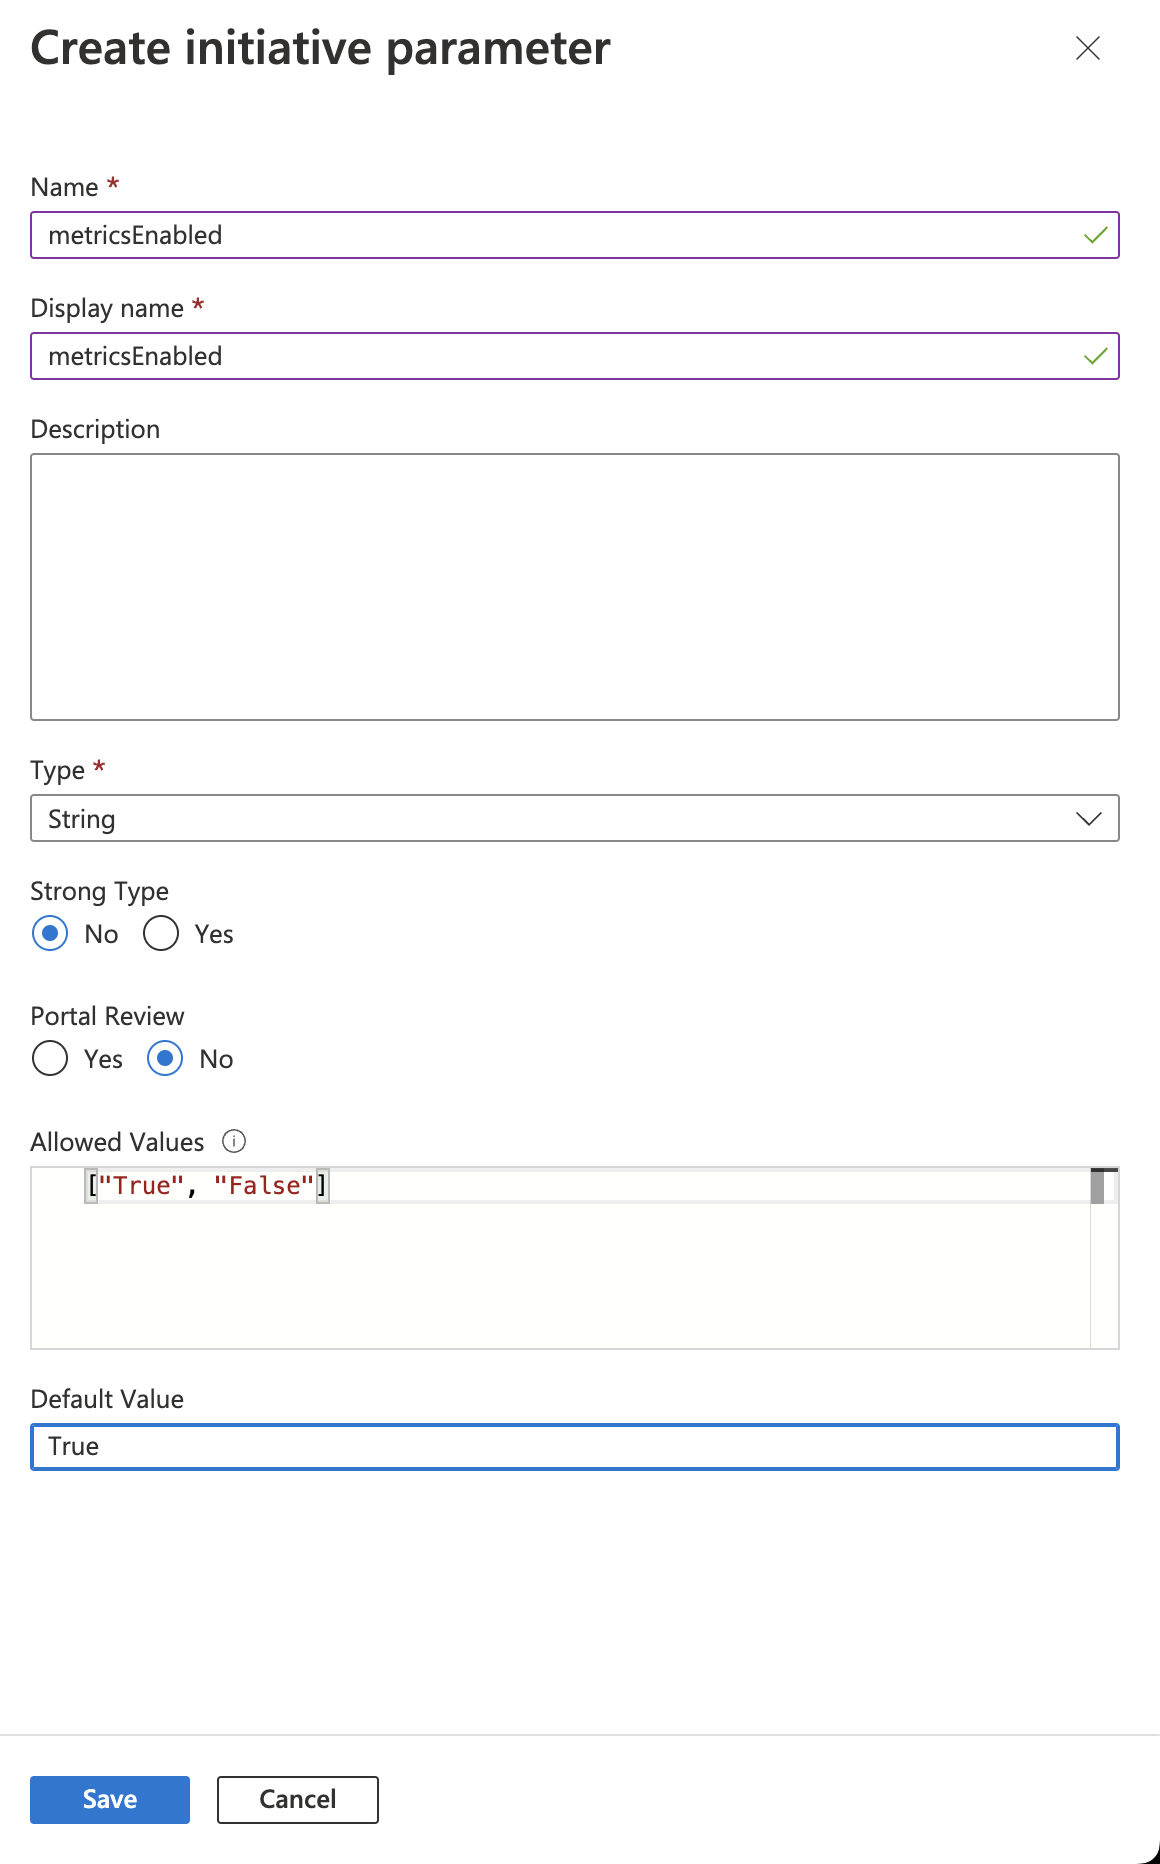
- Create an initiative parameter called metricsEnabled.
- Set the type to string, and then set the allowed value to ["True", "False"].
- Set the default value to True and then click Save.
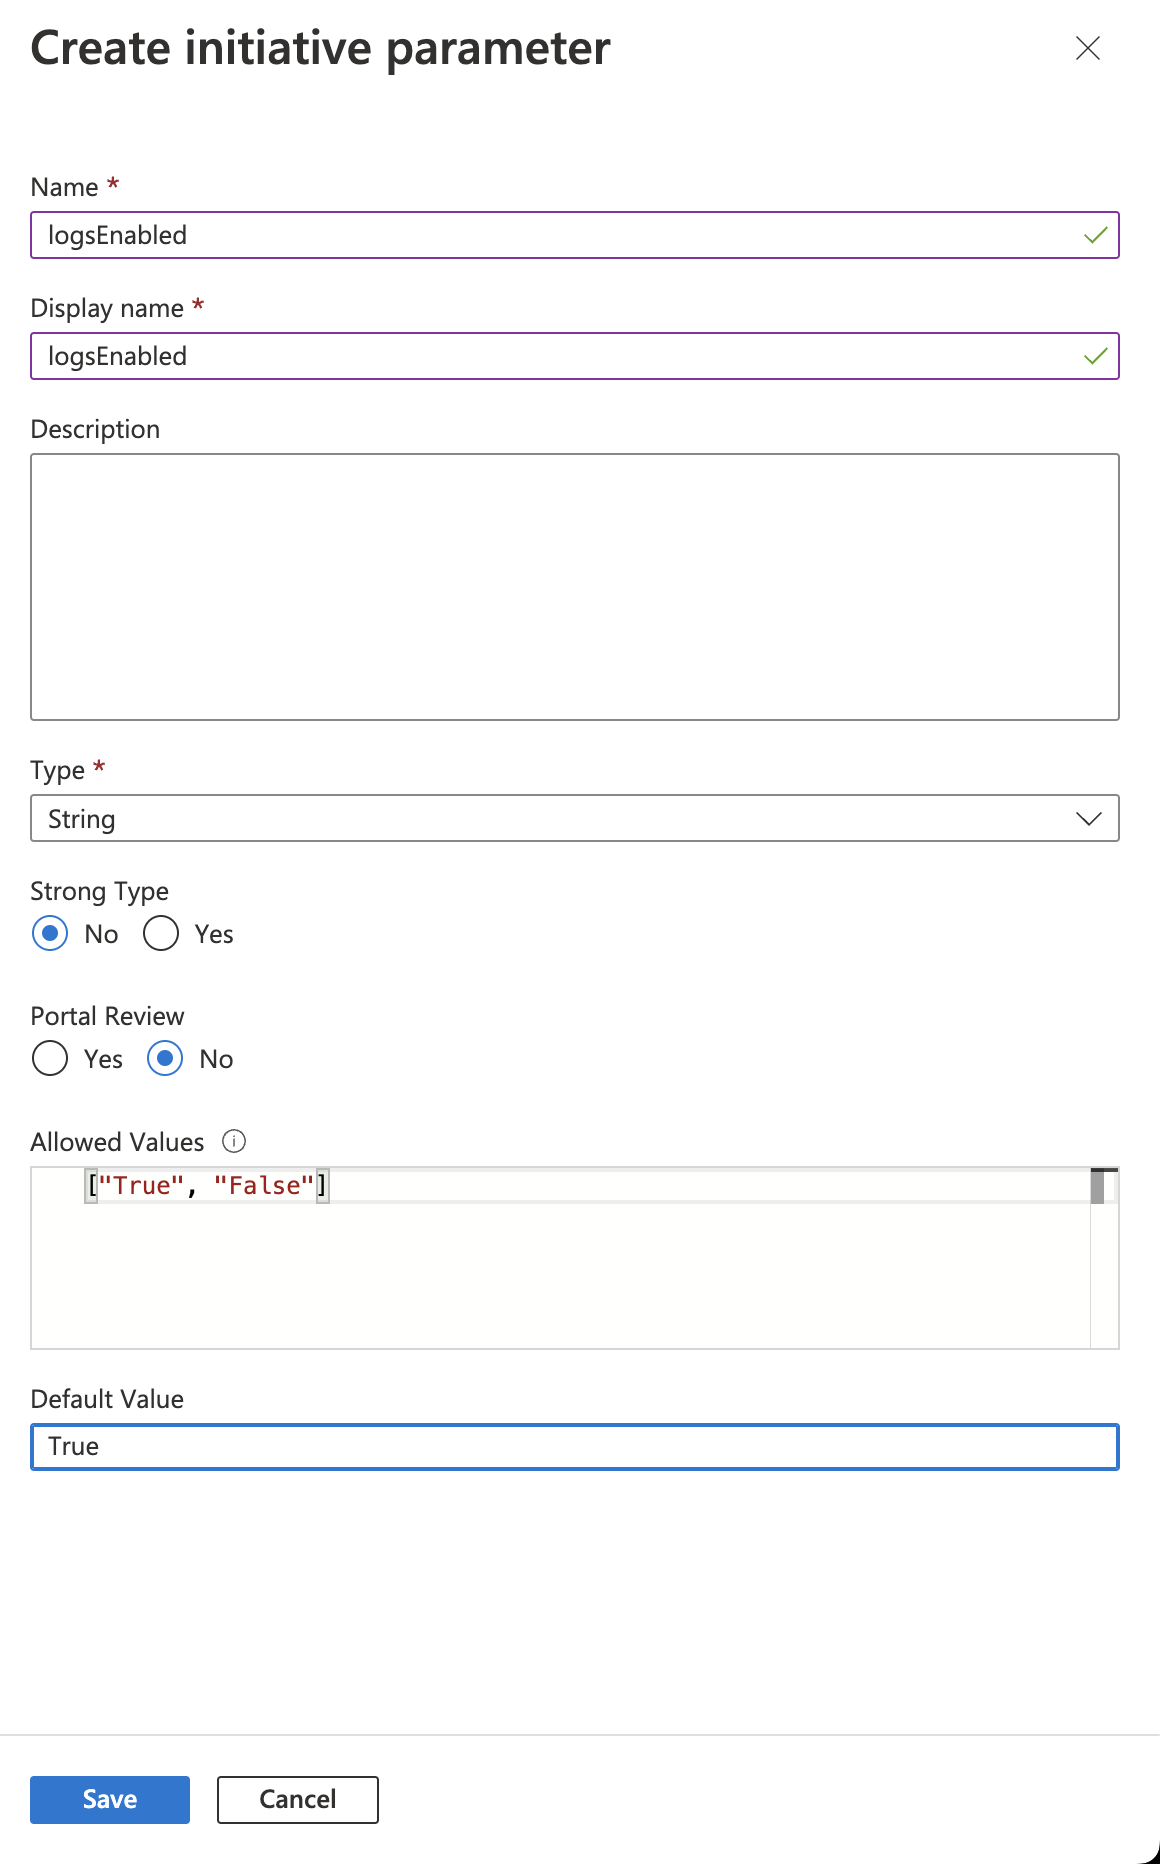
- Create an initiative parameter called logsEnabled. Set the type to string, and set the allowed value to ["True", "False"].
- Set the default value to True and then click Save.
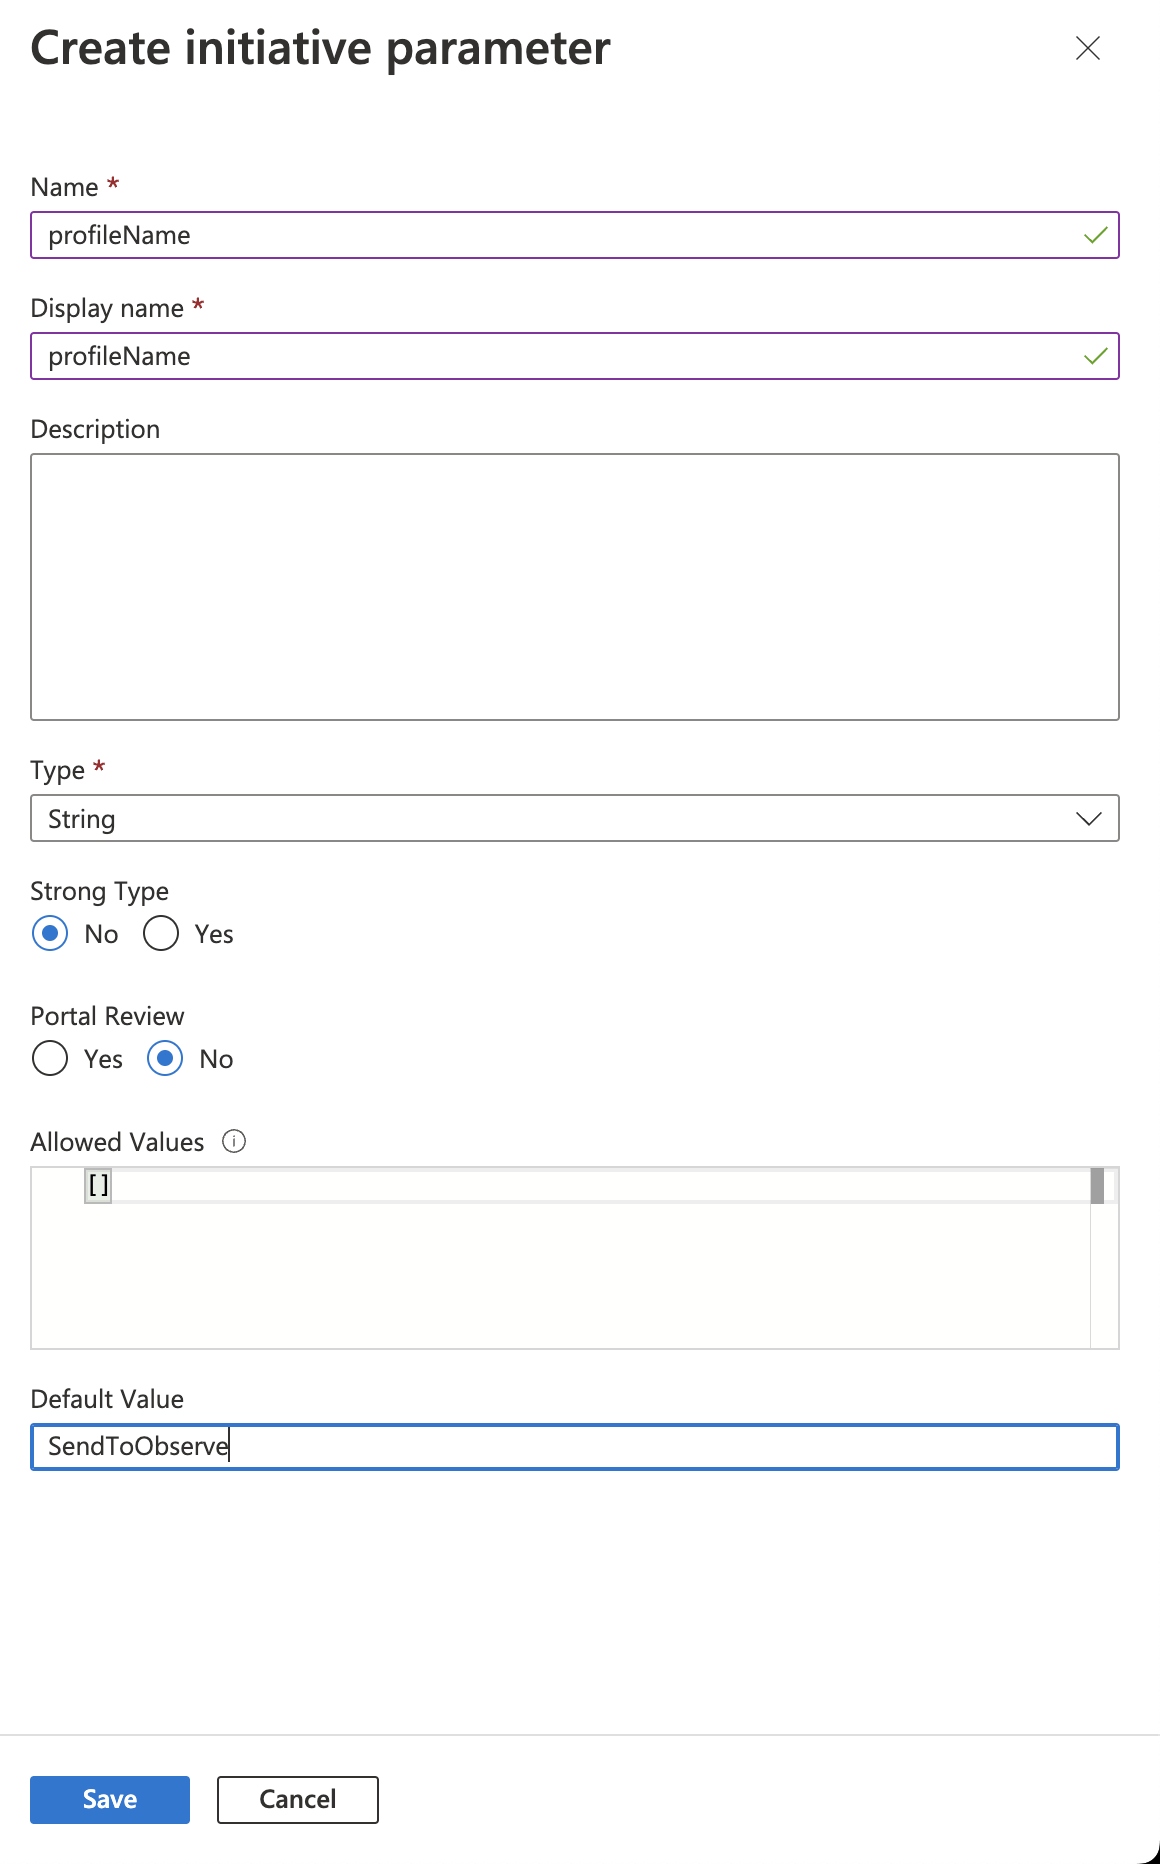
- Create an initiative parameter named profileName.
- Set the type to string, and then set the default value to SendToObserve.
- Click Save.
- Navigate to the Policy Parameters section.
- Clear the Only show parameters that need input or review checkbox.
- Set every Value Type to Use Initiative Parameter and select the corresponding initiative parameter.
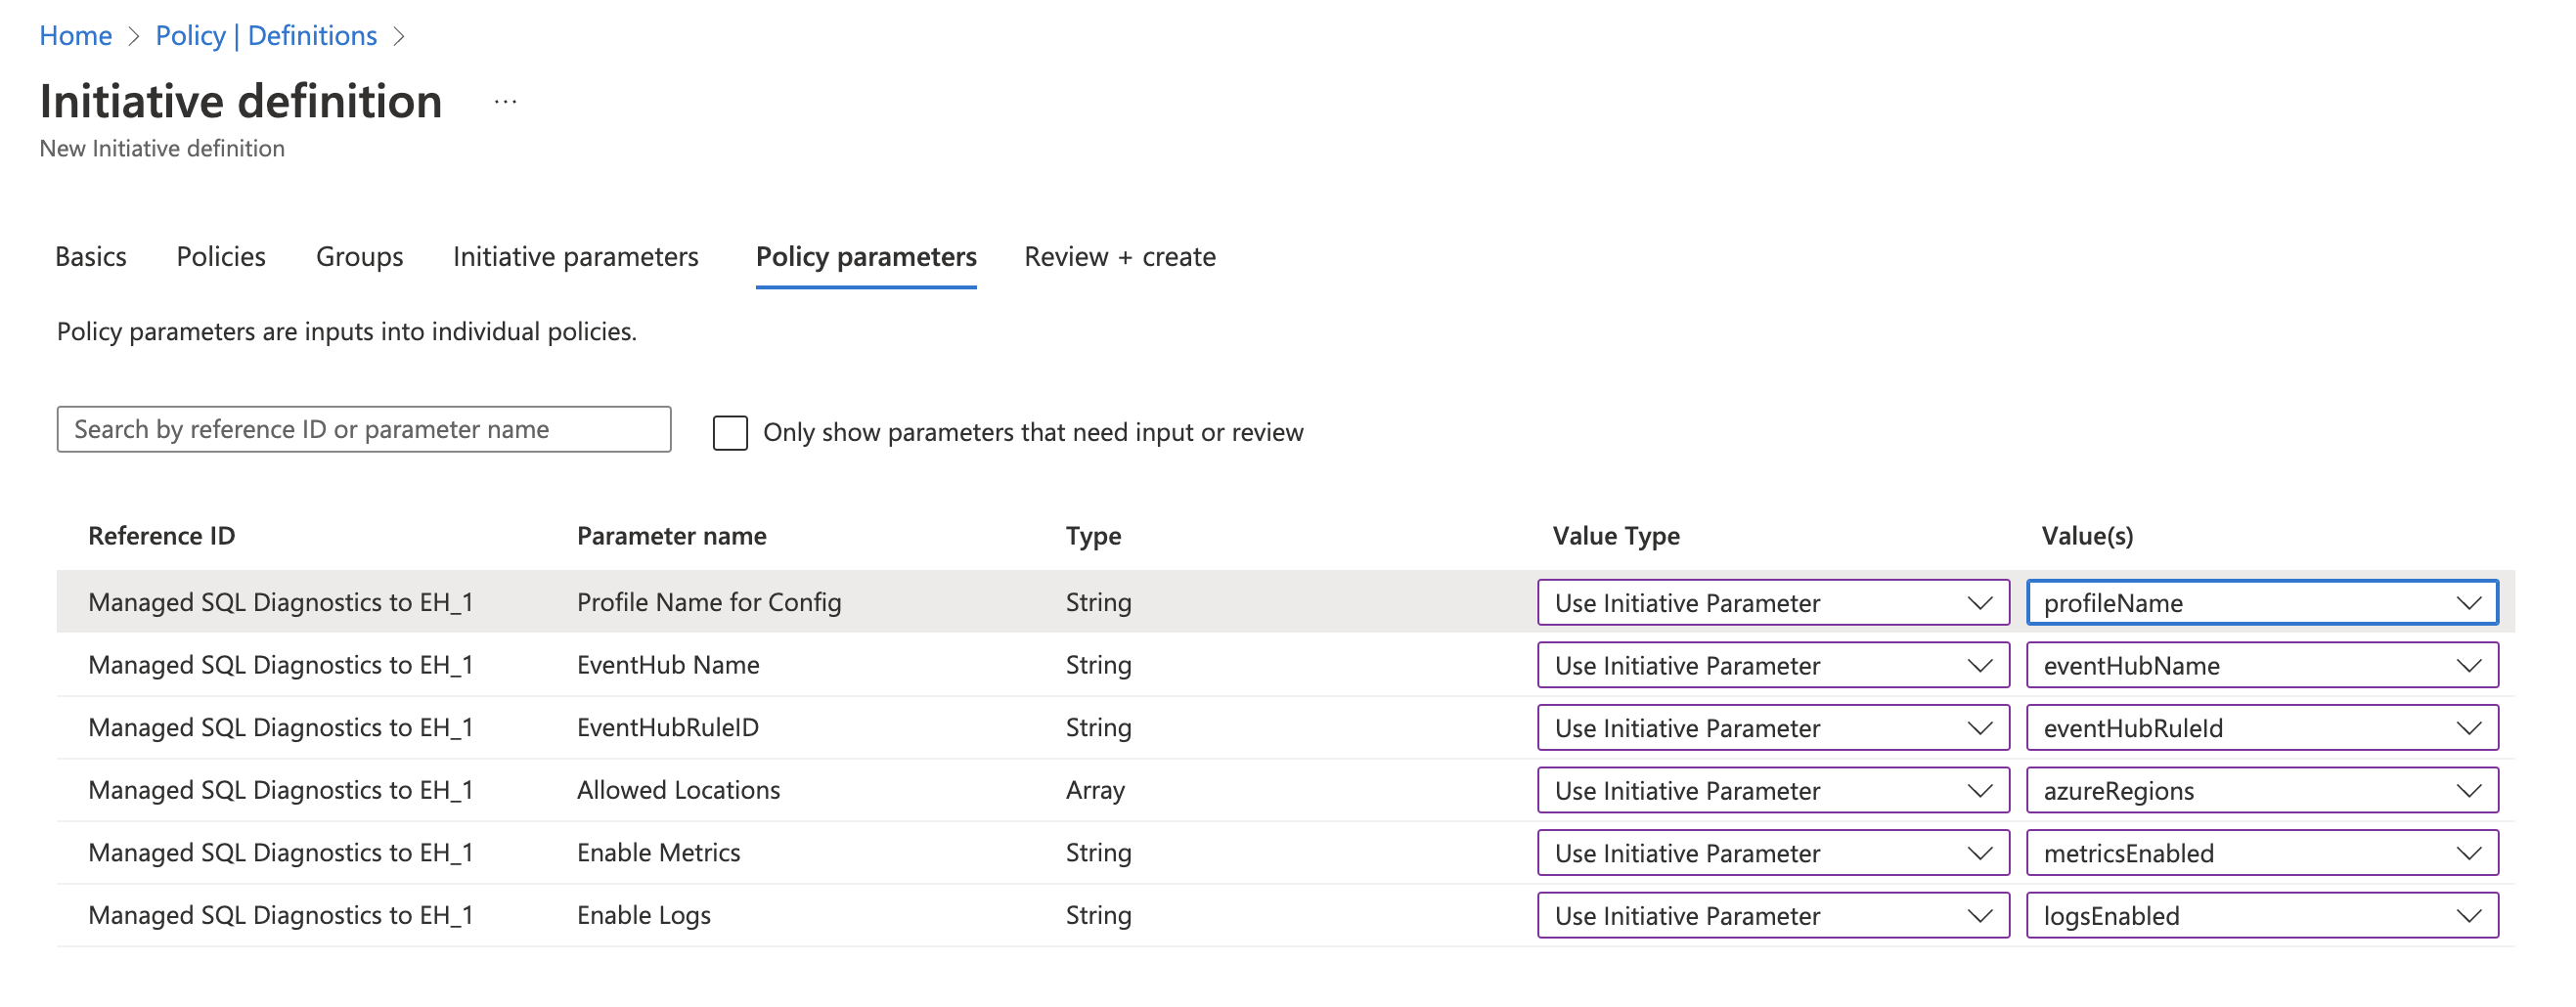
- Click Review and then Create.
Assigning the Initiative
Assign the initiative to each region you want to monitor using the following steps:
- Log into the Azure portal.
- In the Azure search field, enter Policy.
- Select Assignments.
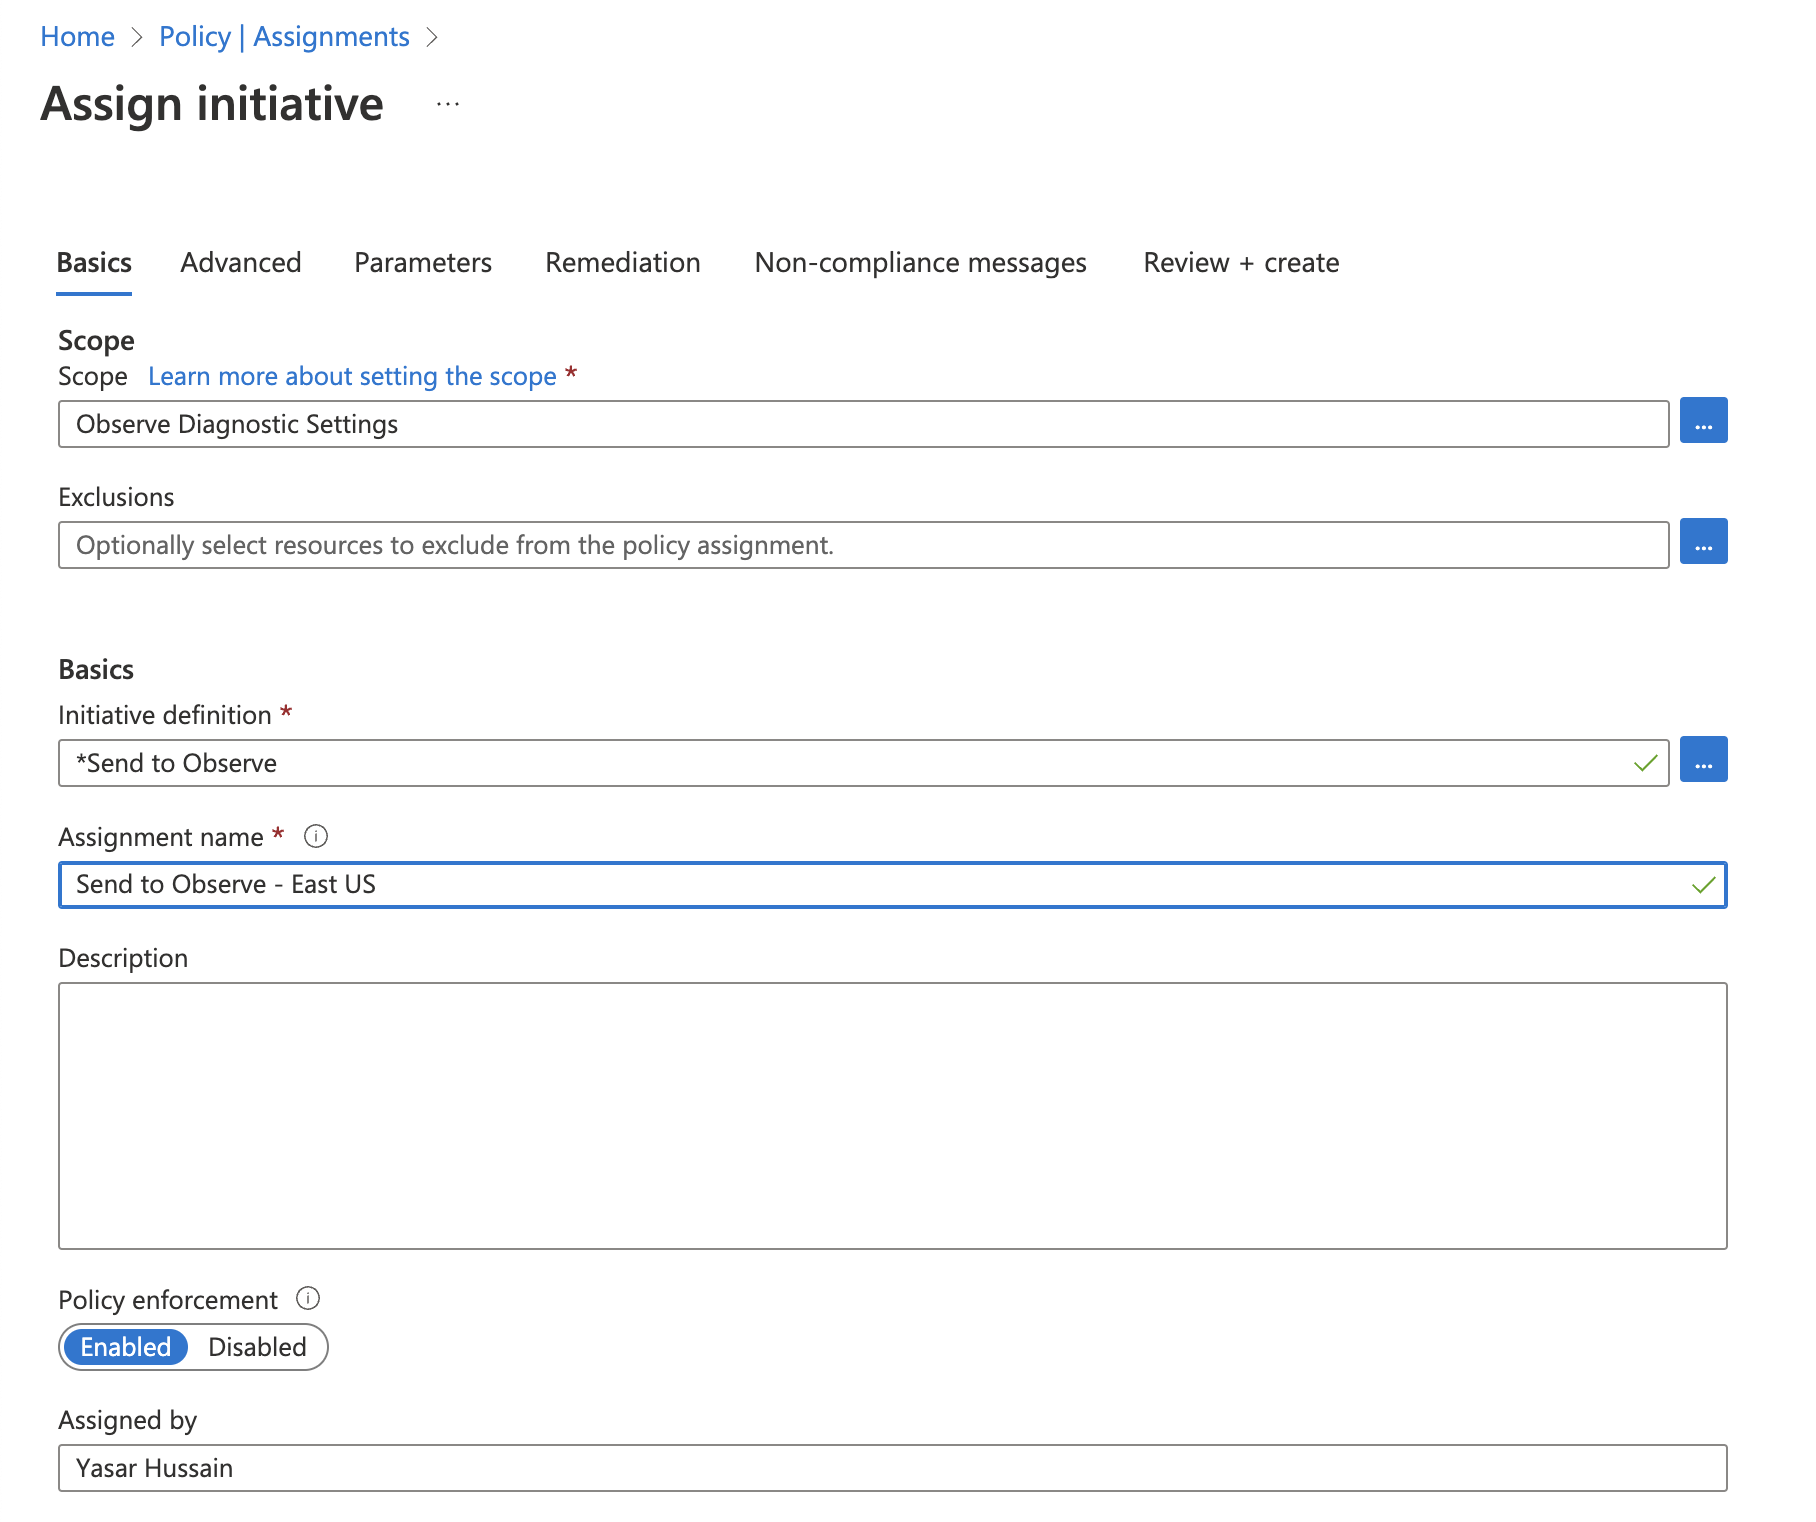
- Click Assign Initiative.
- Choose the management group created in the previous step as the Scope.
- Select the Send to Observe initiative created in the previous section.
- Name the assignment
Send to Observe - <location>.
- Click Parameters.
- Clear the Only show parameters that need input or review checkbox.
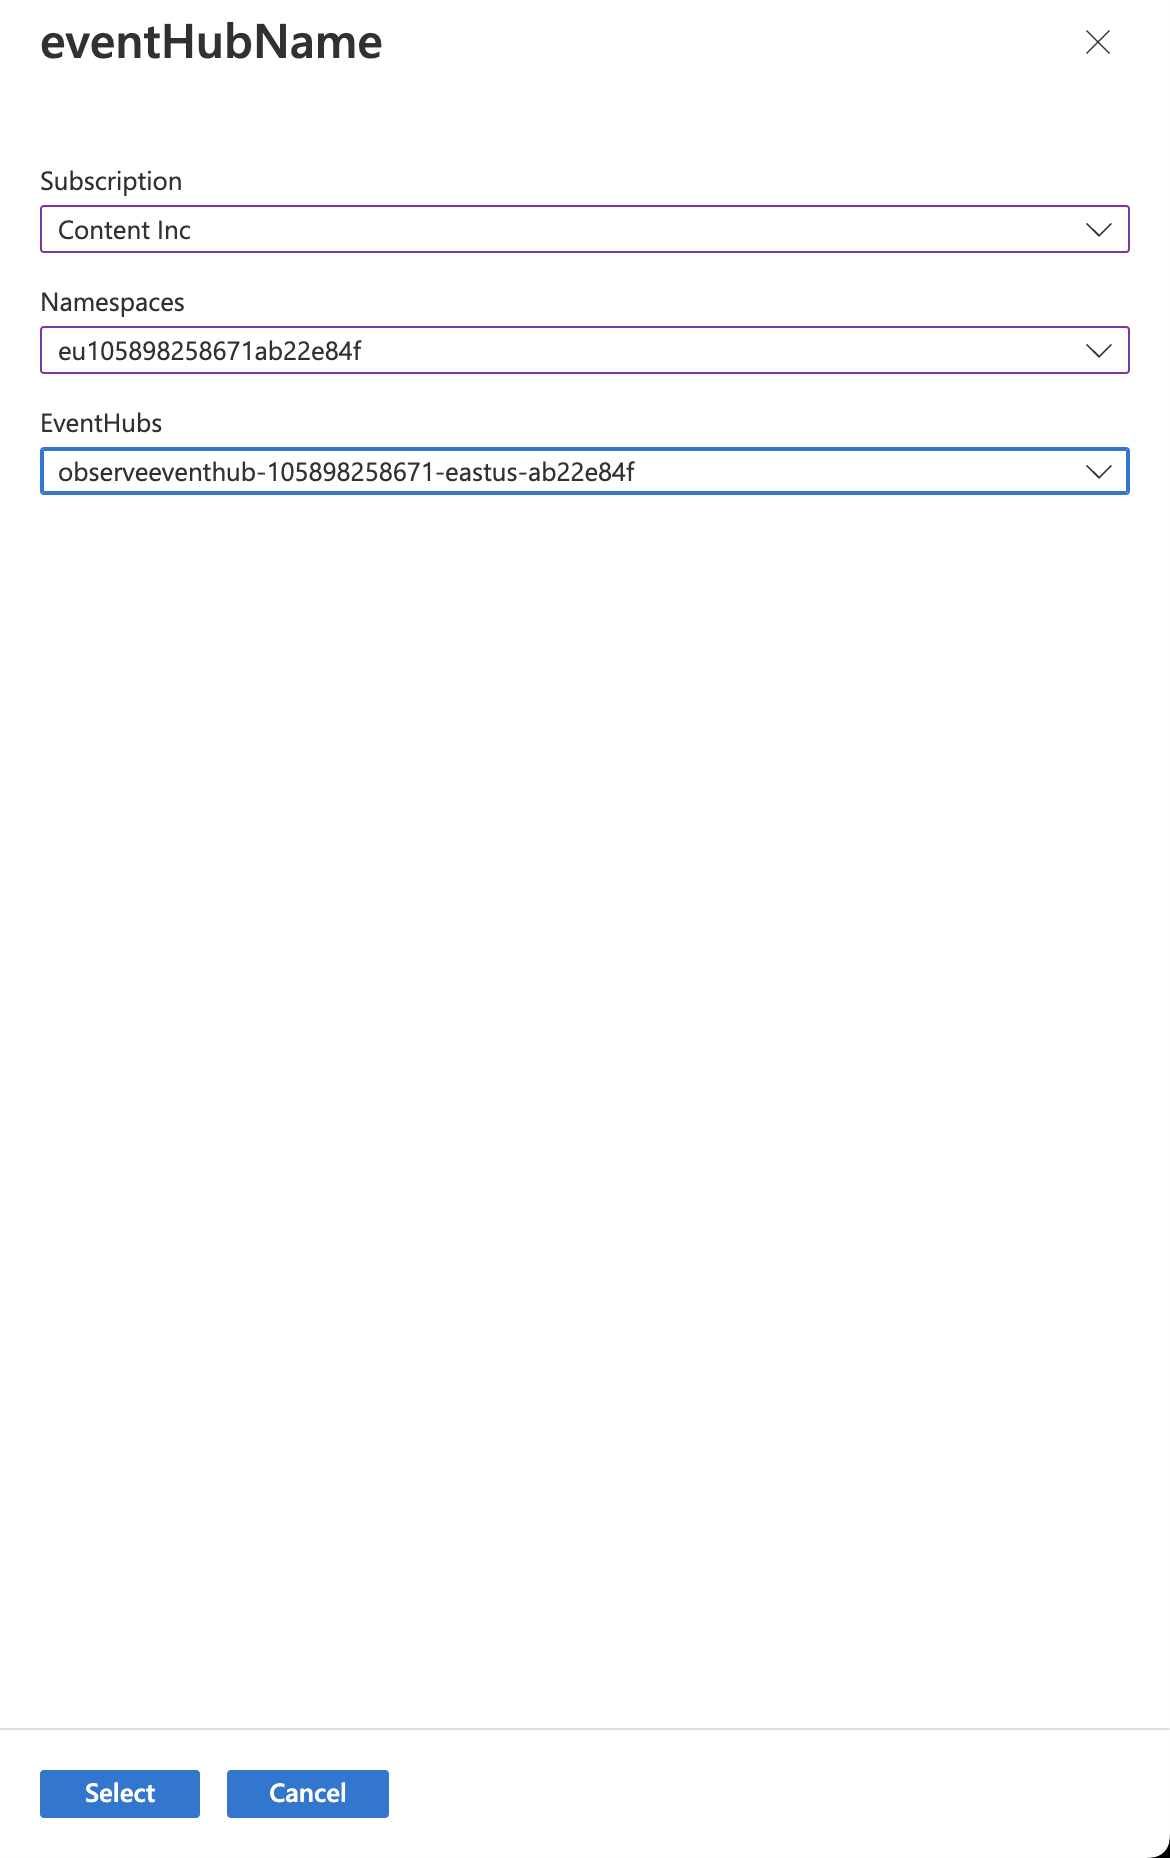
- Select the region to deploy for the azureRegions parameter.
- Select the eventhub name from the region.
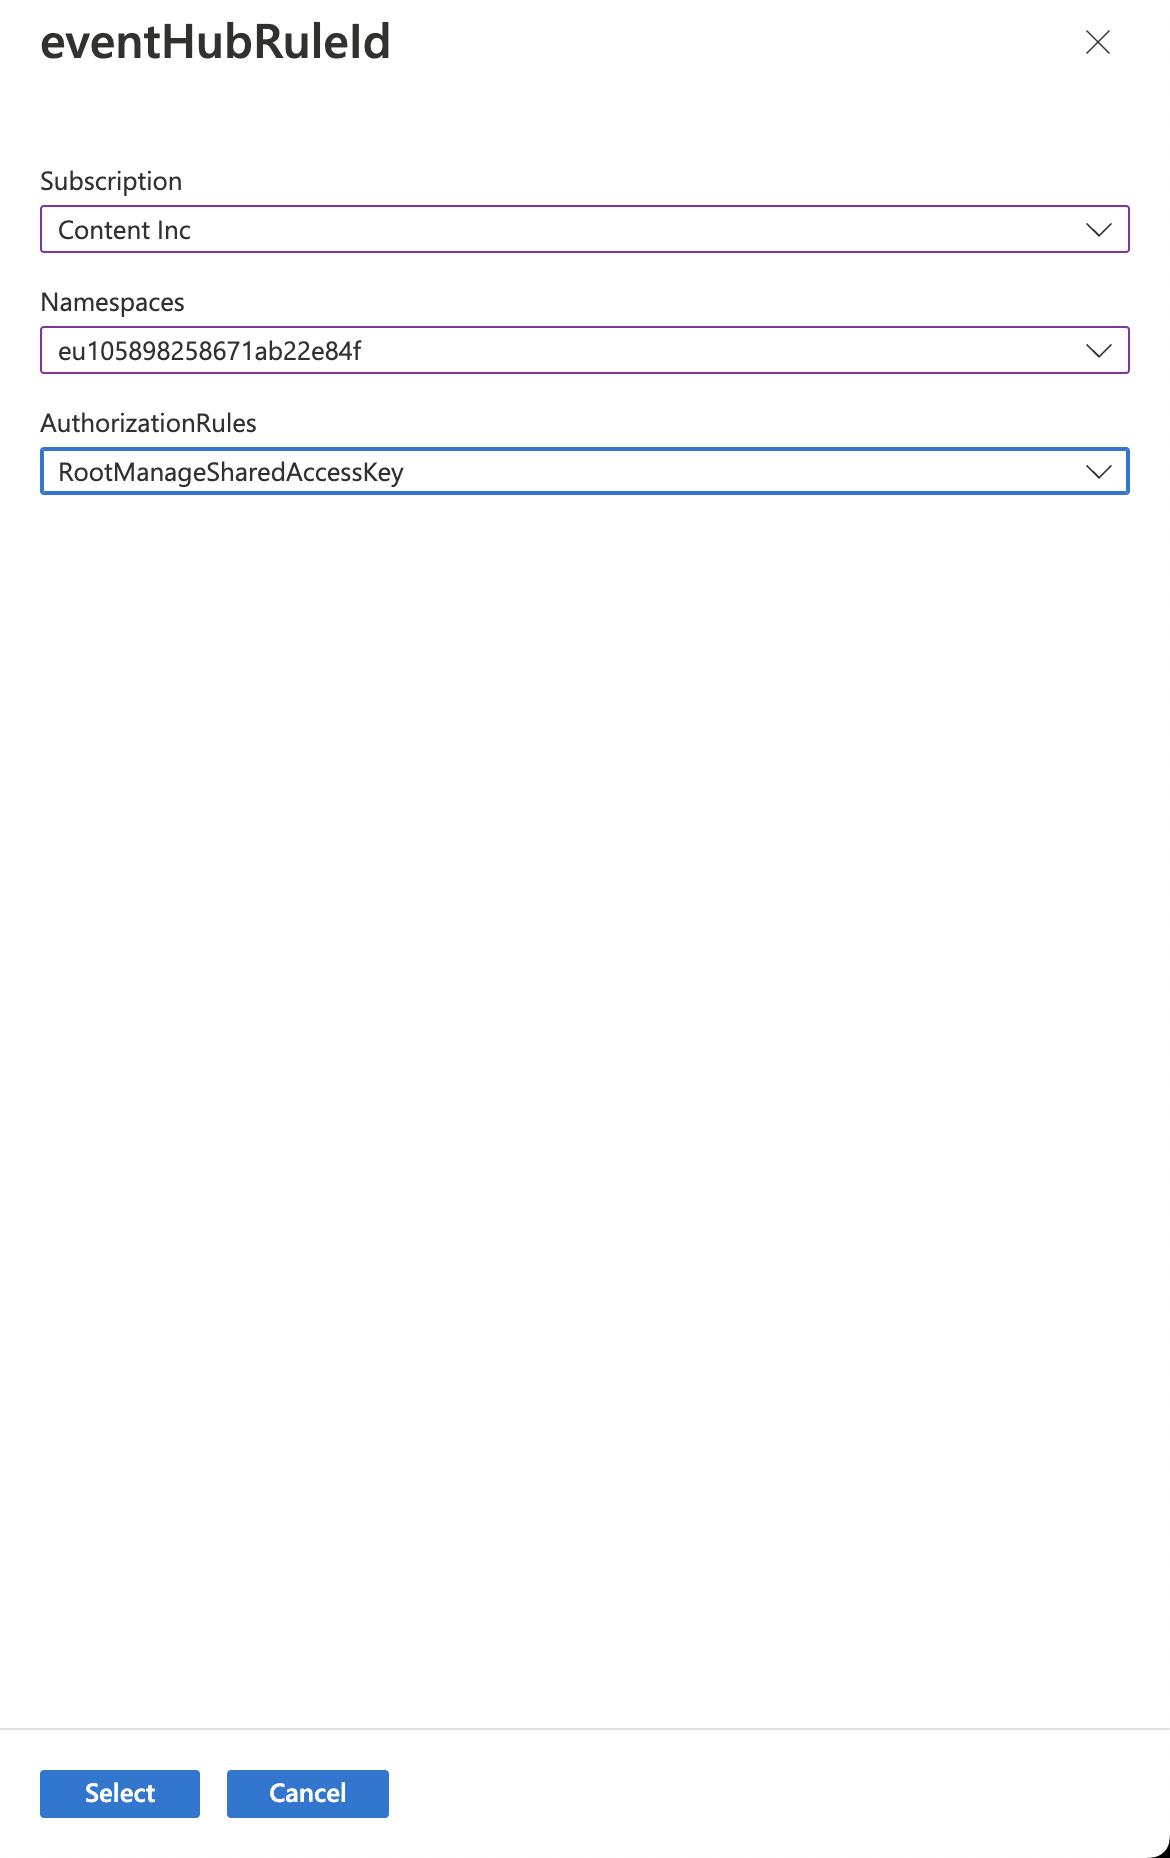
- Select the Eventhub authorization rule for the Eventhub.
- Review the parameters.
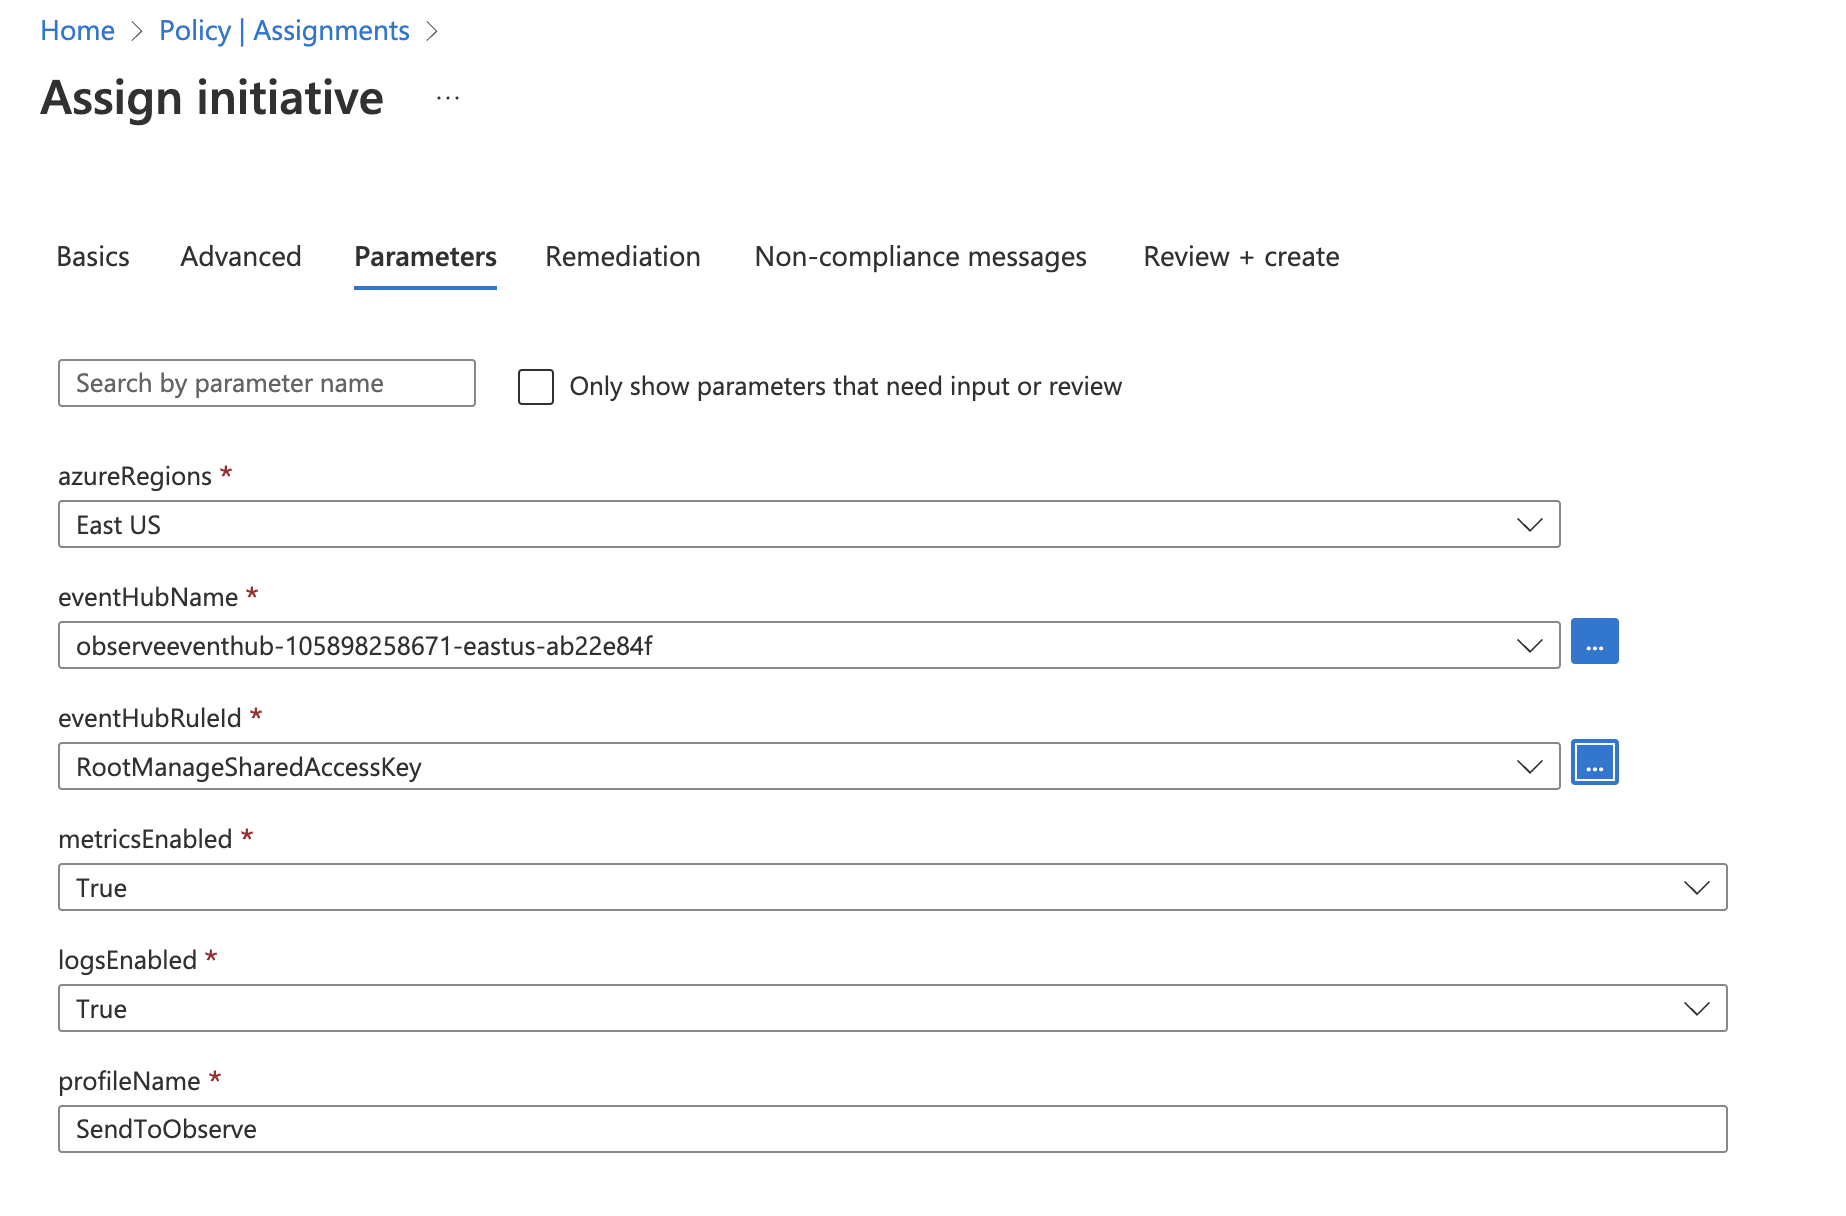
- Click Review + create and then Create.
Once you create the assignment, any new resources of the resource type automatically receive the diagnostic settings to send to Observe created a short period after you create the resource.
Remediation
To remediate non-compliant resources from the Azure portal, perform the following steps:
- Log into the Azure portal.
- In the Azure search field, enter Policy.
- Click Remediation.
- Find the policy for the resource type you want to remediate and click the 3 dots.
- Click Remediate.
- Click Remediate again on the Remediation page.
This creates the diagnostic settings for all of those resources sent to Observe.
Updated 6 months ago