Install on Linux
This page provides instructions for installing the Observe Agent on a Linux system to collect metrics, logs, and application telemetry—including OpenTelemetry traces—and forward them to Observe. The following data is collected and sent to Observe:
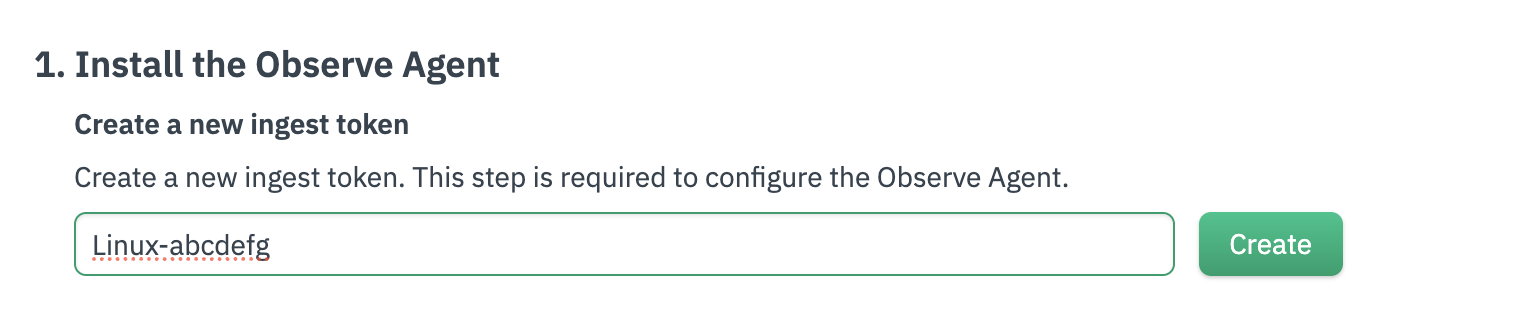
Create an ingest token
Create an ingest token in the Add Data portal, and be sure to record this token in a safe place, as you will need to provide it during the installation.
- From the left navigation, click Data & integrations > Add Data.
- Click Linux.
- Click Create to generate a new ingest token.
Install the Observe Agent
Use the Add Data portal in the product to get the Observe Agent installed in your environment.
Install the observe-agent package. You’ll need to first add the Observe YUM repository to your trusted repositories in your yum.repos.d folder.
echo '[fury]
name=Gemfury Private Repo
baseurl=https://yum.fury.io/observeinc/
enabled=1
gpgcheck=0' | sudo tee /etc/yum.repos.d/fury.repo

sudo yum install observe-agent
To validate that the agent is installed correctly, you can run the version command.
observe-agent versionInstall the observe-agent package. You’ll need to first add the Observe debian repository to your trusted depositories in your sources.list.d file.
echo 'deb [trusted=yes] https://repo.observeinc.com/apt/ /' | sudo tee /etc/apt/sources.list.d/observeinc.list
sudo apt update
sudo apt install observe-agent
To validate that the agent is installed correctly, you can run the version command.
observe-agent versionIf you don't have yum or apt on your system, you can download and install the observe-agent using our official bash script.
curl -OL "https://github.com/observeinc/observe-agent/releases/latest/download/install_linux.sh"
bash install_linux.sh --token=<YOUR_INGEST_TOKEN> --observe_url=<YOUR OBSERVE COLLECTION ENDPOINT> --logs_enabled=true --metrics_enabled=true
This will install the agent locally and initialize the configuration. If your installation uses systemd, the agent will be added as a service and started automatically.
To validate that the agent is installed correctly, you can run the version command.
observe-agent versionConfigure the Observe Agent
You can configure the Observe Agent automatically or manually.
Configure the Observe Agent automatically
The easiest way to initialize the agent configuration is to use the observe-agent init-config command by replacing the contents of the agent configuration file with the config file below.
- Replace
<YOUR_INGEST_TOKEN>with your instance’s ingest token you create from the Add Data for Linux page (ex: a1b2c3d4e5f6g7h8i9k0:l1m2n3o4p5q6r7s8t9u0v1w2x3y4z5a6) - Replace
<YOUR_OBSERVE_COLLECTION_ENDPOINT>with your instance’s collection endpoint (ex: https://123456789012.collect.observeinc.com/). For more information on configuring the agent, see Configuration.
sudo observe-agent init-config \
--token <YOUR_INGEST_TOKEN> \
--observe_url <YOUR_OBSERVE_COLLECTION_ENDPOINT> \
--forwarding::metrics::output_format=otel \
--self_monitoring::enabled=true \
--host_monitoring::enabled=true \
--host_monitoring::logs::enabled=true \
--host_monitoring::metrics::host::enabled=true \
--host_monitoring::metrics::process::enabled=false
This is only recommended for initial configuration. For subsequent changes, use manual configuration.
Configure the Observe Agent manually
Use manual configuration when you want to make changes to the default values.
Open the agent config file /etc/observe-agent/observe-agent.yaml with superuser permissions which will allow you to edit and save changes to the file.
sudo vi /etc/observe-agent/observe-agent.yamlReplace the contents of the agent configuration file with the config file below.
- Replace
<YOUR_INGEST_TOKEN>with your instance’s ingest token you create from the Add Data for Linux page (ex: a1b2c3d4e5f6g7h8i9k0:l1m2n3o4p5q6r7s8t9u0v1w2x3y4z5a6) - Replace
<YOUR_OBSERVE_COLLECTION_ENDPOINT>with your instance’s collection endpoint (ex: https://123456789012.collect.observeinc.com/). For more information on configuring the agent, see Configuration.
Some Observe instances may optionally use a name instead of Customer ID; if this is the case for your instance, contact your Observe Data Engineer to discuss implementation. A stem name will work as is, but a DNS redirect name may require client configuration.
# Observe data token (ex: a1b2c3d4e5f6g7h8i9k0:l1m2n3o4p5q6r7s8t9u0v1w2x3y4z5a6)
token: "<YOUR_INGEST_TOKEN>"

# Target Observe collection url (ex: https://123456789012.collect.observeinc.com/)
observe_url: "<YOUR_OBSERVE_COLLECTION_ENDPOINT>"

# Debug mode - Sets agent log level to debug
debug: false

# Enable forwarding of local app metrics and traces
forwarding:
  enabled: true
  metrics:
    output_format: otel

# collect metrics and logs pertaining to the agent itself
self_monitoring:
  enabled: true

# collect metrics and logs about the host system
host_monitoring:
  enabled: true
  # collect logs of all running processes from the host system
  logs:
    enabled: true
    include:
      - /var/log/**/*.log
      - /var/log/syslog
  metrics:
    # collect metrics about the host system
    host:
      enabled: true
    # collect metrics about the processes running on the host system
    process:
      enabled: false

# otel_config_overrides:
#   exporters:
#     # This is a net new exporter
#     debug:
#       verbosity: detailed
#       sampling_initial: 5
#       sampling_thereafter: 200
#   service:
#     pipelines:
#       # This will override the existing metrics/host_monitoring pipeline and output to stdout debug instead
#       metrics/host_monitoring_host:
#         receivers: [hostmetrics/host-monitoring-host]
#         processors: [memory_limiter]
#         exporters: [debug]
#       # This is a net new pipeline
#       logs/new-pipeline:
#         receivers: [filelog/host_monitoring]
#         processors: [memory_limiter]
#         exporters: [debug]
Open the agent config file /etc/observe-agent/observe-agent.yaml with superuser permissions which will allow you to edit and save changes to the file.
sudo vim /etc/observe-agent/observe-agent.yamlReplace the contents of the agent configuration file with the config file below.
- Replace
<YOUR_INGEST_TOKEN>with your instance’s ingest token you create from the Add Data for Linux page (ex: a1b2c3d4e5f6g7h8i9k0:l1m2n3o4p5q6r7s8t9u0v1w2x3y4z5a6) - Replace
<YOUR_OBSERVE_COLLECTION_ENDPOINT>with your instance’s collection endpoint (ex: https://123456789012.collect.observeinc.com/). For more information on configuring the agent, see Configuration.
Some Observe instances may optionally use a name instead of Customer ID; if this is the case for your instance, contact your Observe Data Engineer to discuss implementation. A stem name will work as is, but a DNS redirect name may require client configuration.
# Observe data token (ex: a1b2c3d4e5f6g7h8i9k0:l1m2n3o4p5q6r7s8t9u0v1w2x3y4z5a6)
token: "<YOUR_INGEST_TOKEN>"

# Target Observe collection url (ex: https://123456789012.collect.observeinc.com/)
observe_url: "<YOUR_OBSERVE_COLLECTION_ENDPOINT>"

# Debug mode - Sets agent log level to debug
debug: false

# Enable forwarding of local app metrics and traces
forwarding:
  enabled: true
  metrics:
    output_format: otel

# collect metrics and logs pertaining to the agent itself
self_monitoring:
  enabled: true

# collect metrics and logs about the host system
host_monitoring:
  enabled: true
  # collect logs of all running processes from the host system
  logs:
    enabled: true
    include:
      - /var/log/**/*.log
      - /var/log/syslog
  metrics:
    # collect metrics about the host system
    host:
      enabled: true
    # collect metrics about the processes running on the host system
    process:
      enabled: false

# otel_config_overrides:
#   exporters:
#     # This is a net new exporter
#     debug:
#       verbosity: detailed
#       sampling_initial: 5
#       sampling_thereafter: 200
#   service:
#     pipelines:
#       # This will override the existing metrics/host_monitoring pipeline and output to stdout debug instead
#       metrics/host_monitoring_host:
#         receivers: [hostmetrics/host-monitoring-host]
#         processors: [memory_limiter]
#         exporters: [debug]
#       # This is a net new pipeline
#       logs/new-pipeline:
#         receivers: [filelog/host_monitoring]
#         processors: [memory_limiter]
#         exporters: [debug]
Start the Observe Agent
Now that the configuration is in place, you can start the agent with the following command:
sudo systemctl enable --now observe-agentYou can then run the status command to see statistics and information about the agent.
observe-agent statusSend application data to Observe
Once the Observe Agent is deployed, configure your application instrumentation or set the OTEL_EXPORTER_OTLP_ENDPOINT environment variable to one of the following addresses to send application telemetry, including traces, to the Observe Agent.
NoteWhen setting up the endpoint to send traces, make sure you use the path that your OTLP library requires. Some libraries need traces to go to
/v1/traces, while others expect them at the root path/.
- OTLP/HTTP endpoint: http://localhost:4318
- OTLP/grpc endpoint: http://localhost:4317
See APM instrumentation for more information about how to instrument your app for observability.
Uninstall the Observe Agent
Use the following commands to uninstall the Observe Agent:
You can uninstall the agent via yum after stopping the service.
sudo systemctl stop observe-agent
sudo yum erase observe-agent -y
You can uninstall the agent via apt after stopping the service.
sudo systemctl stop observe-agent
sudo apt-get purge observe-agent
Upgrade the Observe Agent
Follow the instructions for your Linux environment to upgrade the Observe Agent.
Upgrade the package version. The install process will ask if you want to replace your existing config file. Generally the default answer of N (no) is correct.
sudo yum update observe-agent
sudo yum install observe-agent
To apply the new configs and start the agent at the new version you can run the following command.
sudo systemctl restart observe-agentUpgrade the package version. The install process will ask if you want to replace your existing config file. Generally the default answer of N (no) is correct.
sudo apt update
sudo apt install --only-upgrade observe-agent
To apply the new configs and start the agent at the new version you can run the following command.
sudo systemctl restart observe-agentUpdated 6 months ago
What’s Next
Use both the Log Explorer and the Metric Explorer to monitor your systems. To analyze your trace data, explore both the Trace Explorer and the Service Explorer.