Work with alerts
When a Monitor produces alerts and notifications, the results can be reviewed in Observe as well as the notification destination. Each alert has an individual URL so that you can review or drill down into the related data, resources, and Monitor logic.
Alert Explorer
All alerts in Observe can also be reviewed in the Alert Explorer. You to quickly filter alerts by status, severity, and involved resources so that you can isolate problems. Furthermore, Alert Explorer provides robust muting controls for your alerts. See Mute a monitor.
Click Alerts in the left navigation to access the Alert Explorer:
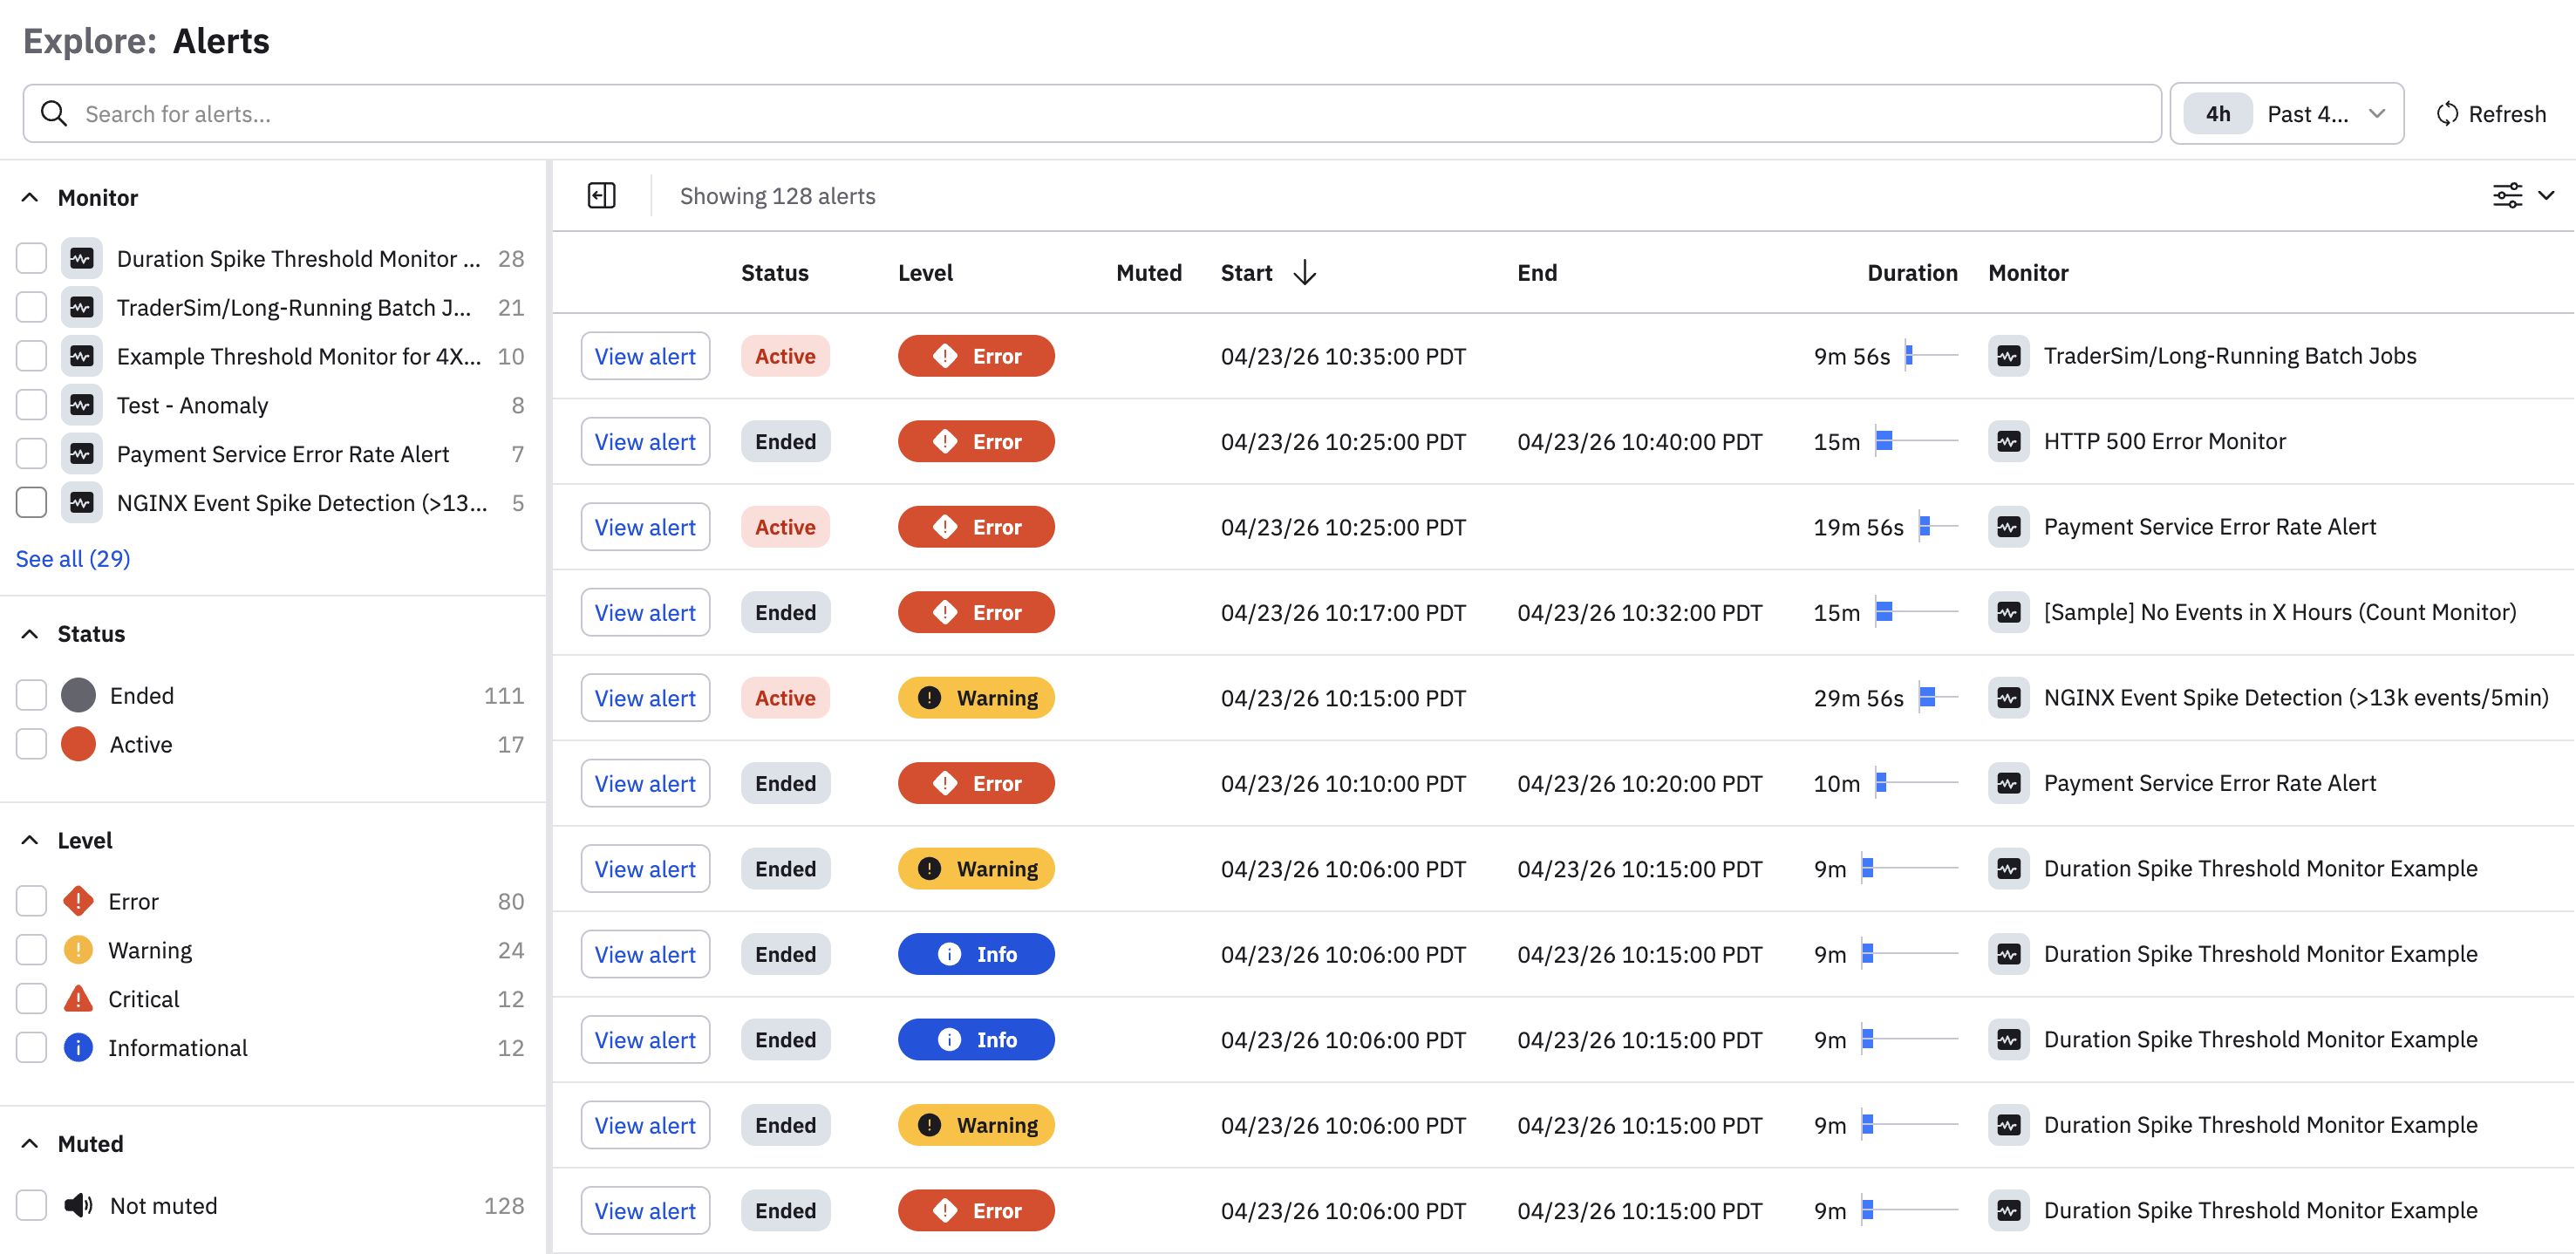
Interact with alerts
A Monitor in Observe can create multiple alerts. All alerts have a start and end time, duration, severity level, and status. You can inspect the details of a specific alert by clicking View alert next to the name of the alert in the Alert Explorer. The alert detail show the following tabs and related information:
- Overview. The Overview tab allows you to quickly view metadata about the alert, such as the user who created and last modified the monitor associated to the alert, which queries and rules are associated with this alert. Furthermore, important context such as the data that caused the alerting condition, as well as the incident chart, are directly available on this tab.
- Trigger data. This is a table view of the specific data that caused the alert to trigger. You can open this data directly in a Worksheet, to aid in deeper investigation.
- Monitor alerts. This is a list of all alerts that share a common monitor definition. Note that this can be useful when reviewing historical alert data, and is a great resource for tuning monitor queries to be more effective.
- Detection events. Detection events log the internal state of when the alert was created as well as any changes in the alert state over time.
Updated about 2 months ago