

Observe by Snowflake AI
Learn about the AI capabilities of the Observe by Snowflake platform.
This page provides some examples of how you can use AI in Observe by Snowflake to investigate your full environment, including logs, metrics, and APM (services and traces) and automatically surface root causes. Observe by Snowflake AI unifies all your telemetry and turns hours of investigation into minutes, at enterprise scale and lower cost.
Troubleshoot faster
AI SRE understands your environment end-to-end, correlating logs, metrics, and traces to pinpoint root causes and suggest fixes.
- Accelerate investigations by asking questions in the AI SRE chat interface. AI SRE correlates across logs, metrics, and traces to determine what broke and why.
- AI SRE provides a detailed list of targeted remediation steps designed to address and resolve the underlying issue.
Immediate and relevant responses from AI SRE means you can reduce the number of engineers on incidents and removes the need to jump between various tools and dashboards.
Evaluate system health
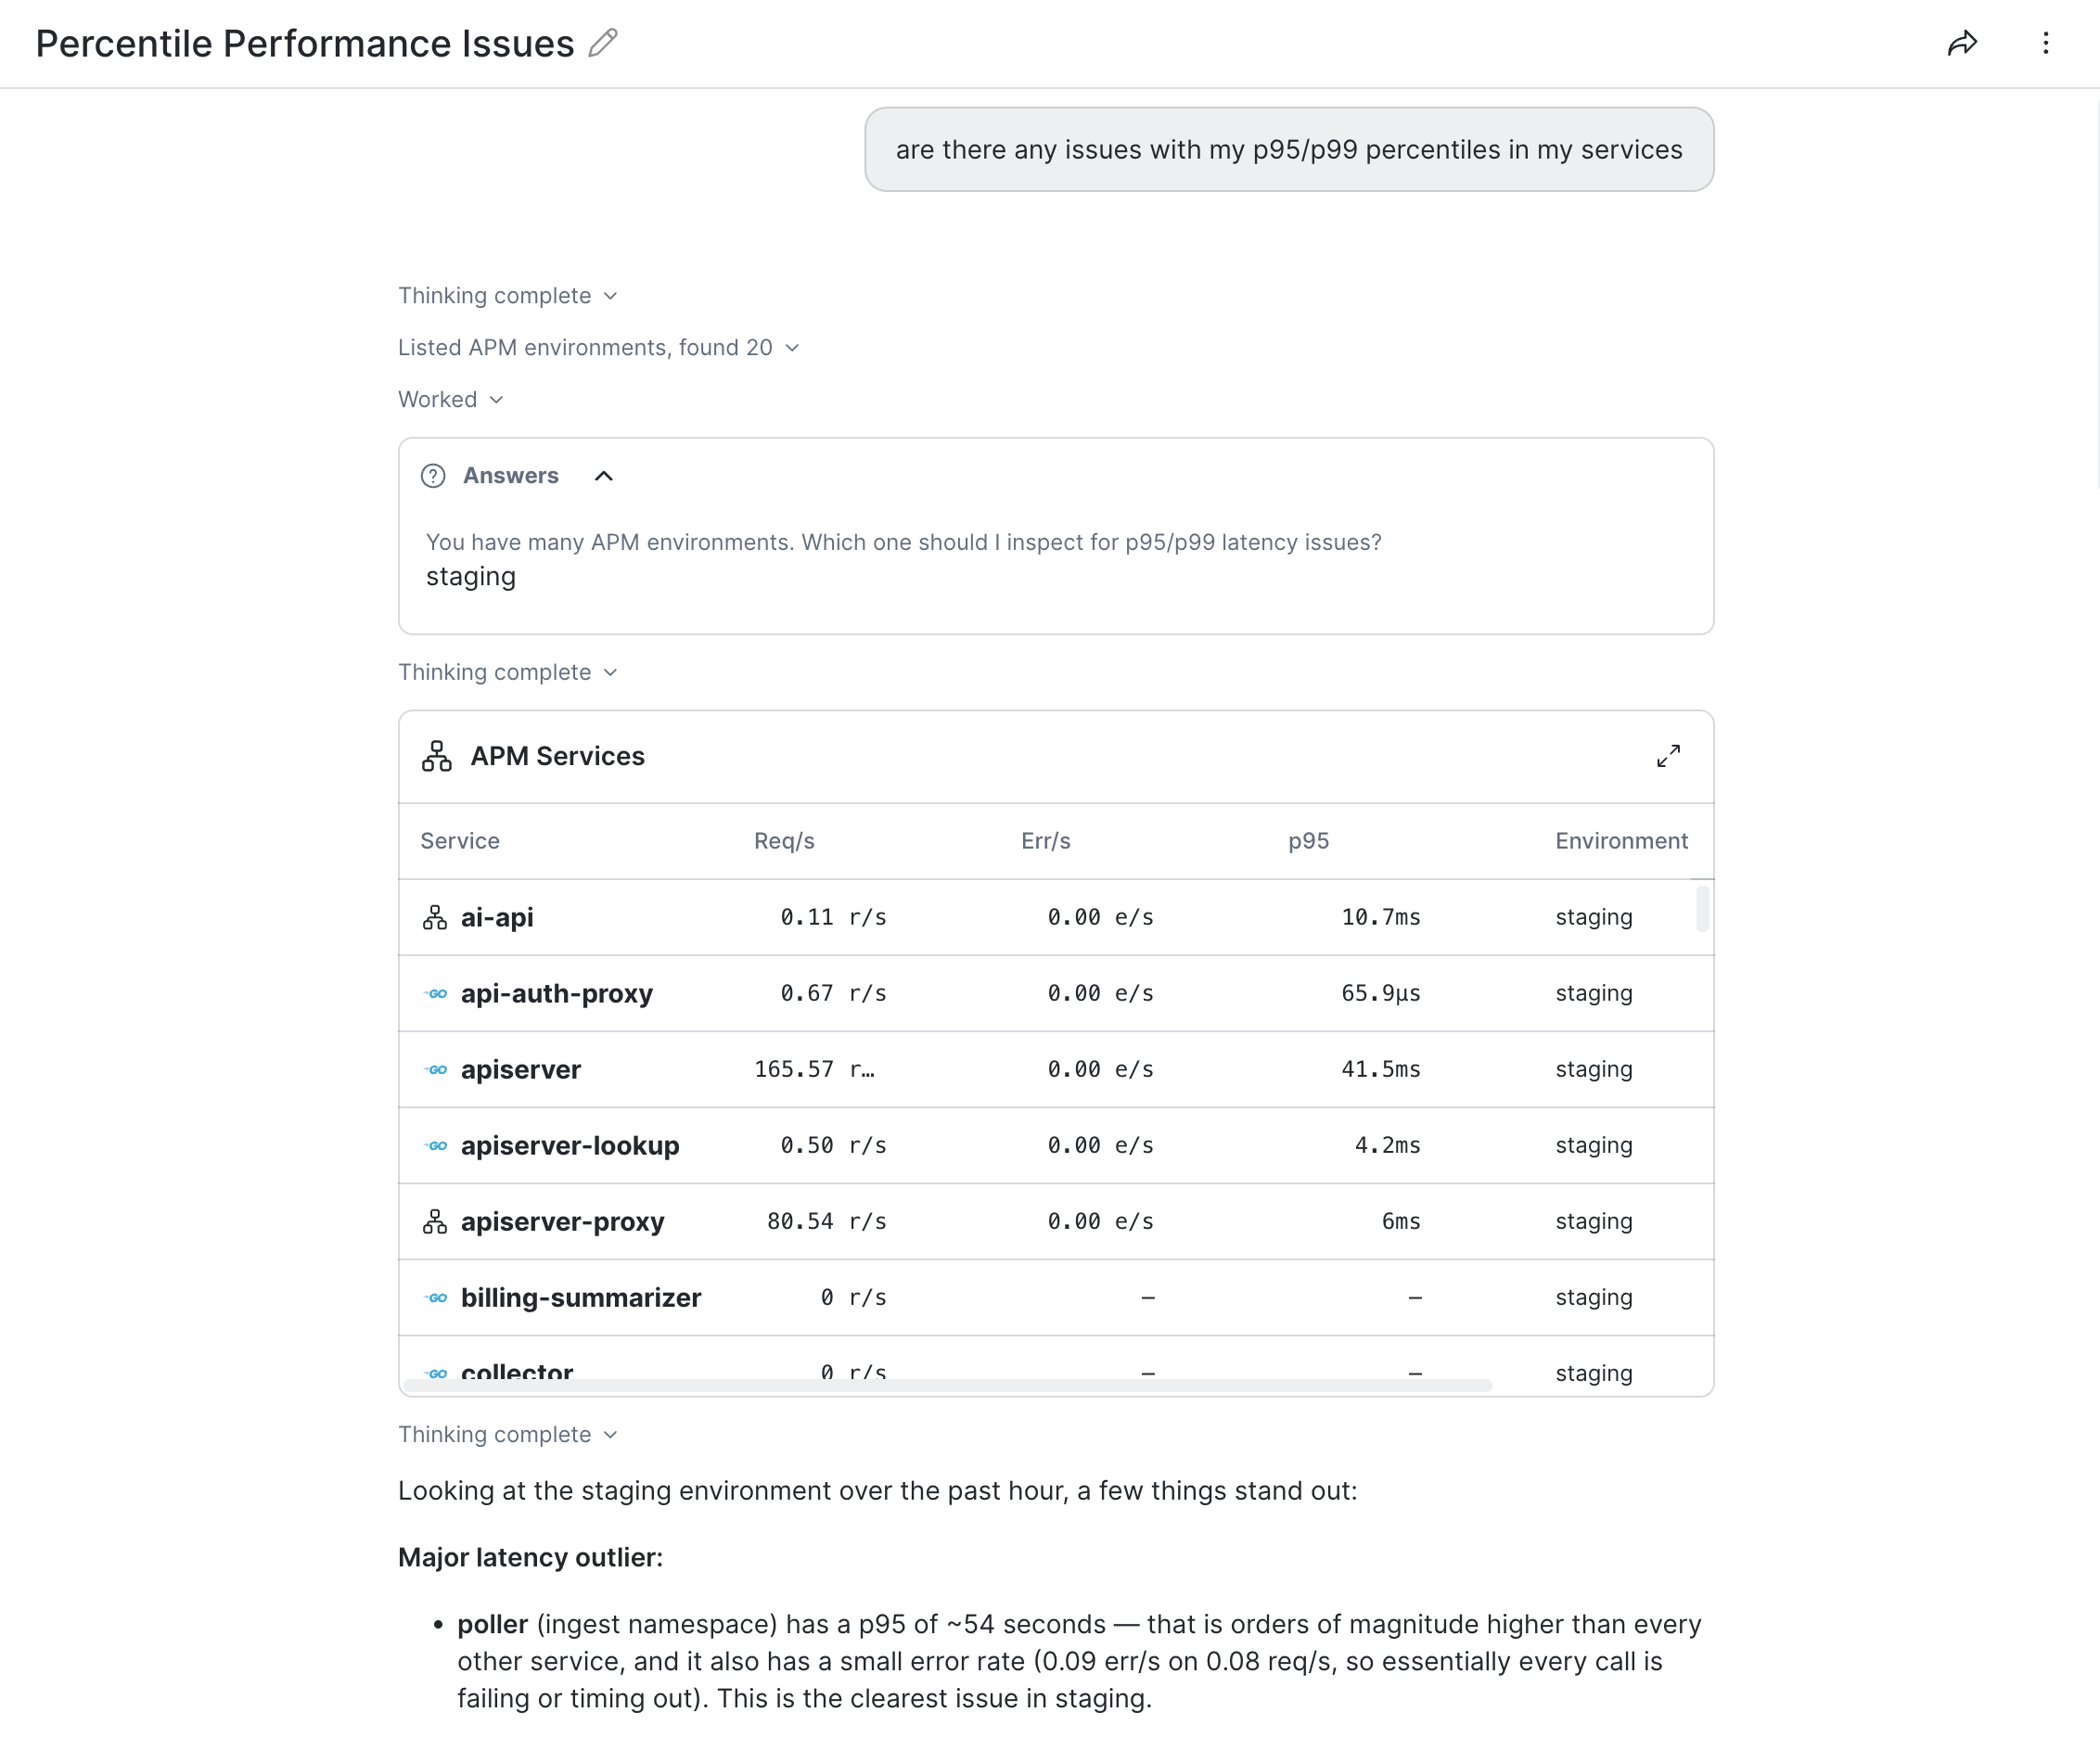
Ask AI SRE to surface any slow or failing services, EC2 instance issues, or overloaded nodes without having to look at multiple dashboards and write complex queries.
For example, you can ask AI SRE to identify issues in your p95/p99 percentiles in your services. After specifying an environment, AI SRE provides a response after analyzing various RED metrics in the specified environment:
Create and tune Monitors
Monitors provide a flexible way to alert you when conditions are matched in your data.
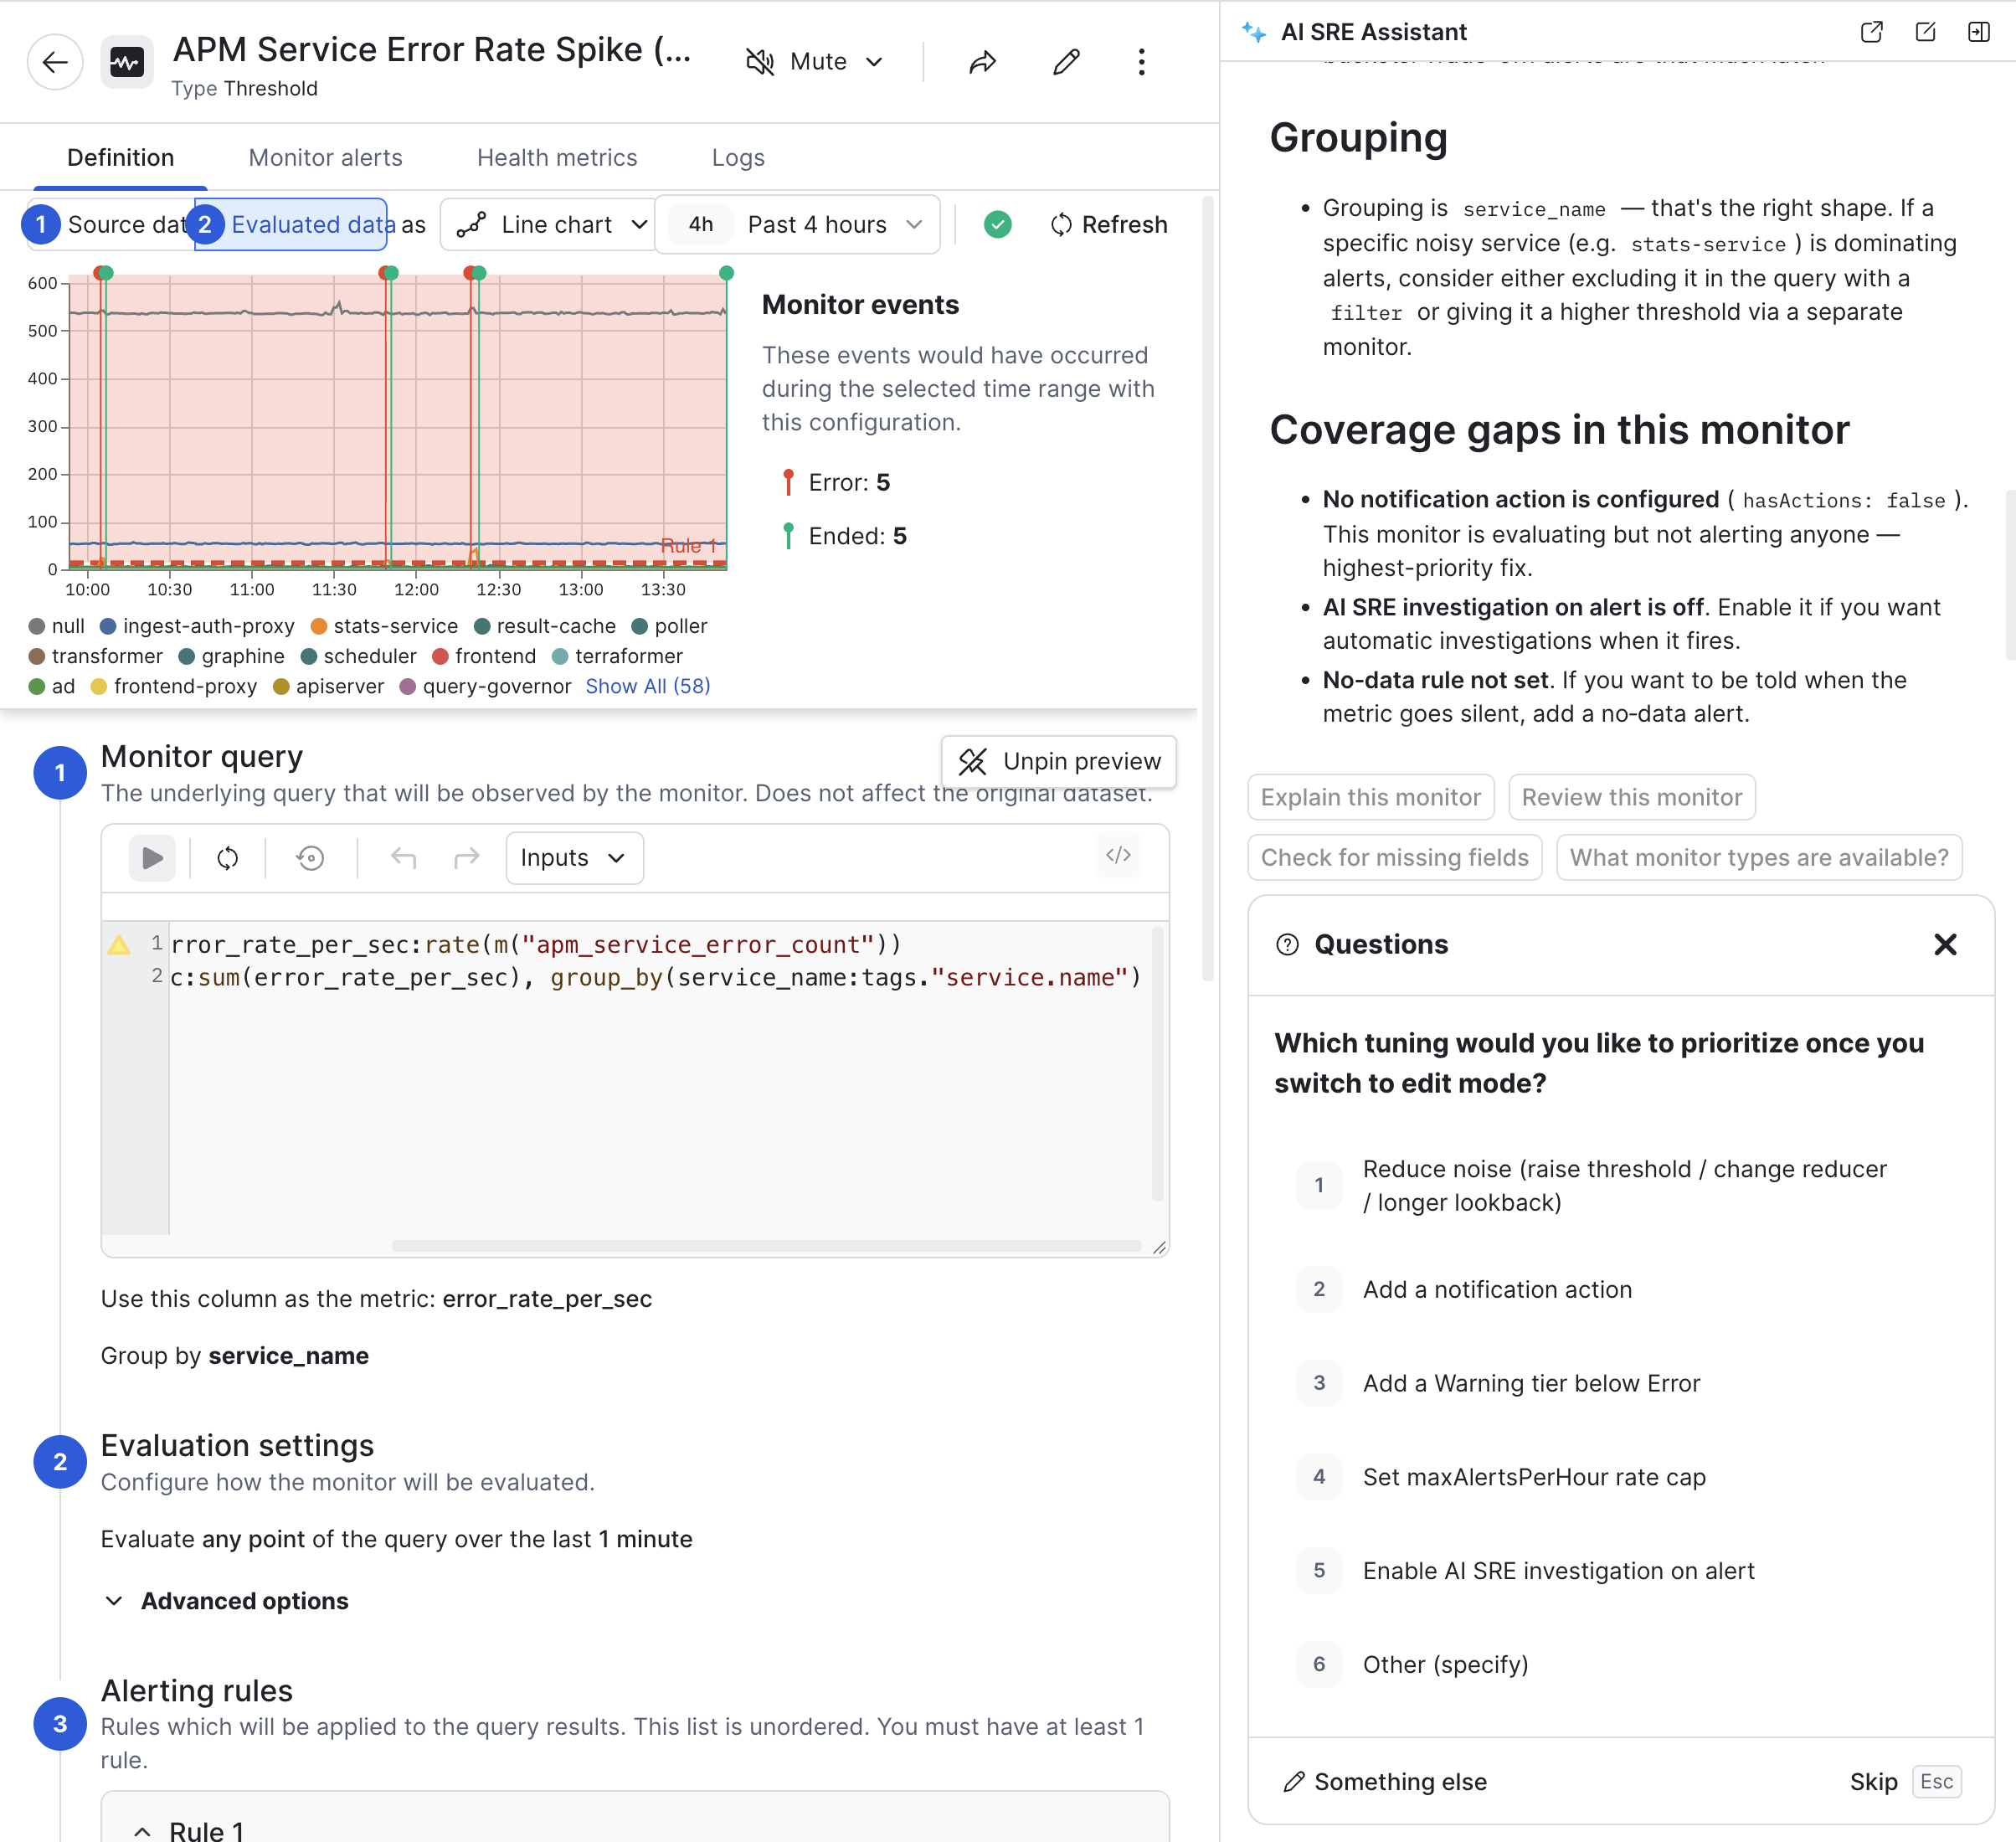
Ask AI SRE to create a Monitor from scratch or use AI to help you evaluate and tune existing Monitors. For example, after you create a Monitor, suppose you notice that is not generating alarms with the desired frequency. You can ask AI to analyze the Monitor and get suggestions for how to tune the Monitor.
Investigate traces
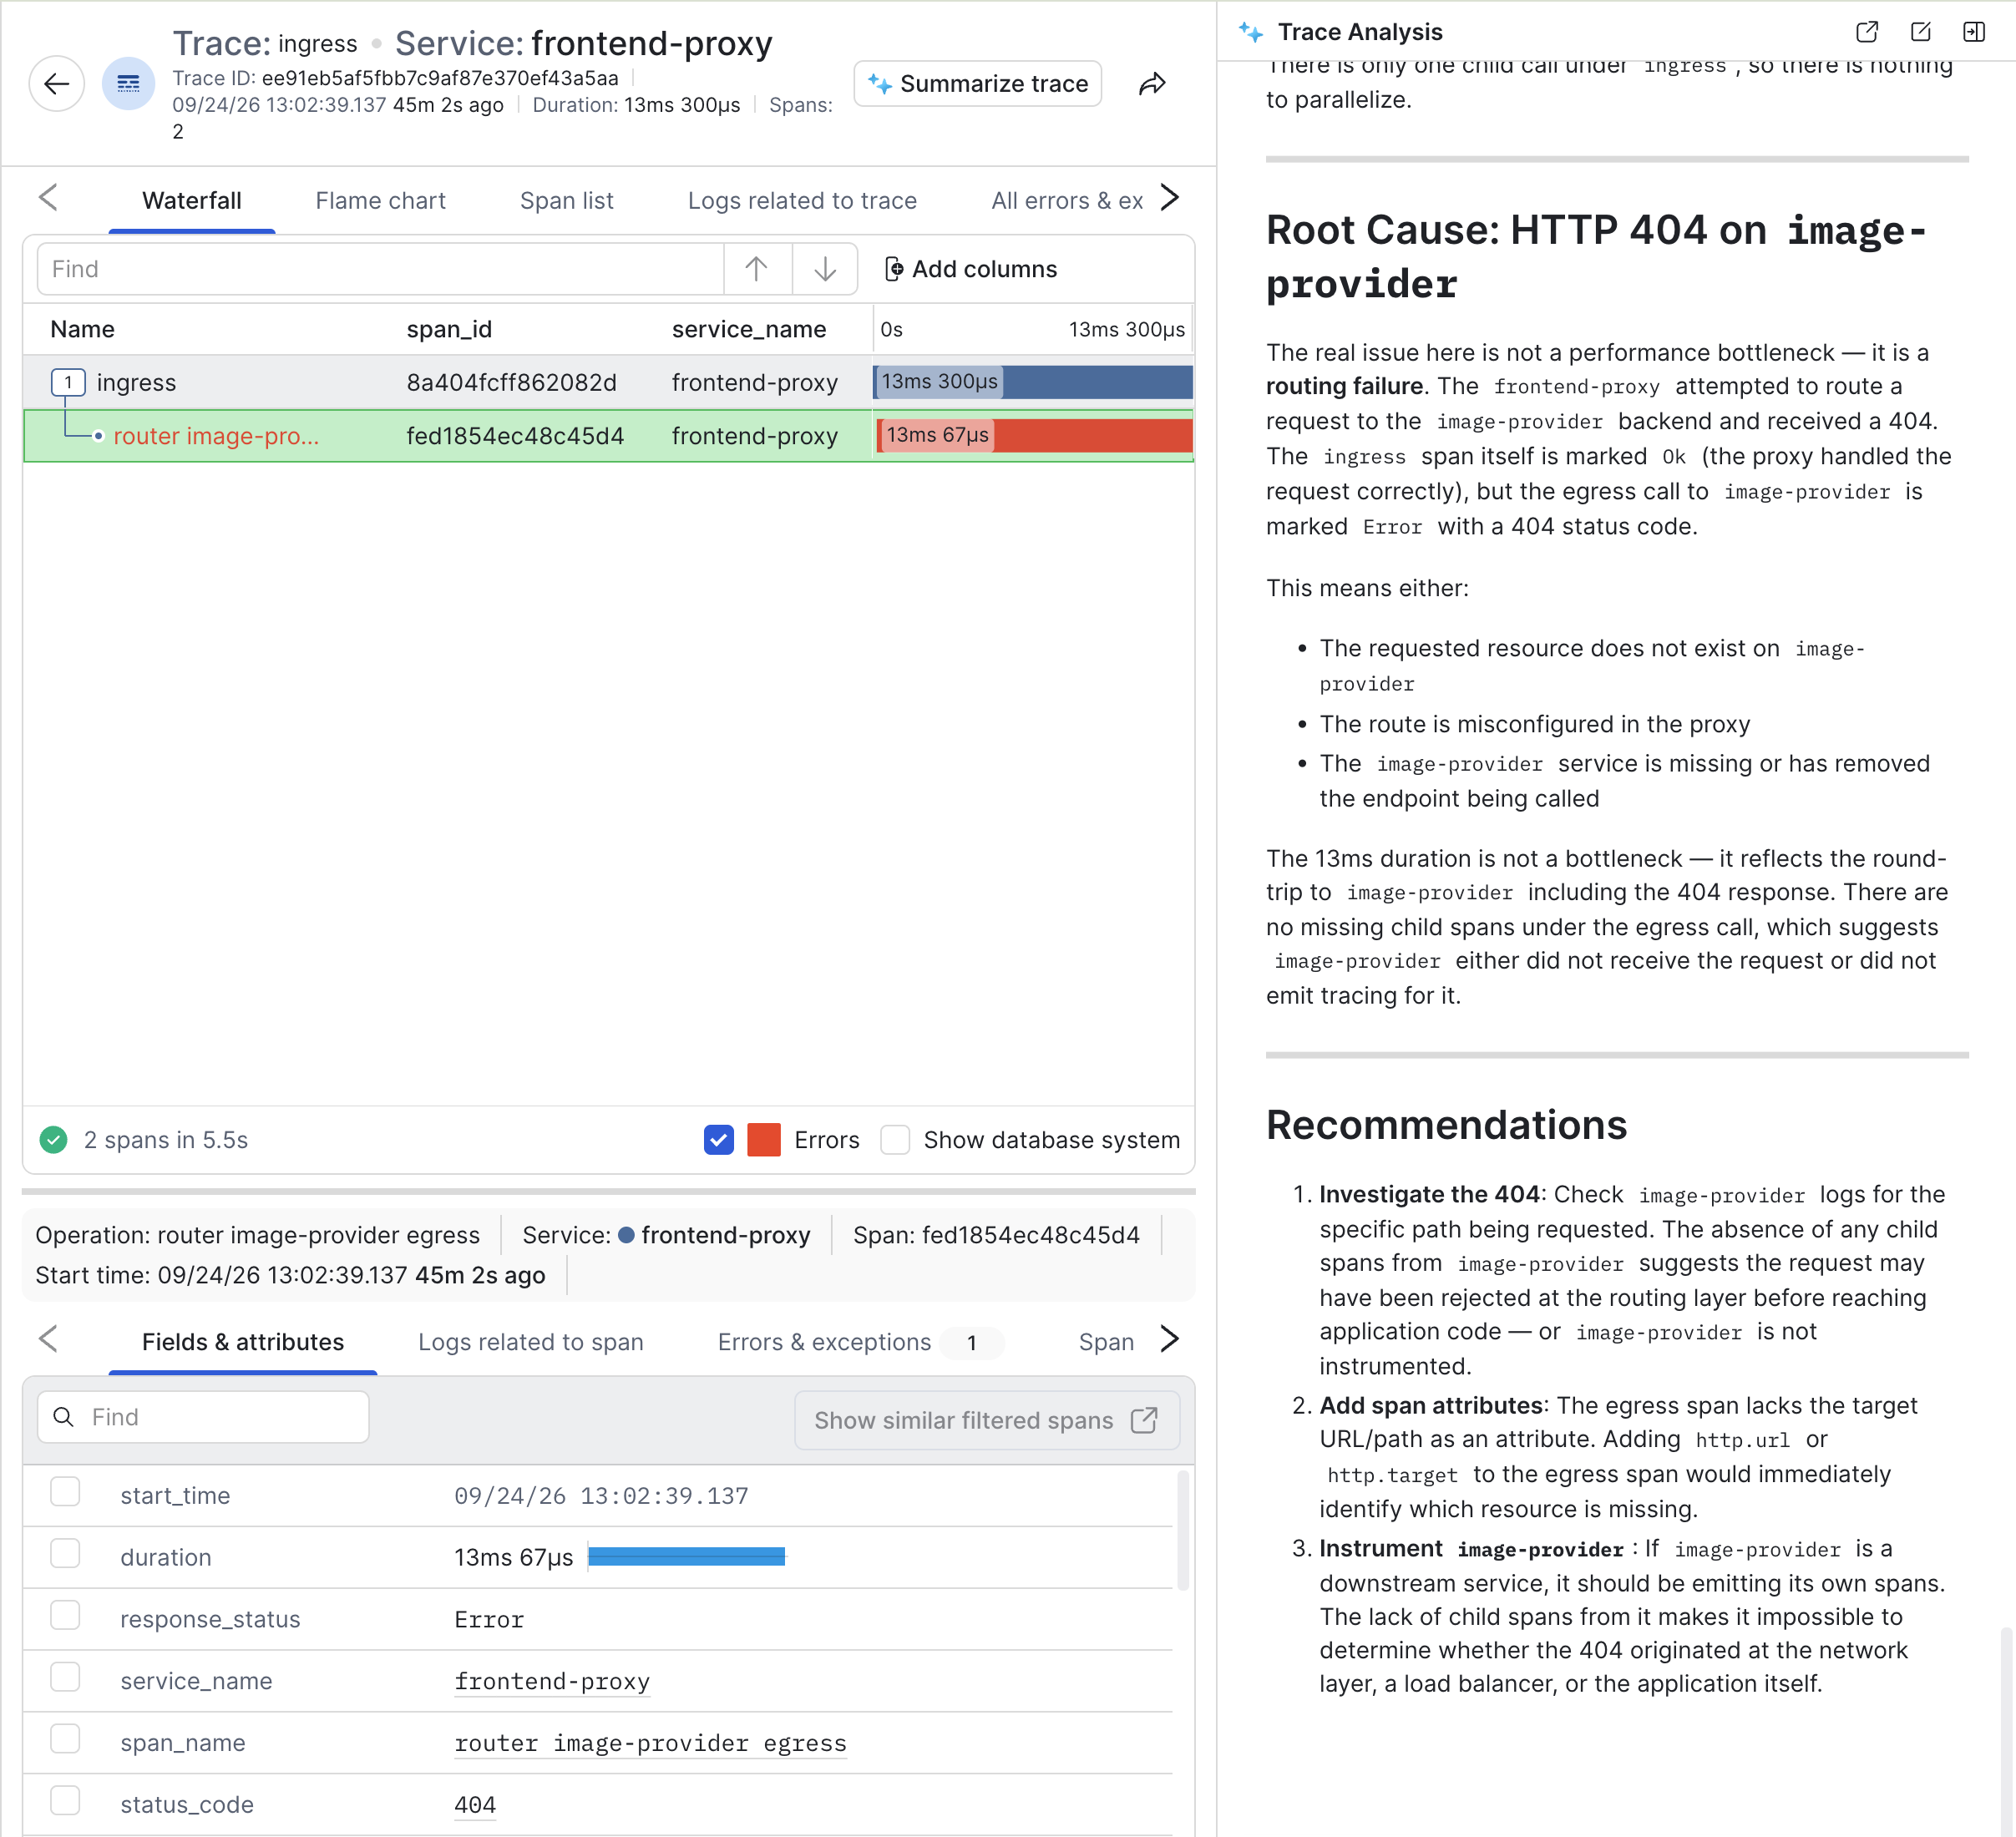
Traces represent the end-to-end lifecycle of a request or transaction. You can view traces in the Trace Inspector, and use the AI assistant in the Trace Inspector to help you analyze issues. For example, here we ask AI to help us investigate 404 errors with the frontend-proxy service:
Write OPAL queries
Use Observe Processing and Analysis Language (OPAL) to explore, filter, shape, and transform your data from logs, metrics, and traces. You can use AI to help you write OPAL queries accurately and quickly to help you find the data you care about.
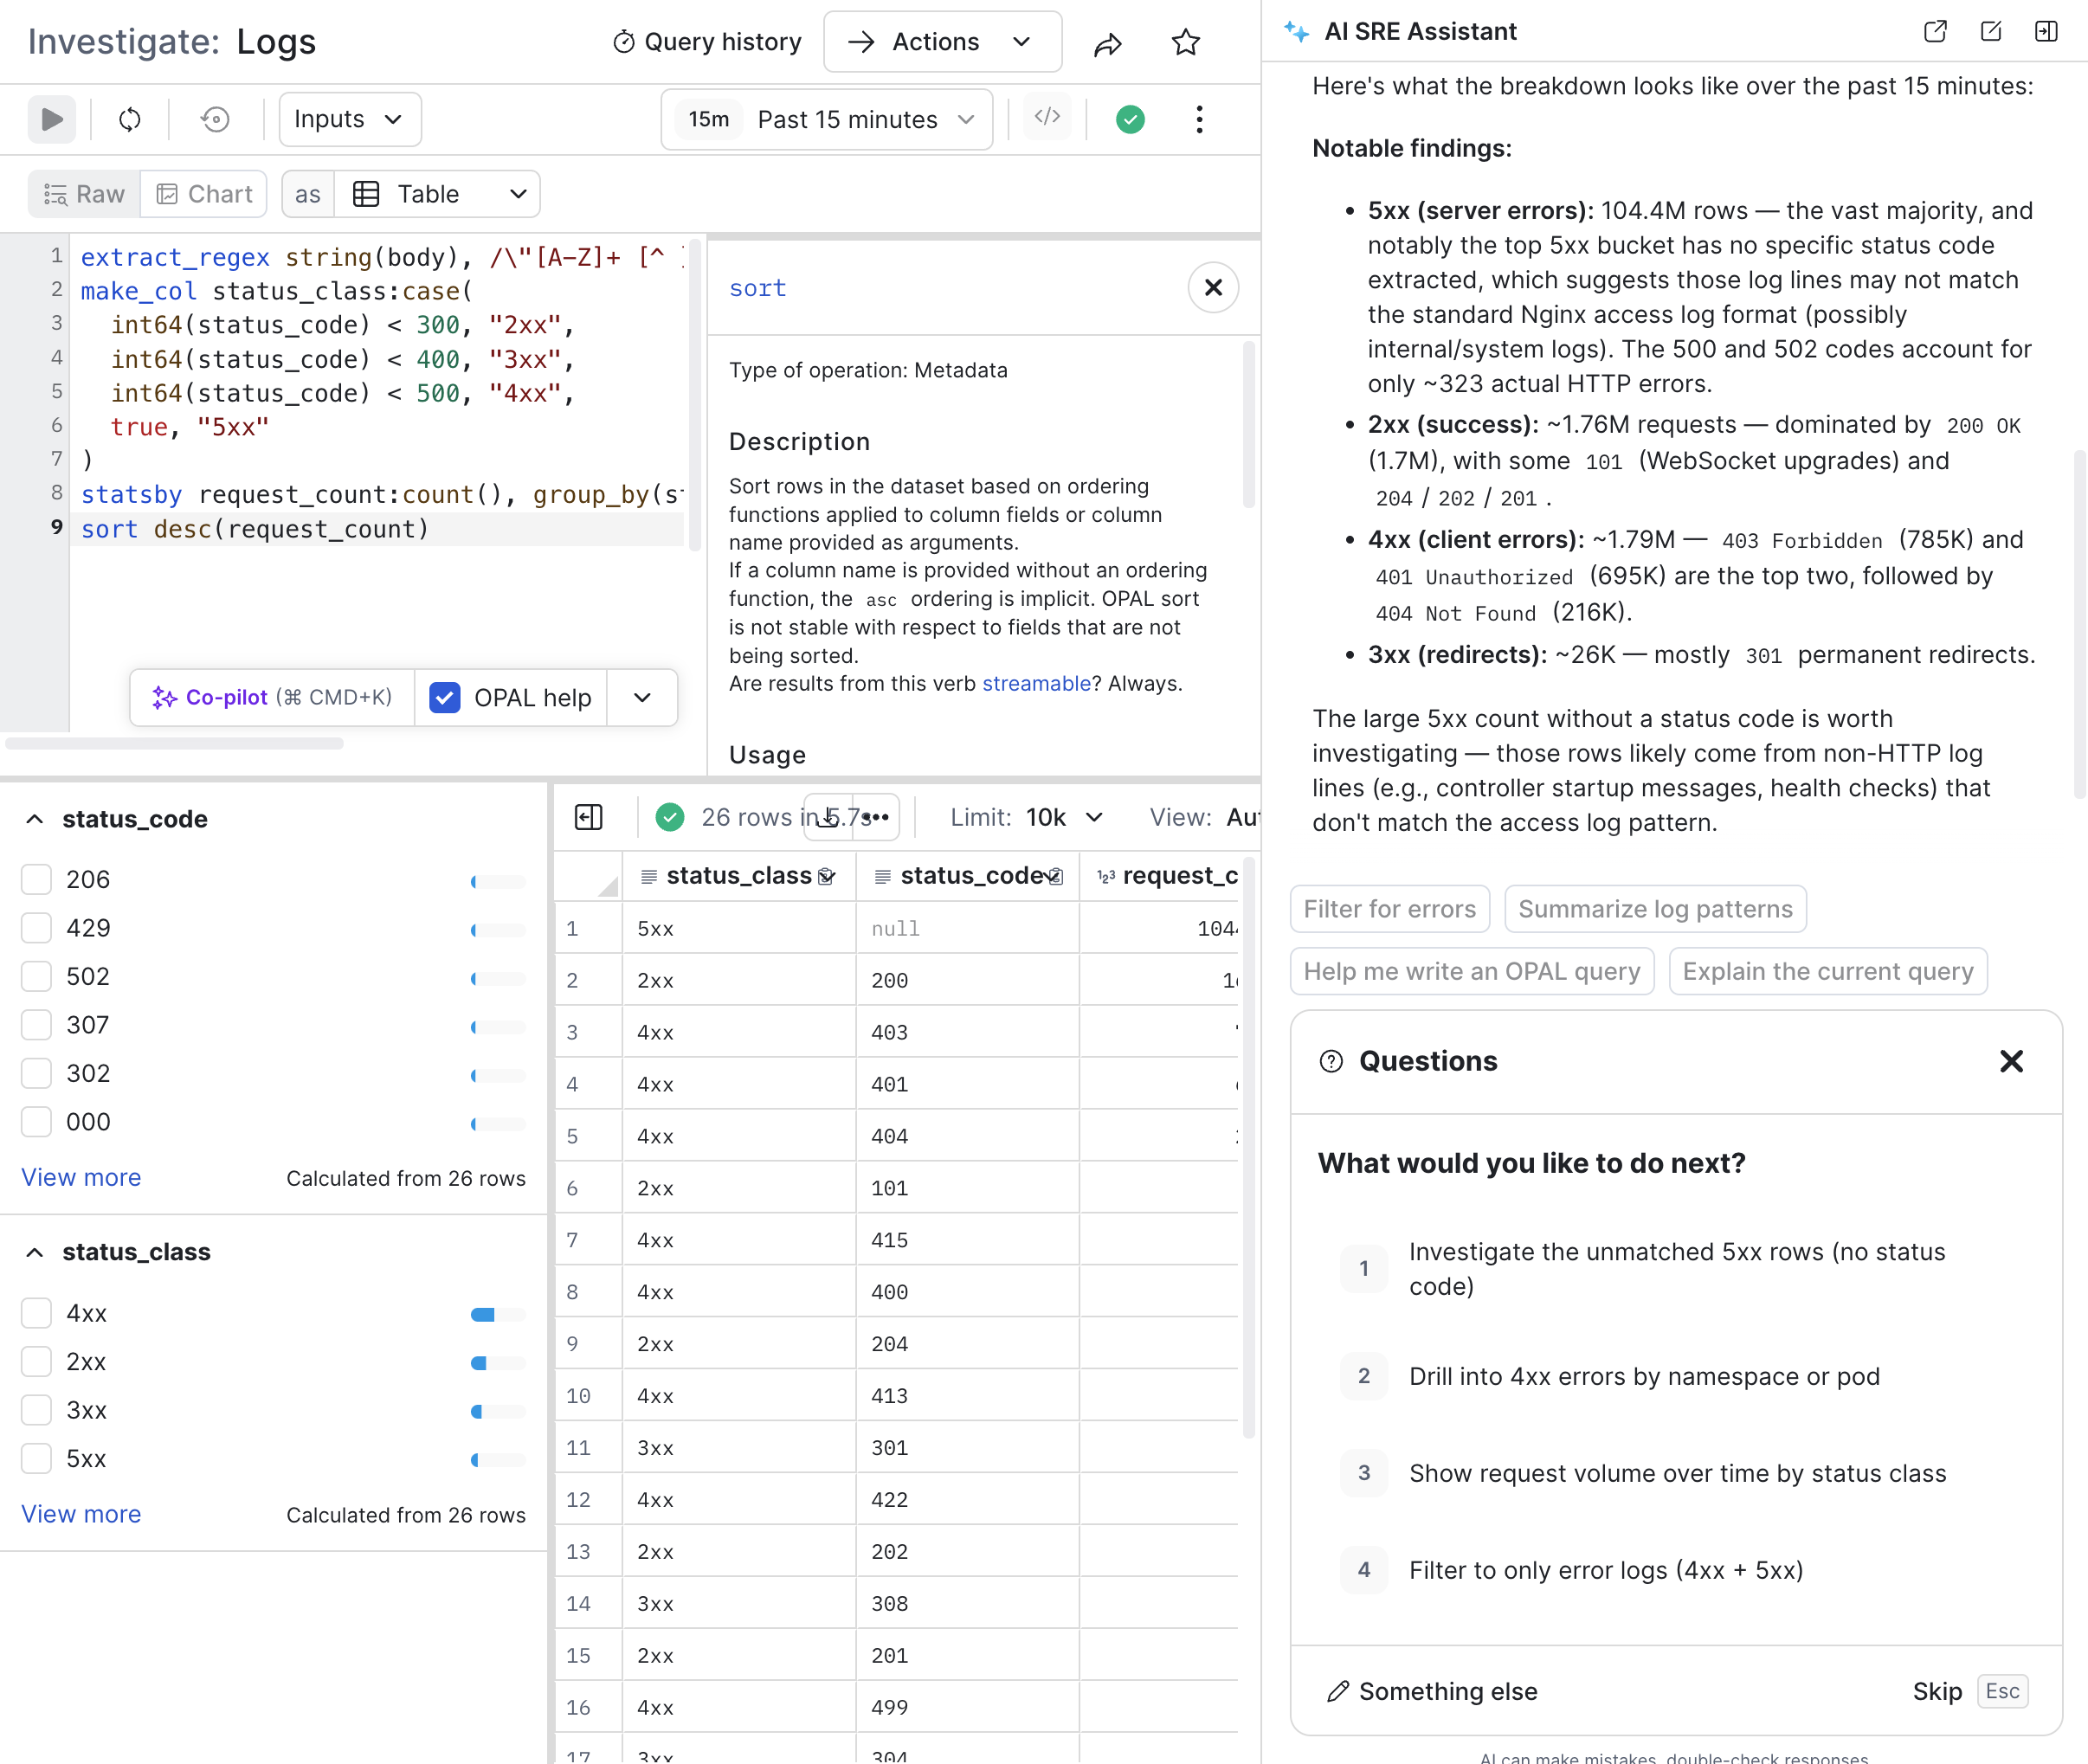
For example, from the Log Explorer, we are looking at Kubernetes logs, and we can ask AI to help write an OPAL query, grouped by HTTP status codes. The AI assistant can produce the query and also provide some insights into the data:
Operate at Enterprise scale
If you spend most of your time in Claude or Cursor, you can troubleshoot issues directly from your coding agent by connecting to the MCP Server. Then, create your automated agentic workflows by bringing in other data and enterprise context as needed.
Updated 13 days ago