View logs associated with a trace
Use correlation tags to pivot between traces and logs, so that you can perform the following tasks:
- View pod logs for the pod on which a span in a trace executed.
- View application logs that correspond to the same user request.
- Use tags as URL query parameters. See URL query parameters.
Observe automatically adds several correlation tags to your span data, which means that for most common use cases, you'll only need to add correlation tags to your log datasets.
Example: correlate between Kubernetes pod logs and traces
Add the following correlation tags to your pod logs dataset (see how to add correlation tags to a Dataset):
k8s.pod.name(required)k8s.cluster.uid(optional)k8s.namespace.name(optional)
Now ensure the Kubernetes spans in your traces have Kubernetes resource attributes. If you're using the Observe Agent, this happens automatically. If not, you may need to Configure your own OTel collector.
Example: correlate between application logs with a trace ID, and traces
Ensure your logs include the trace ID. If you're using the recommended application instrumentation, this will happen automatically. If not, you'll need to manually inject the OpenTelemetry trace ID into your logs.
Add the trace_id correlation tag to your log Dataset (see how to add correlation tags to a Dataset).
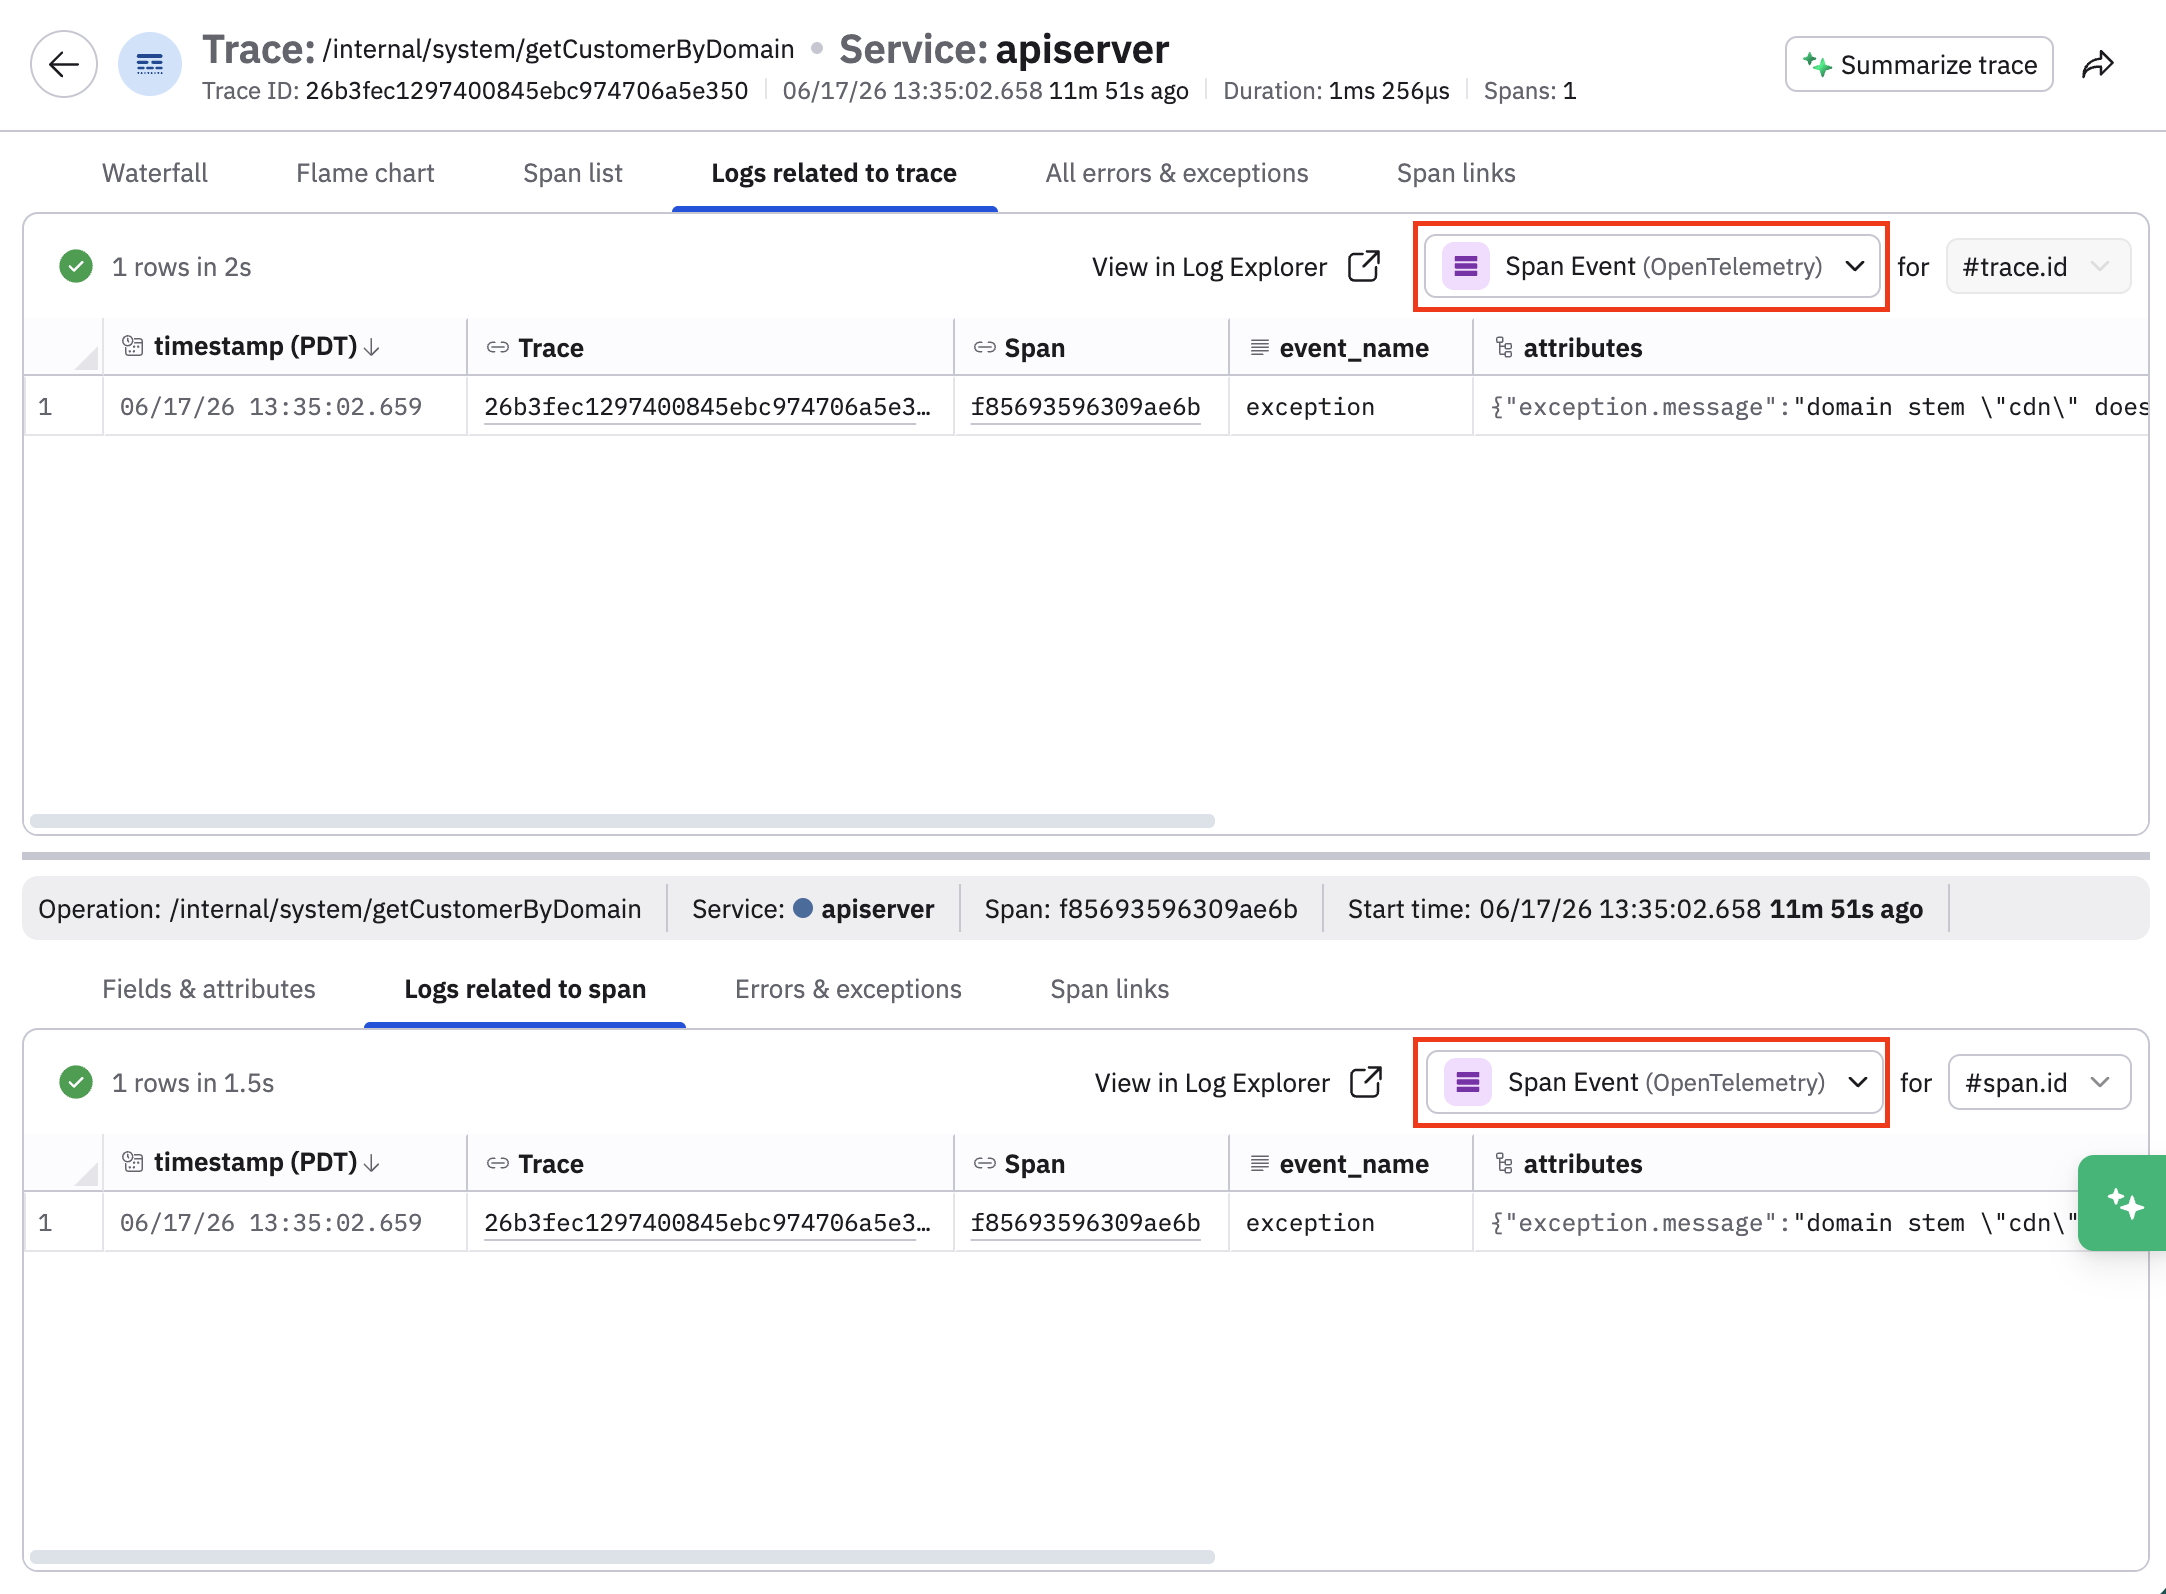
When investigating a trace, in the Logs related to trace and Logs related to span tabs, the default log Dataset is Span Event:
You can use the traceInspectorRelatedLogsDataset layered setting in Terraform to change the default log Dataset if you route logs into a different Dataset. This sets the initial default for newly onboarded users. Afterwards, the most recent Dataset selection persists on a per-user basis.
Below is an example of such a configuration:
# Customer OID — replace with your Observe customer ID
data "observe_oid" "customer" {
  id   = "123403122673"
  type = "customer"
}

# The logs dataset you want as the Trace Inspector default
# (alternatively use the resource if already defined in terraform)
data "observe_dataset" "related_logs" {
  name      = "Logs/explorer-logs" # replace with your dataset name
}

resource "observe_layered_setting_record" "trace_inspector_related_logs_dataset" {
  name         = "Example"
  setting      = "APM.traceInspectorRelatedLogsDataset"
  value_string = data.observe_dataset.related_logs.id
  target       = data.observe_oid.customer.oid
}
See Manage Layered Settings in the Observe Terraform Registry documentation.
Updated 16 days ago