Troubleshoot service endpoints
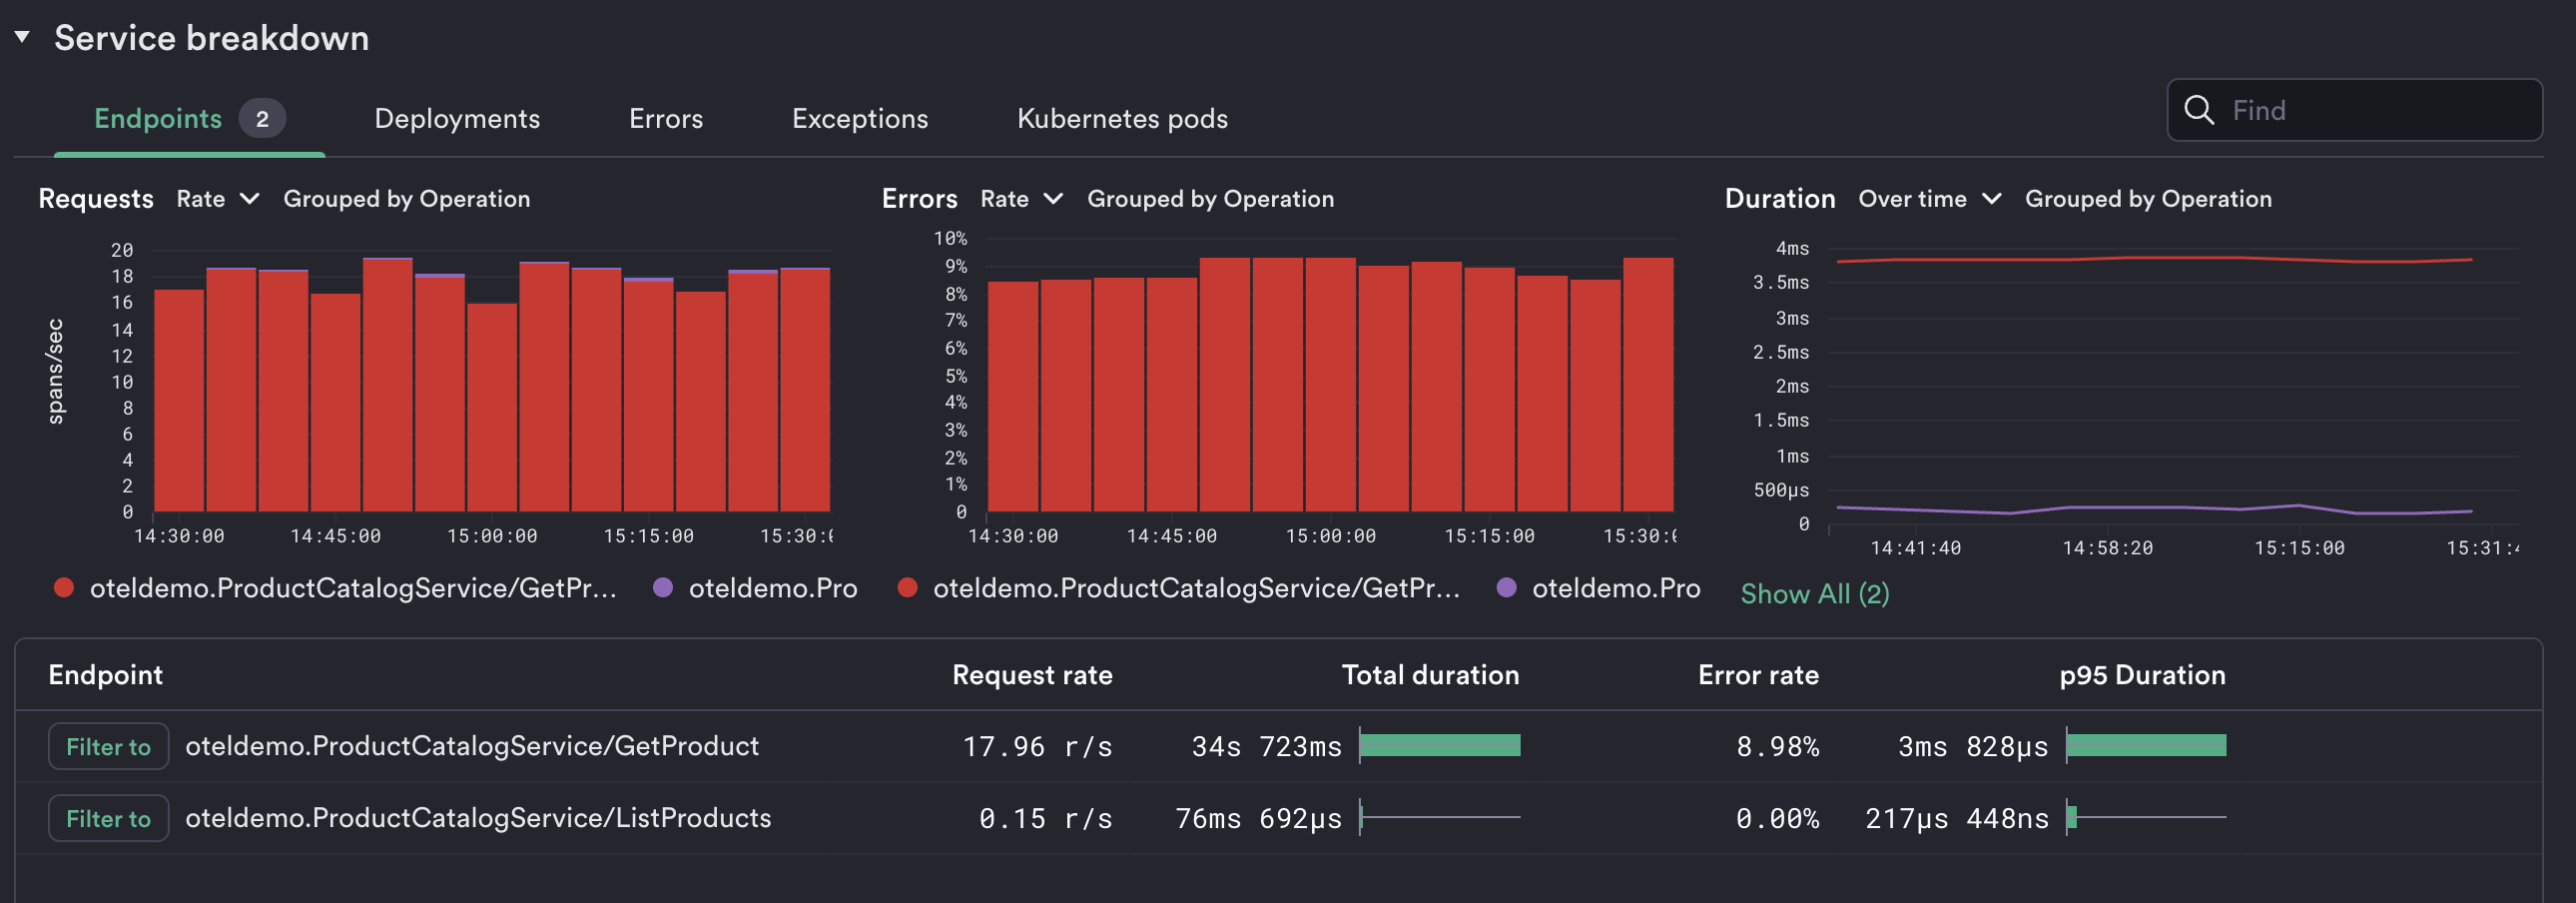
The Service Inspector in Observe APM provides powerful tools to understand and troubleshoot the performance of your service endpoints, whether they involve HTTP, RPC, or message-based protocols. By leveraging detailed telemetry data, you can quickly pinpoint and resolve performance issues, identify bottlenecks, and ensure the reliability of your endpoints.
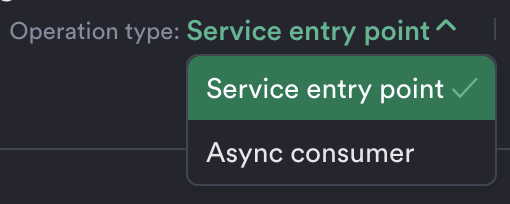
You can sort the list of endpoints for a service by total latency across all requests to quickly identify the most impacting endpoints, or alternatively, select a specific endpoint directly from the dropdown. Once an endpoint is selected, you can inspect its RED (Rate, Error, Duration) metrics, view errors and exceptions, correlate performance with recent deploys, drill down into traces, and analyze its behavior in detail. The Service Inspector also allows you to toggle between synchronous (HTTP/RPC) and asynchronous (message-based) endpoints.

Terminology
The “Endpoint” terminology in Observe has equivalents in other APM products:
Observe |
Datadog |
New Relic |
AppDynamics / Dynatrace |
|---|---|---|---|
Endpoint |
Resource |
Transaction |
Business Transaction |
Toggling between HTTP/RPC endpoints and message-based endpoints in Observe also has equivalents in other APM products:
Observe |
Datadog |
New Relic |
|---|---|---|
Endpoint dropdown |
Operation dropdown |
Web/non-web transaction dropdown |
Underlying OpenTelemetry data used to detect endpoints
Spans of type
SERVERare used to detect HTTP/RPC endpoints. The endpoint name in Observe is the span name.Spans of type
CONSUMERare used to detect message-based endpoints. The endpoint name in Observe is the span name.

