Tutorial: send app data to Observe
Overview
Starting from a very simple Node.js app, we will:
Generate OpenTelemetry data from the app with zero code changes.
Send the data to Observe using the Observe host agent.
Search for traces using the Trace Explorer and inspect the service using the Service Explorer.
Add a deployment marker and environment tag to the service.
Clean up the list of endpoints to make it more useful for service monitoring.
You will need:
A Linux host that the Observe agent supports
Example app
Once you have Node.js on your Linux host, run the following commands in a new directory to set up a new Node.js app and add Express (a simple Node.js web framework) dependencies to it:
npm init -y
npm install express
Now create an app.js in this directory with the following code:
const express = require('express');

const PORT = parseInt(process.env.PORT || '3000');
const app = express();

function getRandomNumber(min, max) {
  return Math.floor(Math.random() * (max - min) + min);
}

app.get('/rolldice', (req, res) => {
  res.send(getRandomNumber(1, 6).toString());
});

app.listen(PORT, () => {
  console.log(`Listening for requests on http://localhost:${PORT}`);
});
Run the app:
node app.js
Visit http://localhost:3000/rolldice in your browser to ensure it’s working.
OpenTelemetry zero-code instrumentation
Run the following:
npm install --save @opentelemetry/api
npm install --save @opentelemetry/auto-instrumentations-node
NODE_OPTIONS="--require @opentelemetry/auto-instrumentations-node/register"
Your app is now instrumented with OpenTelemetry! This step is equivalent to installing an application agent in a traditional APM solution. The last line tells the Node.js runtime to preload the OpenTelemetry instrumentation when you run the app.
Give your app a service name by setting the OTEL_SERVICE_NAME environment variable:
OTEL_SERVICE_NAME="dice-roller"
Observe OpenTelemetry app
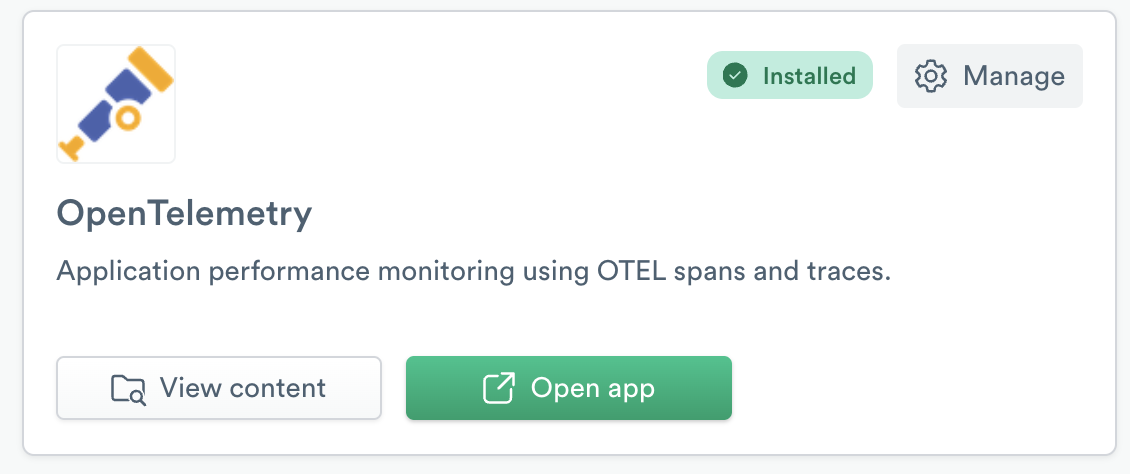
Now we’ll go into Observe’s UI and install the OpenTelemetry app:

Make sure to install version 2.0 or greater, which includes the content that powers the Service Explorer. Use the recommended install settings:

Now we’ll create a token, which the Observe agent in your host will use to authenticate with Observe when sending in data:
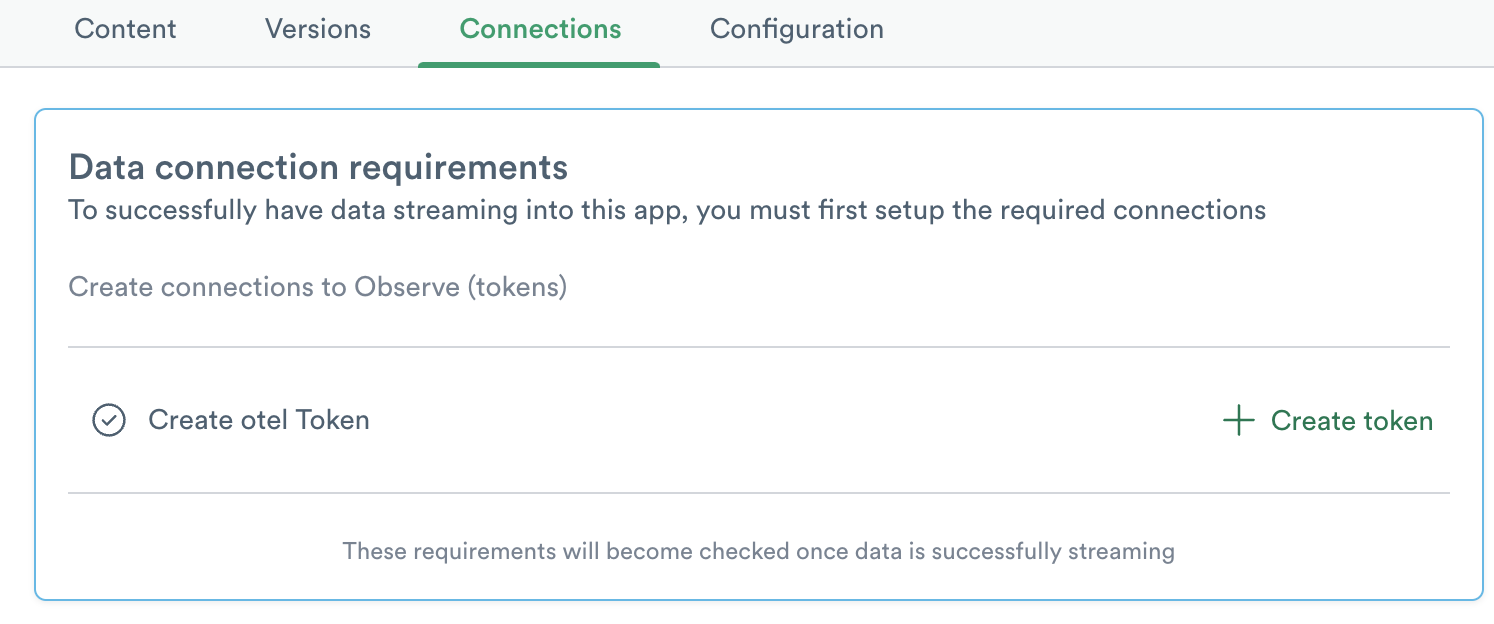
Choose any name for your token and be sure to save it somewhere!
Observe Agent
Install the observe-agent package in your host:
echo 'deb [trusted=yes] https://repo.observeinc.com/apt/ /' | sudo tee /etc/apt/sources.list.d/observeinc.list
sudo apt update
sudo apt install observe-agent
Configure and run the agent:
sudo observe-agent init-config --token <your token> --observe_url https://<your tenant id>.collect.observeinc.com/
sudo systemctl enable --now observe-agent
Now run your app again:
node app.js
The default settings in the OTel instrumentation in your app for exporting data match up with the default settings in the Observe agent for receiving OTel data and forwarding it to Observe.
Generate some load on the /rolldice endpoint. Your app is now sending data to Observe!
Viewing app data in Observe
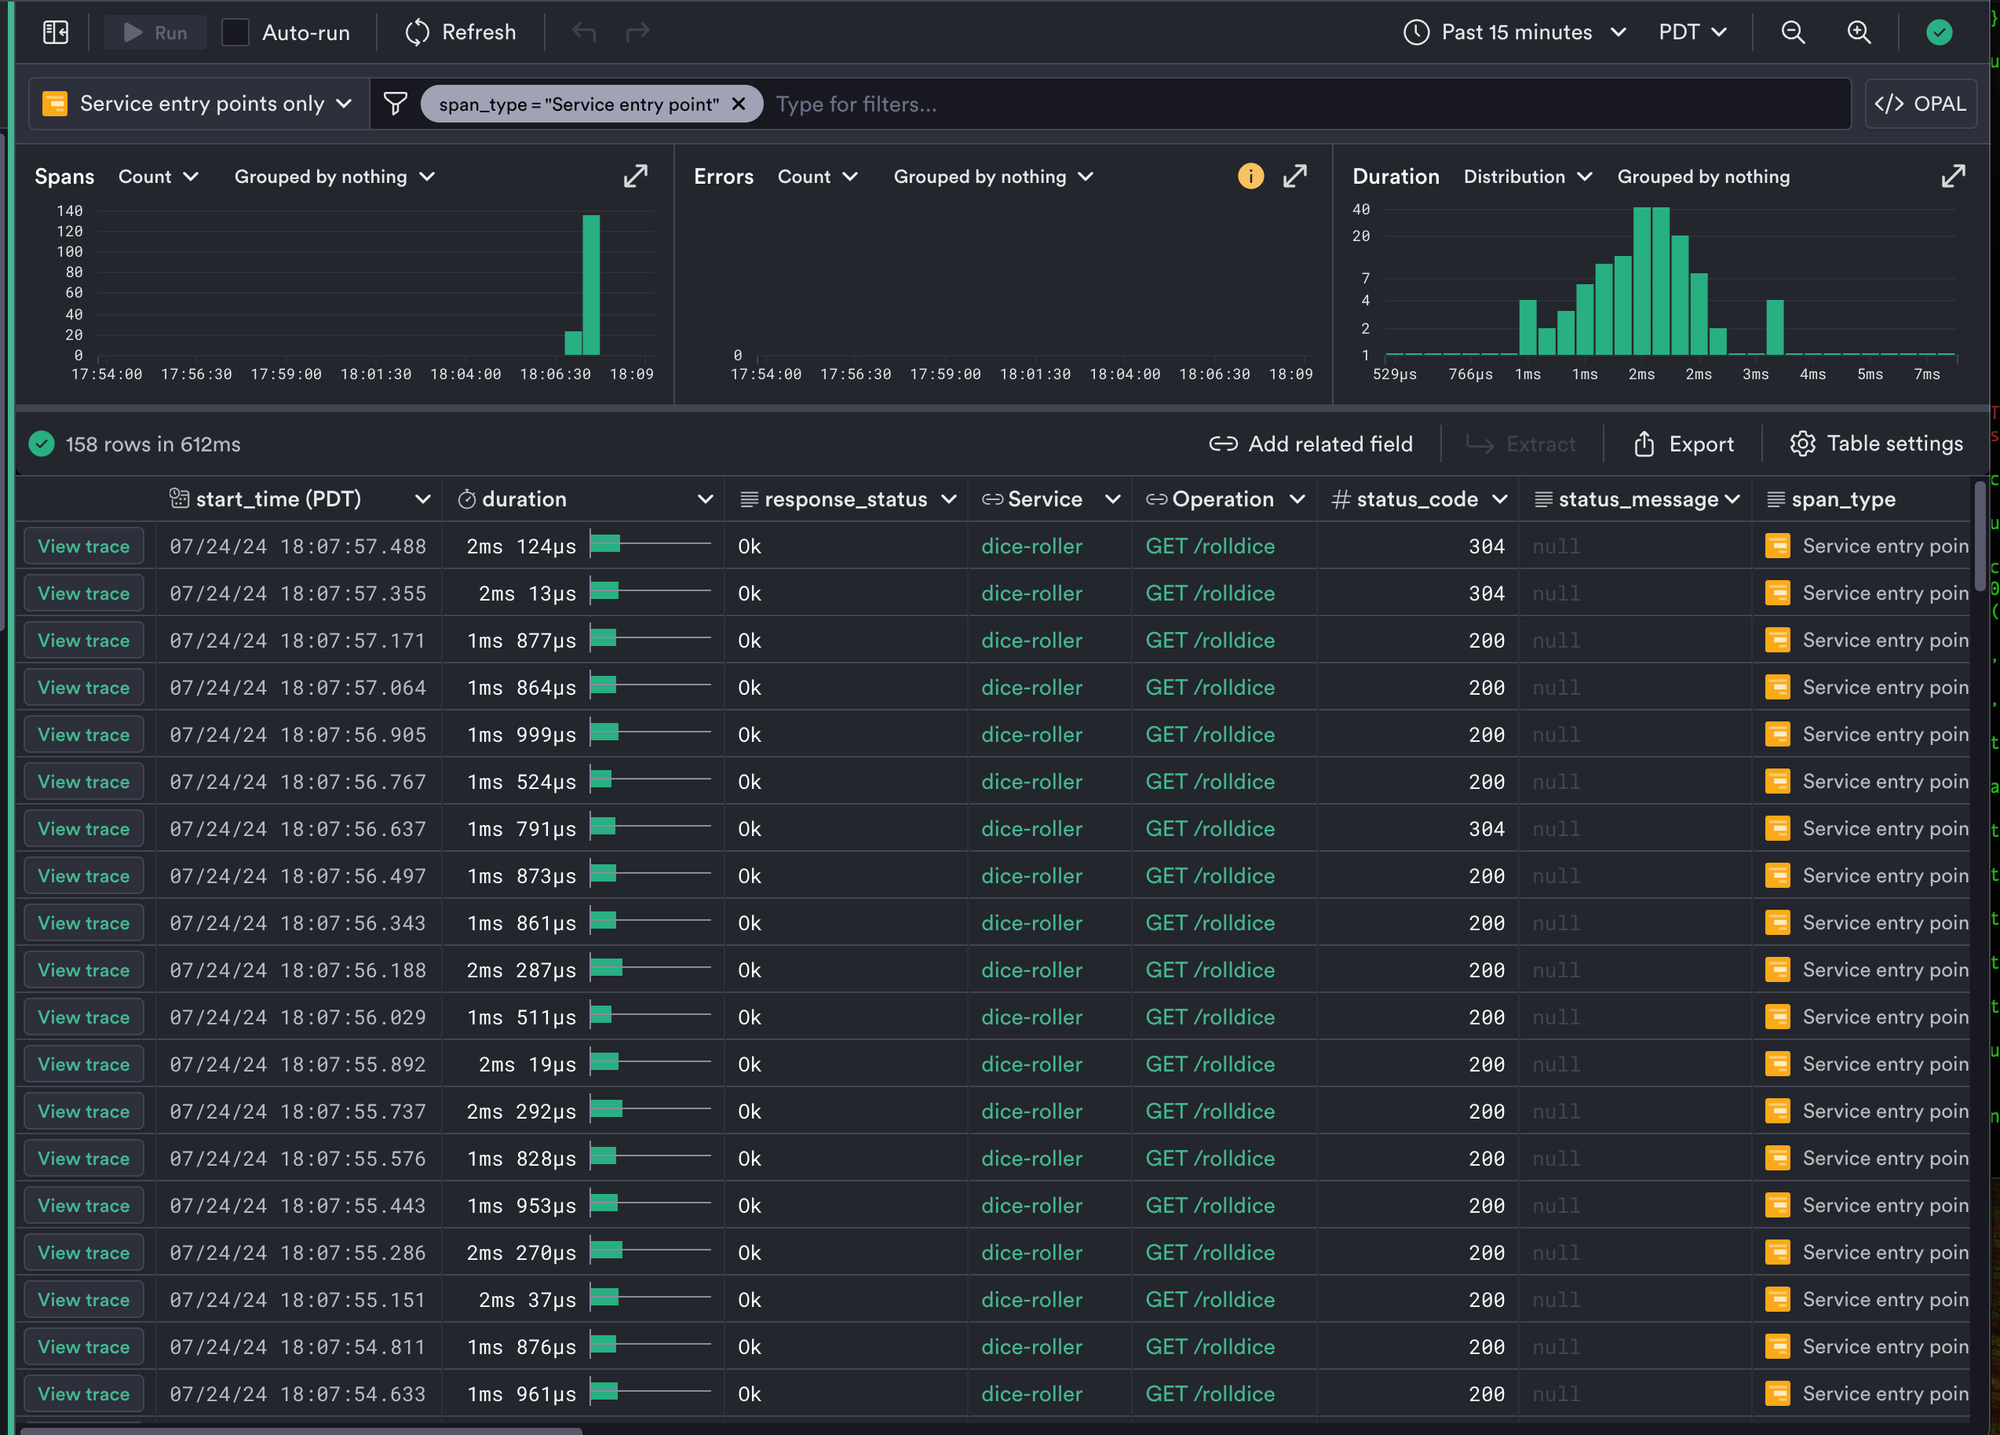
Traces from the app should appear in the Trace Explorer:
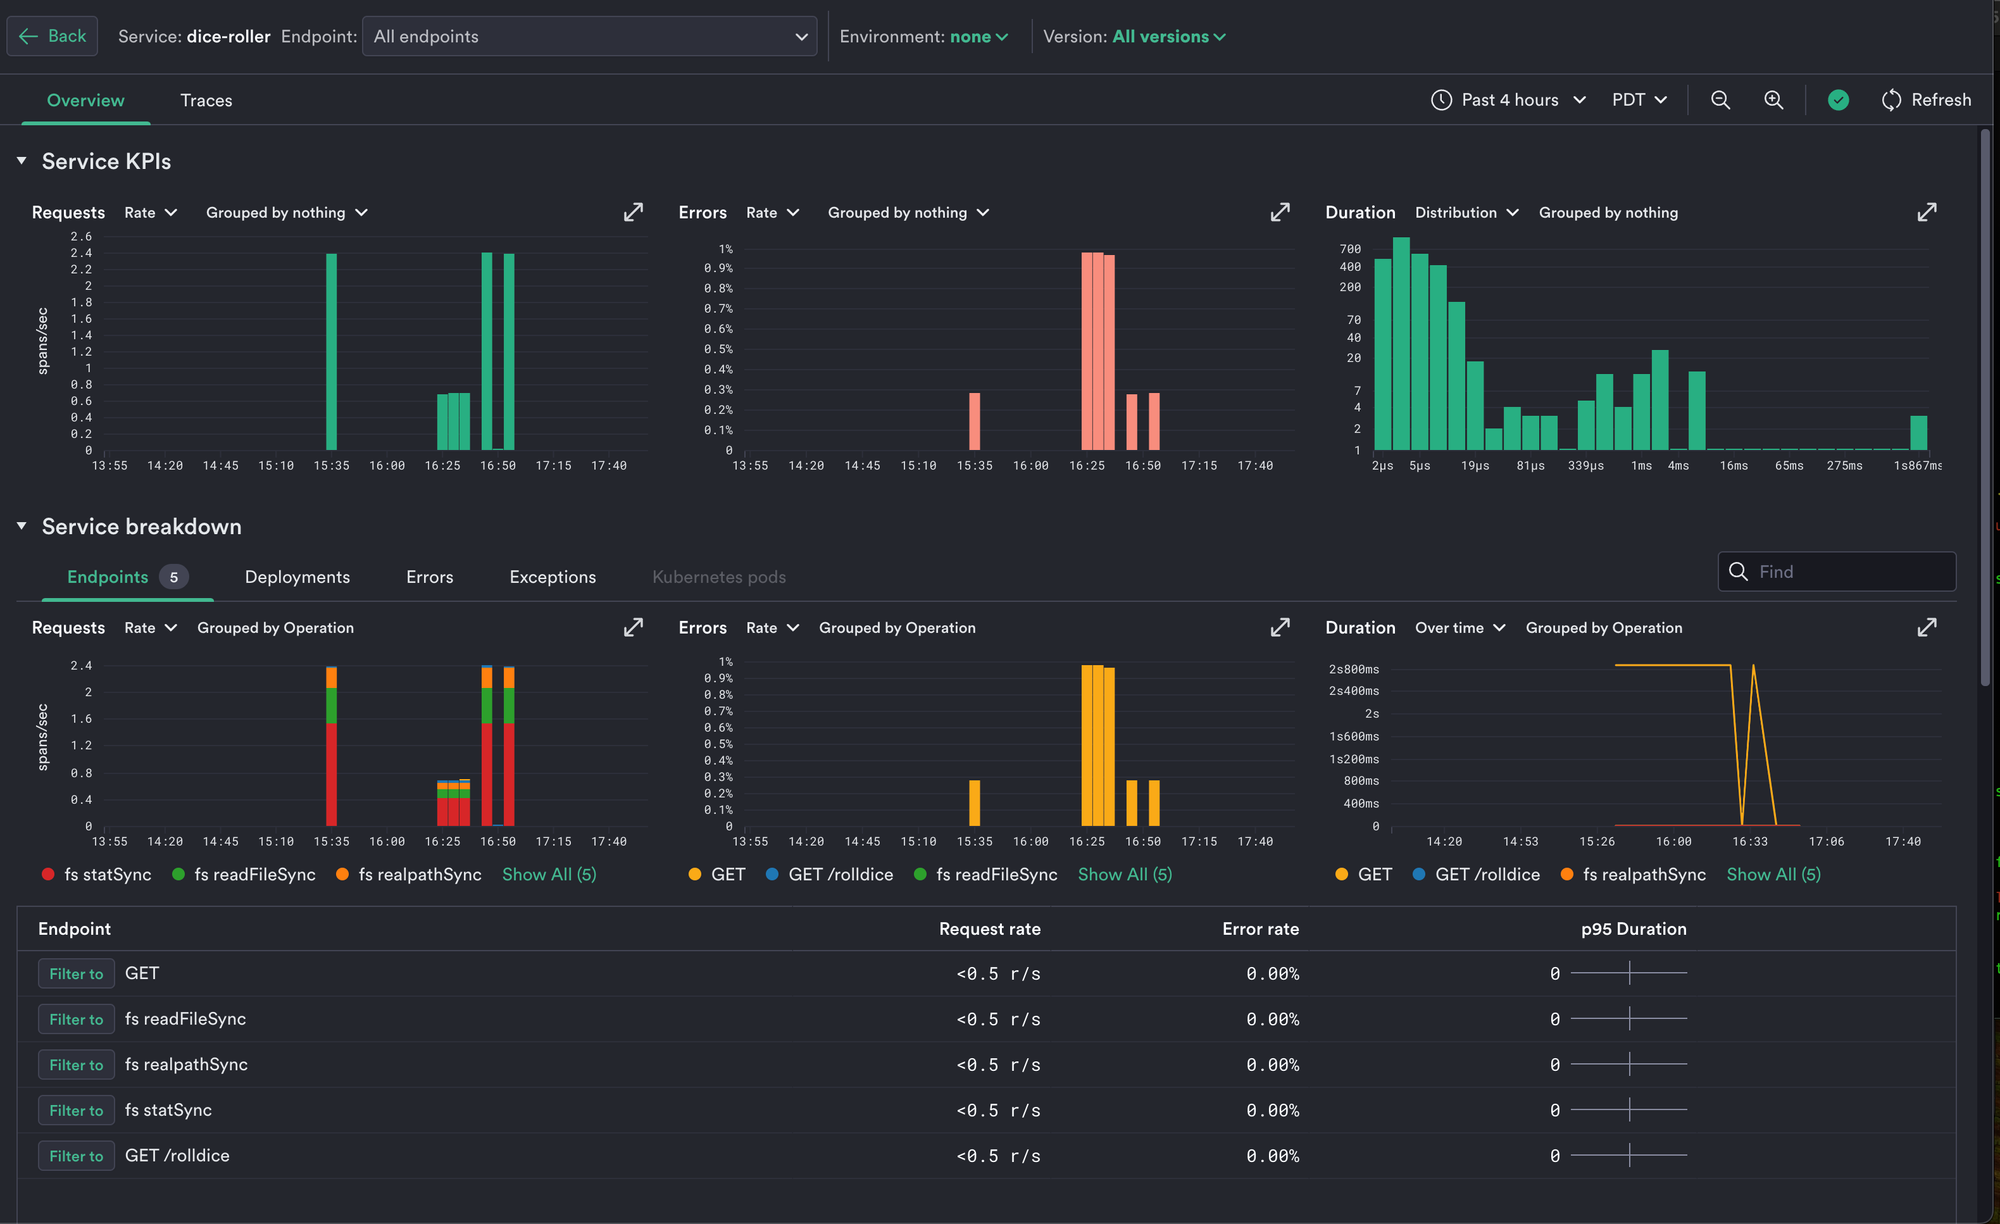
The dice-roller service should appear in the Service Explorer:

Add a deployment marker and environment attribute
When you’re inspecting a service or endpoint in Service Explorer, you can view deployment markers on RED metric charts to correlate spikes in latency or errors to a new deploy. Service Explorer generates deployment markers from the service.version resource attributes in your span data – the first time a new value of service.version is seen in your span data, a deployment marker is automatically created.
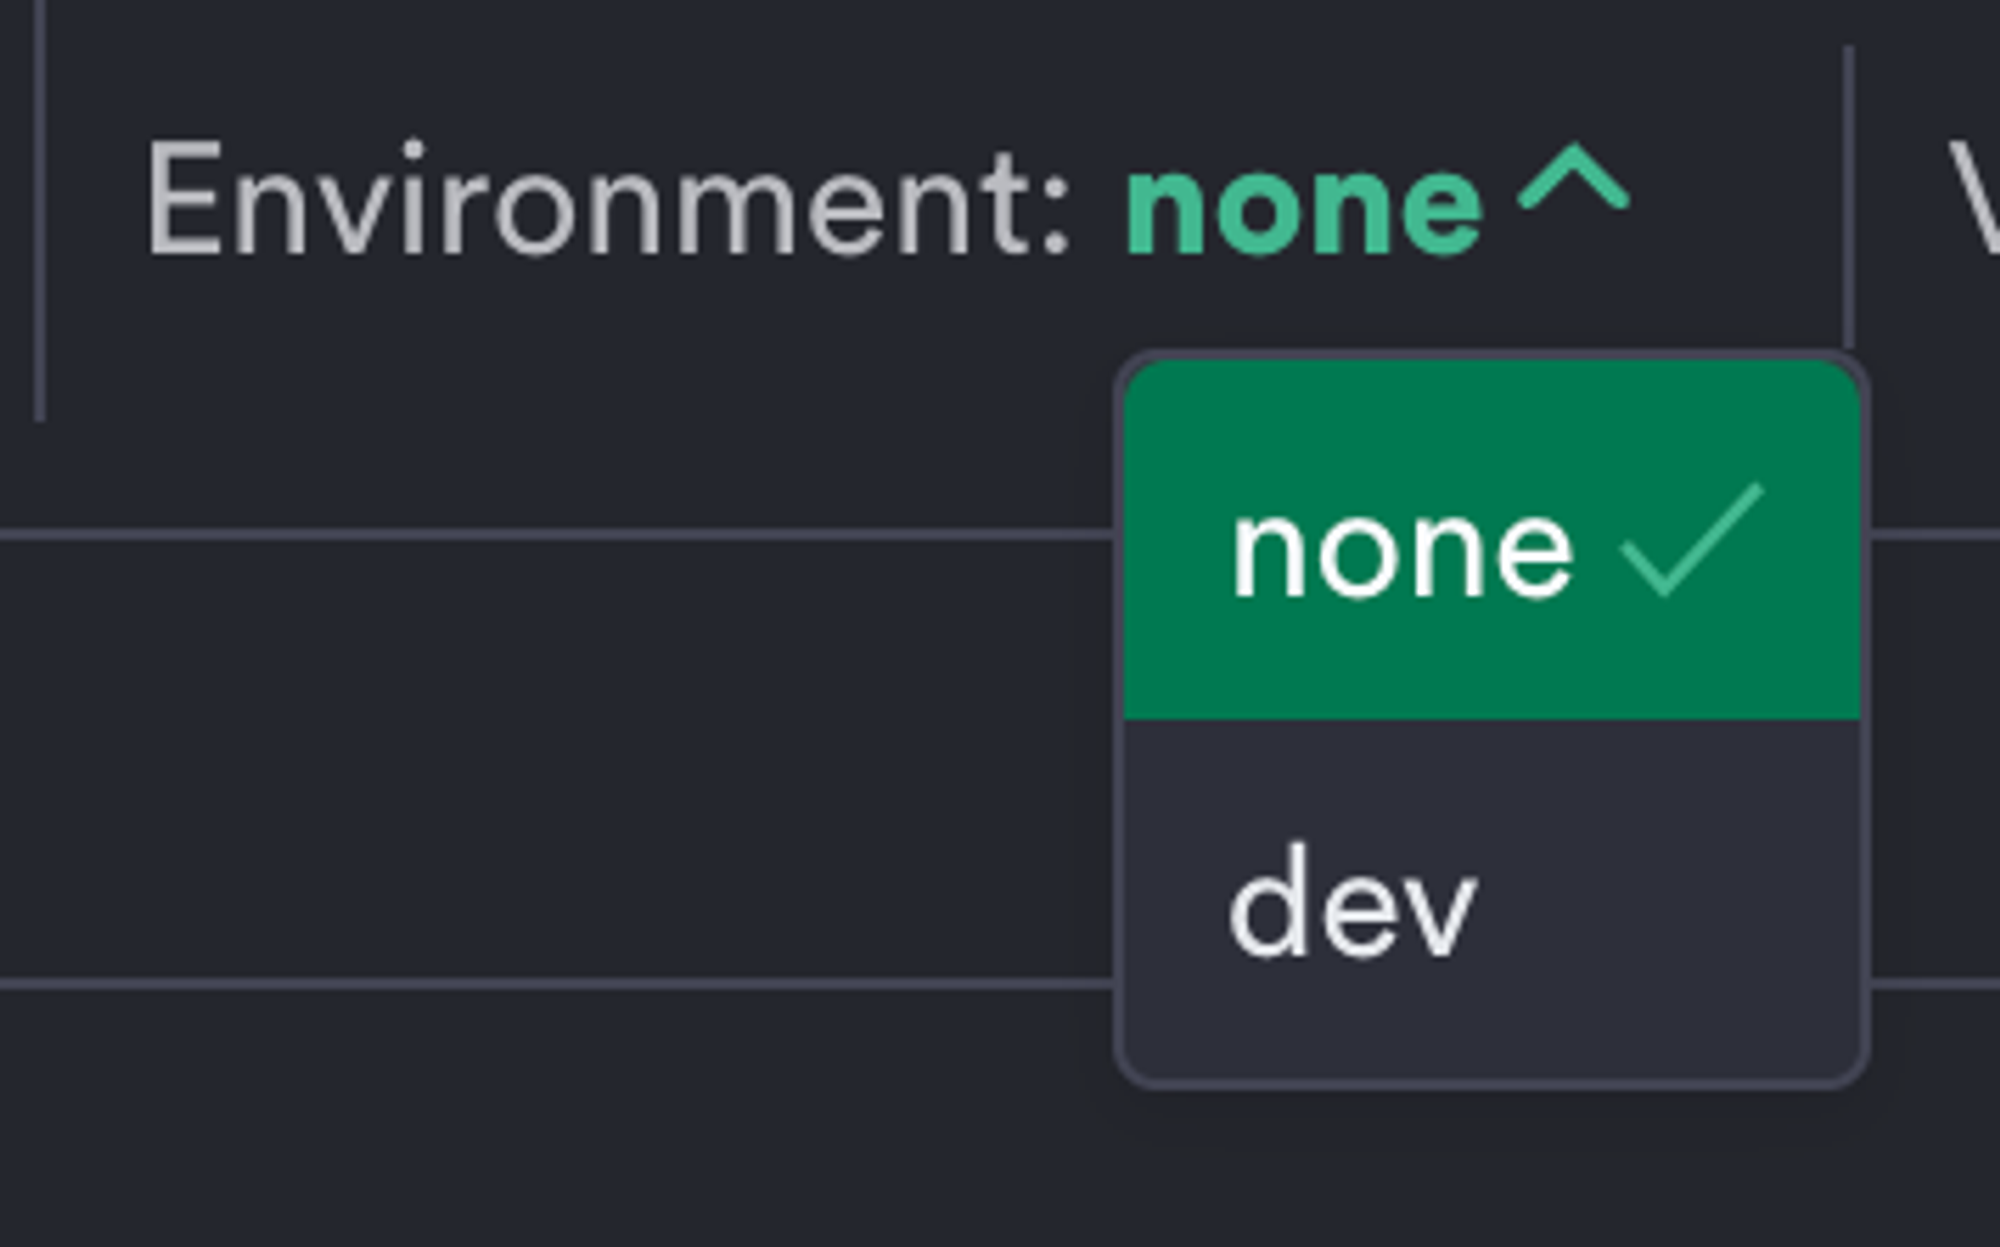
Service Explorer also breaks down service health by environment, using the deployment.environment resource attribute in your span data.
Add both by setting the following environment variable:
OTEL_RESOURCE_ATTRIBUTES="deployment.environment=dev,service.version=1.01"
Re-run your app and open the Service Explorer:

Clean up the list of endpoints
Let’s look at our list of endpoints:

In Node.js, statSync, readFileSync, and realpathSync are internal filesystem operations. You might decide that these are not endpoints that you care about from a monitoring perspective as an owner of this service, and want to remove them from the list of endpoints.
You can suppress these endpoints in the Observe agent. Open /etc/observe-agent/otel-collector.yaml and add the following in the processors section:
processors:
...
  filter/node_fs_root_spans:
    error_mode: ignore
    traces:
      span:
        - 'resource.attributes["service.name"] == "dice-roller" and (name == "fs statSync" or name == "fs readFileSync" or name == "fs realpathSync") and IsRootSpan()'
Now update the processors line in the traces/forward pipeline in the service section with the following:
service:
  pipelines:
    traces/forward:
      ...
      processors: [filter/node_fs_root_spans, resourcedetection, resourcedetection/cloud]
This tells the agent to ignore these spans when they begin a trace, which will remove them from the endpoint list.
Restart the agent using sudo systemctl restart observe-agent and generate some more load on the app. Inspecting this service in the Service Explorer will now show:

Great! But we still have an endpoint named GET which is not very useful. Can we enrich this endpoint name to be more informative? When we look at these traces in the Trace Explorer, we see they have an http.target attribute, which seems useful to include in the endpoint name:

We can enrich the endpoint name with this metadata via the Observe agent. Again, open /etc/observe-agent/otel-collector.yaml and add the following in the processors section:
processors:
...
  span/enrich_method_only_span_names:
    include:
      match_type: strict
      services: ["dice-roller"]
      span_names: ["GET", "POST", "PUT", "DELETE", "PATCH"]
    name:
      from_attributes: ["http.method", "http.target"]
      separator: " "
Now update the processors line in the traces/forward pipeline in the service section with the following:
service:
  pipelines:
    traces/forward:
      ...
      processors: [span/enrich_method_only_span_names, filter/node_fs_root_spans, resourcedetection, resourcedetection/cloud]
This tells the agent to enrich the name of any root span (i.e., first span in a trace) whose name solely consists of an HTTP method with the value of http.target for the span.
Restart the agent using sudo systemctl restart observe-agent and generate some more load on the app. Inspecting this service in the Service Explorer will now show:

(Note that this endpoint is not generated by the sample app itself; it’s generated by the instrumentation itself and will be suppressed in a future version of the instrumentation, but it provided a great illustration of a common situation.)