Create an anomaly monitor
NoteThis is a private preview feature. Contact your Observe representative for more information or open Help > Contact support in the product and let us know.
Anomaly monitors automatically learn what “normal” looks like for a metric over time and alert you when recent behavior deviates from that baseline in a sustained way.
They’re best for signals that have evolving behavior, such as slow trends or evolutions, where static thresholds are either too noisy or must be constantly adapted. Consider the following uses cases where anomaly monitors are effective:
- Traffic patterns, such as RPS or throughput.
- Error rates or failure ratios.
- Latency or resource utilization.
In each of these use cases, you can further group by team‑owned units, such as service or cluster, or environments, such as production or staging.
Avoid using anomaly monitors for raw IDs or anything that creates thousands of tiny groups; you’ll get sparse data, poor baselines, and high cost.
One use case for anomaly monitors is monitoring the number of concurrent database connections. There is no straightforward static numeric threshold to set, as this number could vary over time or steadily increase while the services scale up. In this case, an anomaly monitor could help identifying an unusually high (or low) amount of connections, given the recent past.
How the Observe platform looks for anomalies
The Observe platform looks for anomalies based on the following criteria:
Criteria | Description |
|---|---|
Value column | The numeric time series you’re monitoring, such as requests_per_second, error_rate, or p95_latency. |
Groups | Optional dimensions you group by, such as service_name or region. The algorithm runs independently per group, meaning that data points are flagged as anomalous within the group and values across groups are uncorrelated. |
Evaluation window | The window of time you care about for alerting, such as the last 15 minutes. |
Time resolution | The granularity of the time series, such as one value every 1 minute or every 5 minutes. This granularity is bound. The minimum and maximum values are chosen based on the width of the evaluation window. |
Computation window | This is the training history:
|
Dynamic bounds | Upper and lower bounds are computed as follows:
Any point that crosses the chosen upper or lower bound is treated as an anomalous point. |
Create an anomaly monitor from the monitors list
Perform the following steps to create an anomaly monitor:
- In the left navigation rail, select Monitoring.
- Click New Monitor.
- Select Anomaly.
Create the monitor query
Select a metric and define the monitor query. You can use the expression builder, filters, and key grouping to isolate a time-series.
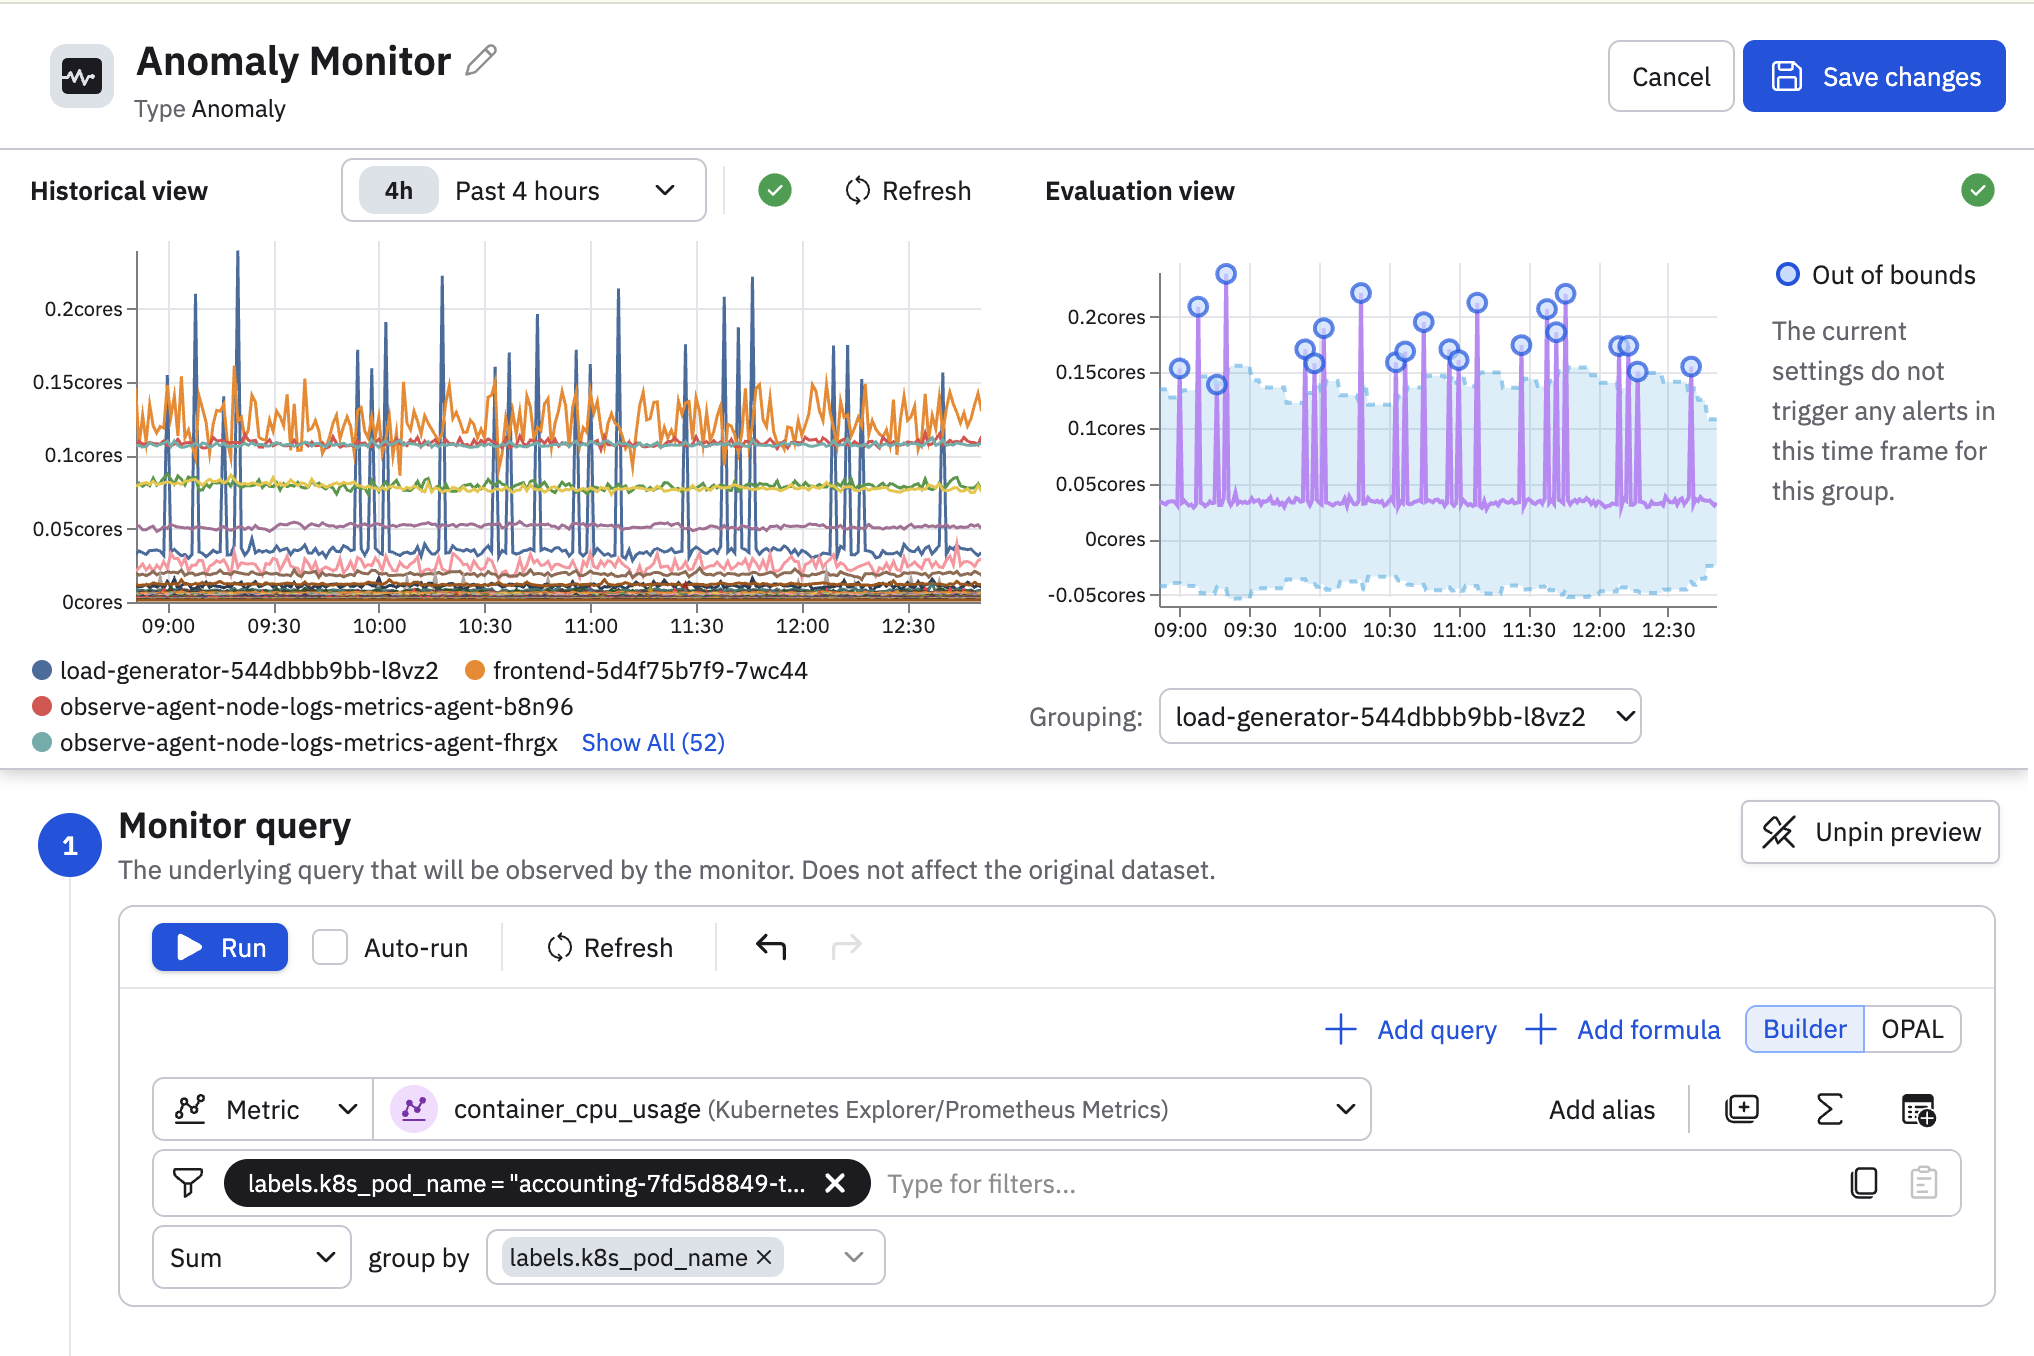
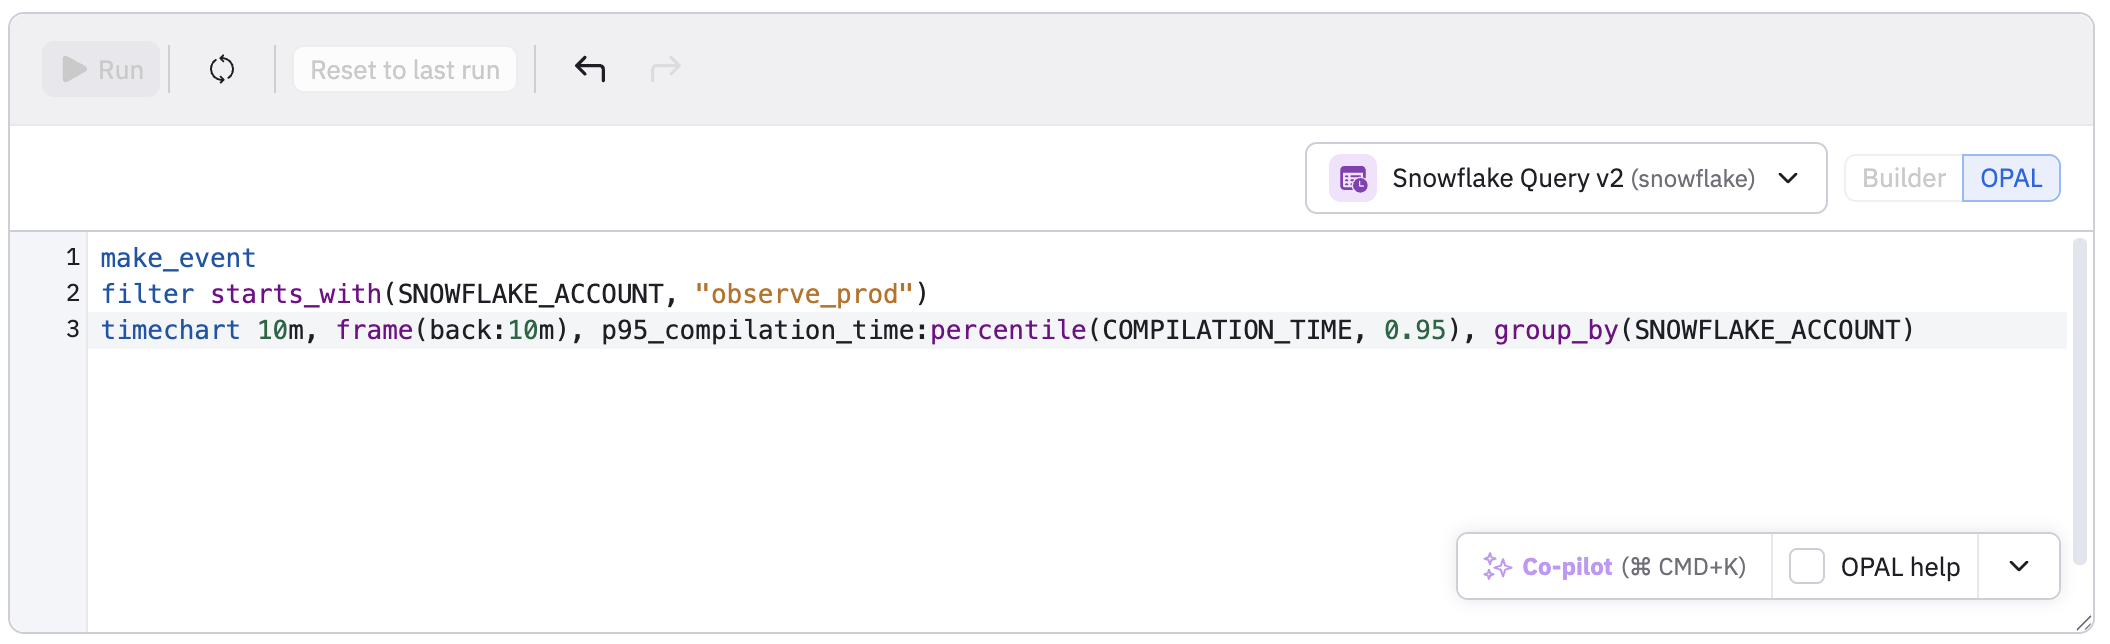
You can also click the code () icon to write the query in OPAL. In this example, we are using an interval Dataset, which we turn into a time series with timechart:
When creating the query, use group filters if you are getting too much noise. If you are getting too many alerts differentiate the rule's severity by using grouping conditions. For example:
- Warning for internal environments. For example:
env == "testing". - Error for staging environments: For example:
env == "staging". - Critical for production environments. For example
env == "prod".
You can further refine the amounts of alerts be restricting to critical services, high-value regions, or just the subset of groups you actively care about.
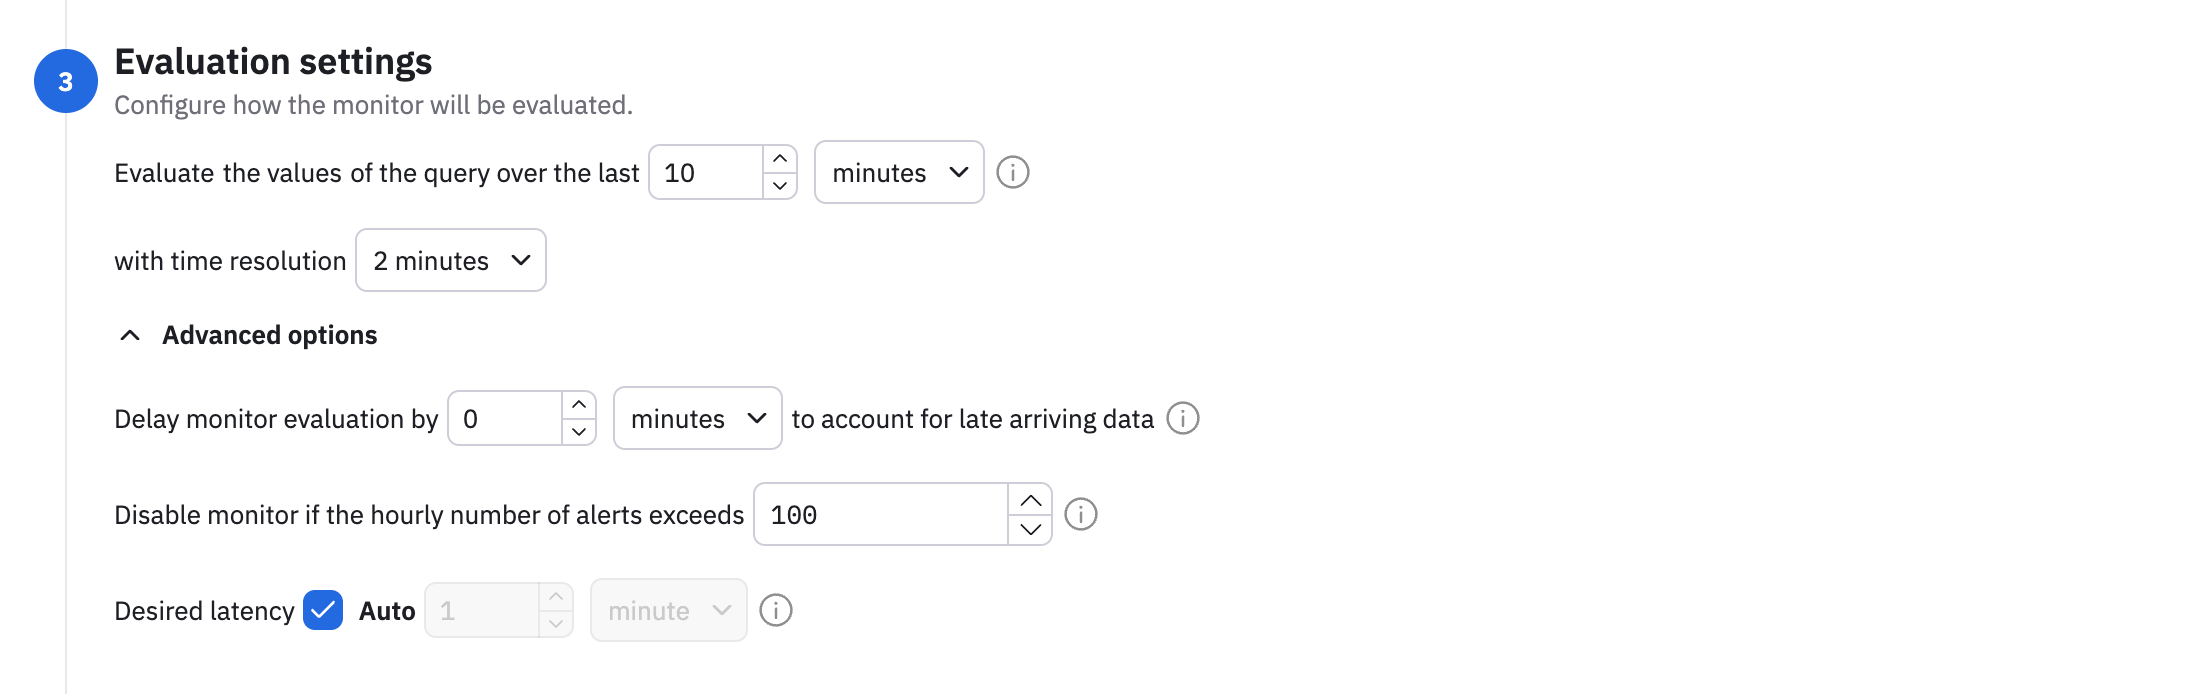
Configure how the monitor is evaluated
Define the evaluation window and time resolution.
Evaluation window
Evaluation window is the period of time you care about for alerting. For example, “In this window of time, what percentage of points look anomalous?”
How to choose your evaluation window:
- Short window, such as 5–15 minutes
- Great for fast‑moving metrics where you want quick detection.
- Combine with moderately fine resolution, such as 1-2 minutes.
- Medium windows, such as 30–60 minutes
- Good for noisy or bursty metrics, because the percentage of anomalous points is more stable.
- Long windows, such as hours
- Good for slow trends like daily volume patterns.
- Fewer evaluations (longer latency to alert).
Remember: the system also maintains a longer history window behind the scenes to learn the baseline; you don’t need to manage that manually in the UI.
Time resolution
Time resolution is the granularity of the time series. A finer resolution like 20 seconds can mean more detail, more noise, and more cost. A coarser resolution such as 4 minutes can help reduce cost, but you may miss narrow spikes in your data.
Expand the Advanced options to configure additional settings:
- Late arriving data - how long to wait for all the data to arrive before evaluating the monitor.
- Disable the monitor if the hourly number of alerts exceeds a specified number.
- Desired latency - how quickly the monitor responds to new data. The default is auto, where an efficient latency is selected for you, based on your query.
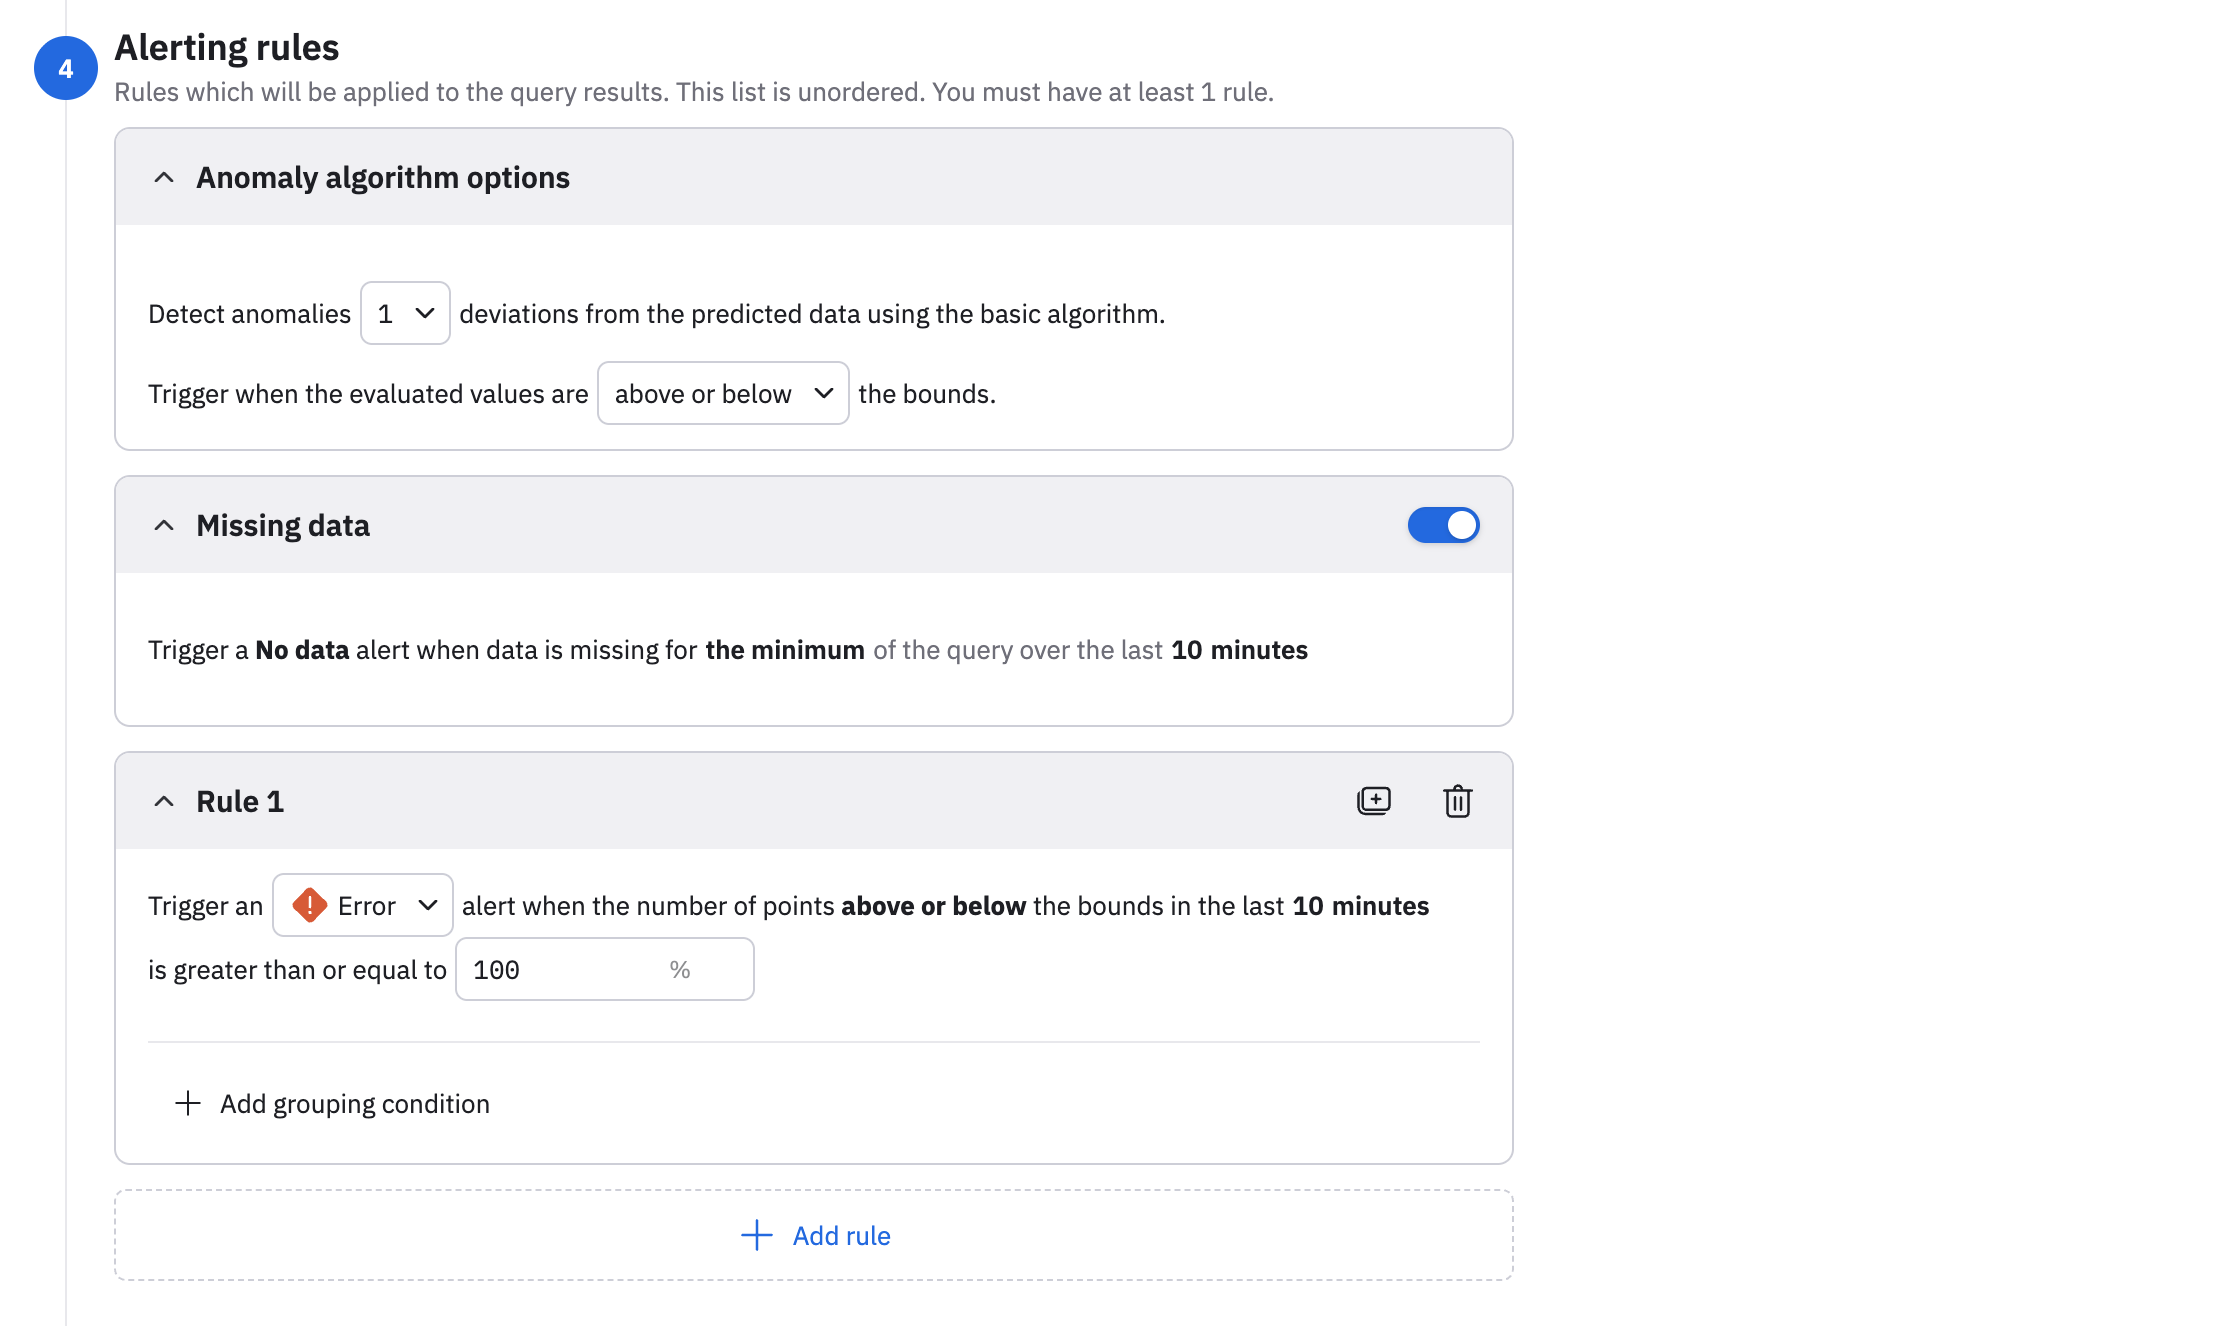
Define the alerting rules
Define the conditions for when an alert is raised. An anomaly monitor must have at least one alerting rule.
- Select the standard deviations from the drop-down list. Selecting 1 makes the rule very sensitive. Many points will be outside the bounds. You should select a low value like 1 only in combination with a high percentage threshold or very stable metrics. Selecting 2 is recommended for most cases, as this catches clear deviations without being too noisy. Selecting 3 or higher makes the rule more conservative, and is good for very noisy metrics where you only care about large spikes or drops.
- Select the bounds you care about. For example, select above if you only want values higher than the upper bound to count as anomalies, or below if you only want the values below the lower bound to count as anomalies, or above or below if you want both.
- Slide the Missing data toggle to the on position to trigger a no data alert if data is missing for the minimum of the query over the last 10 minutes. Enabling the missing data toggle also makes the No data severity available, which you can select when you configure your notification actions.
- Configure an alerting rule, specifying the alert severity and alert threshold. To help tune the volume of alerts you receive, click Add grouping conditions and configure additional logic, such as:
- Warning for internal environments. For example:
env == "testing". - Error for staging environments: For example:
env == "staging". - Critical for production environments. For example
env == "prod".
- Warning for internal environments. For example:
You can further refine the amounts of alerts be restricting to critical services, high-value regions, or just the subset of groups you actively care about.
Provide a description
Provide a description for this anomaly monitor explaining what this monitor does and how it works. You can't use variables in the description.
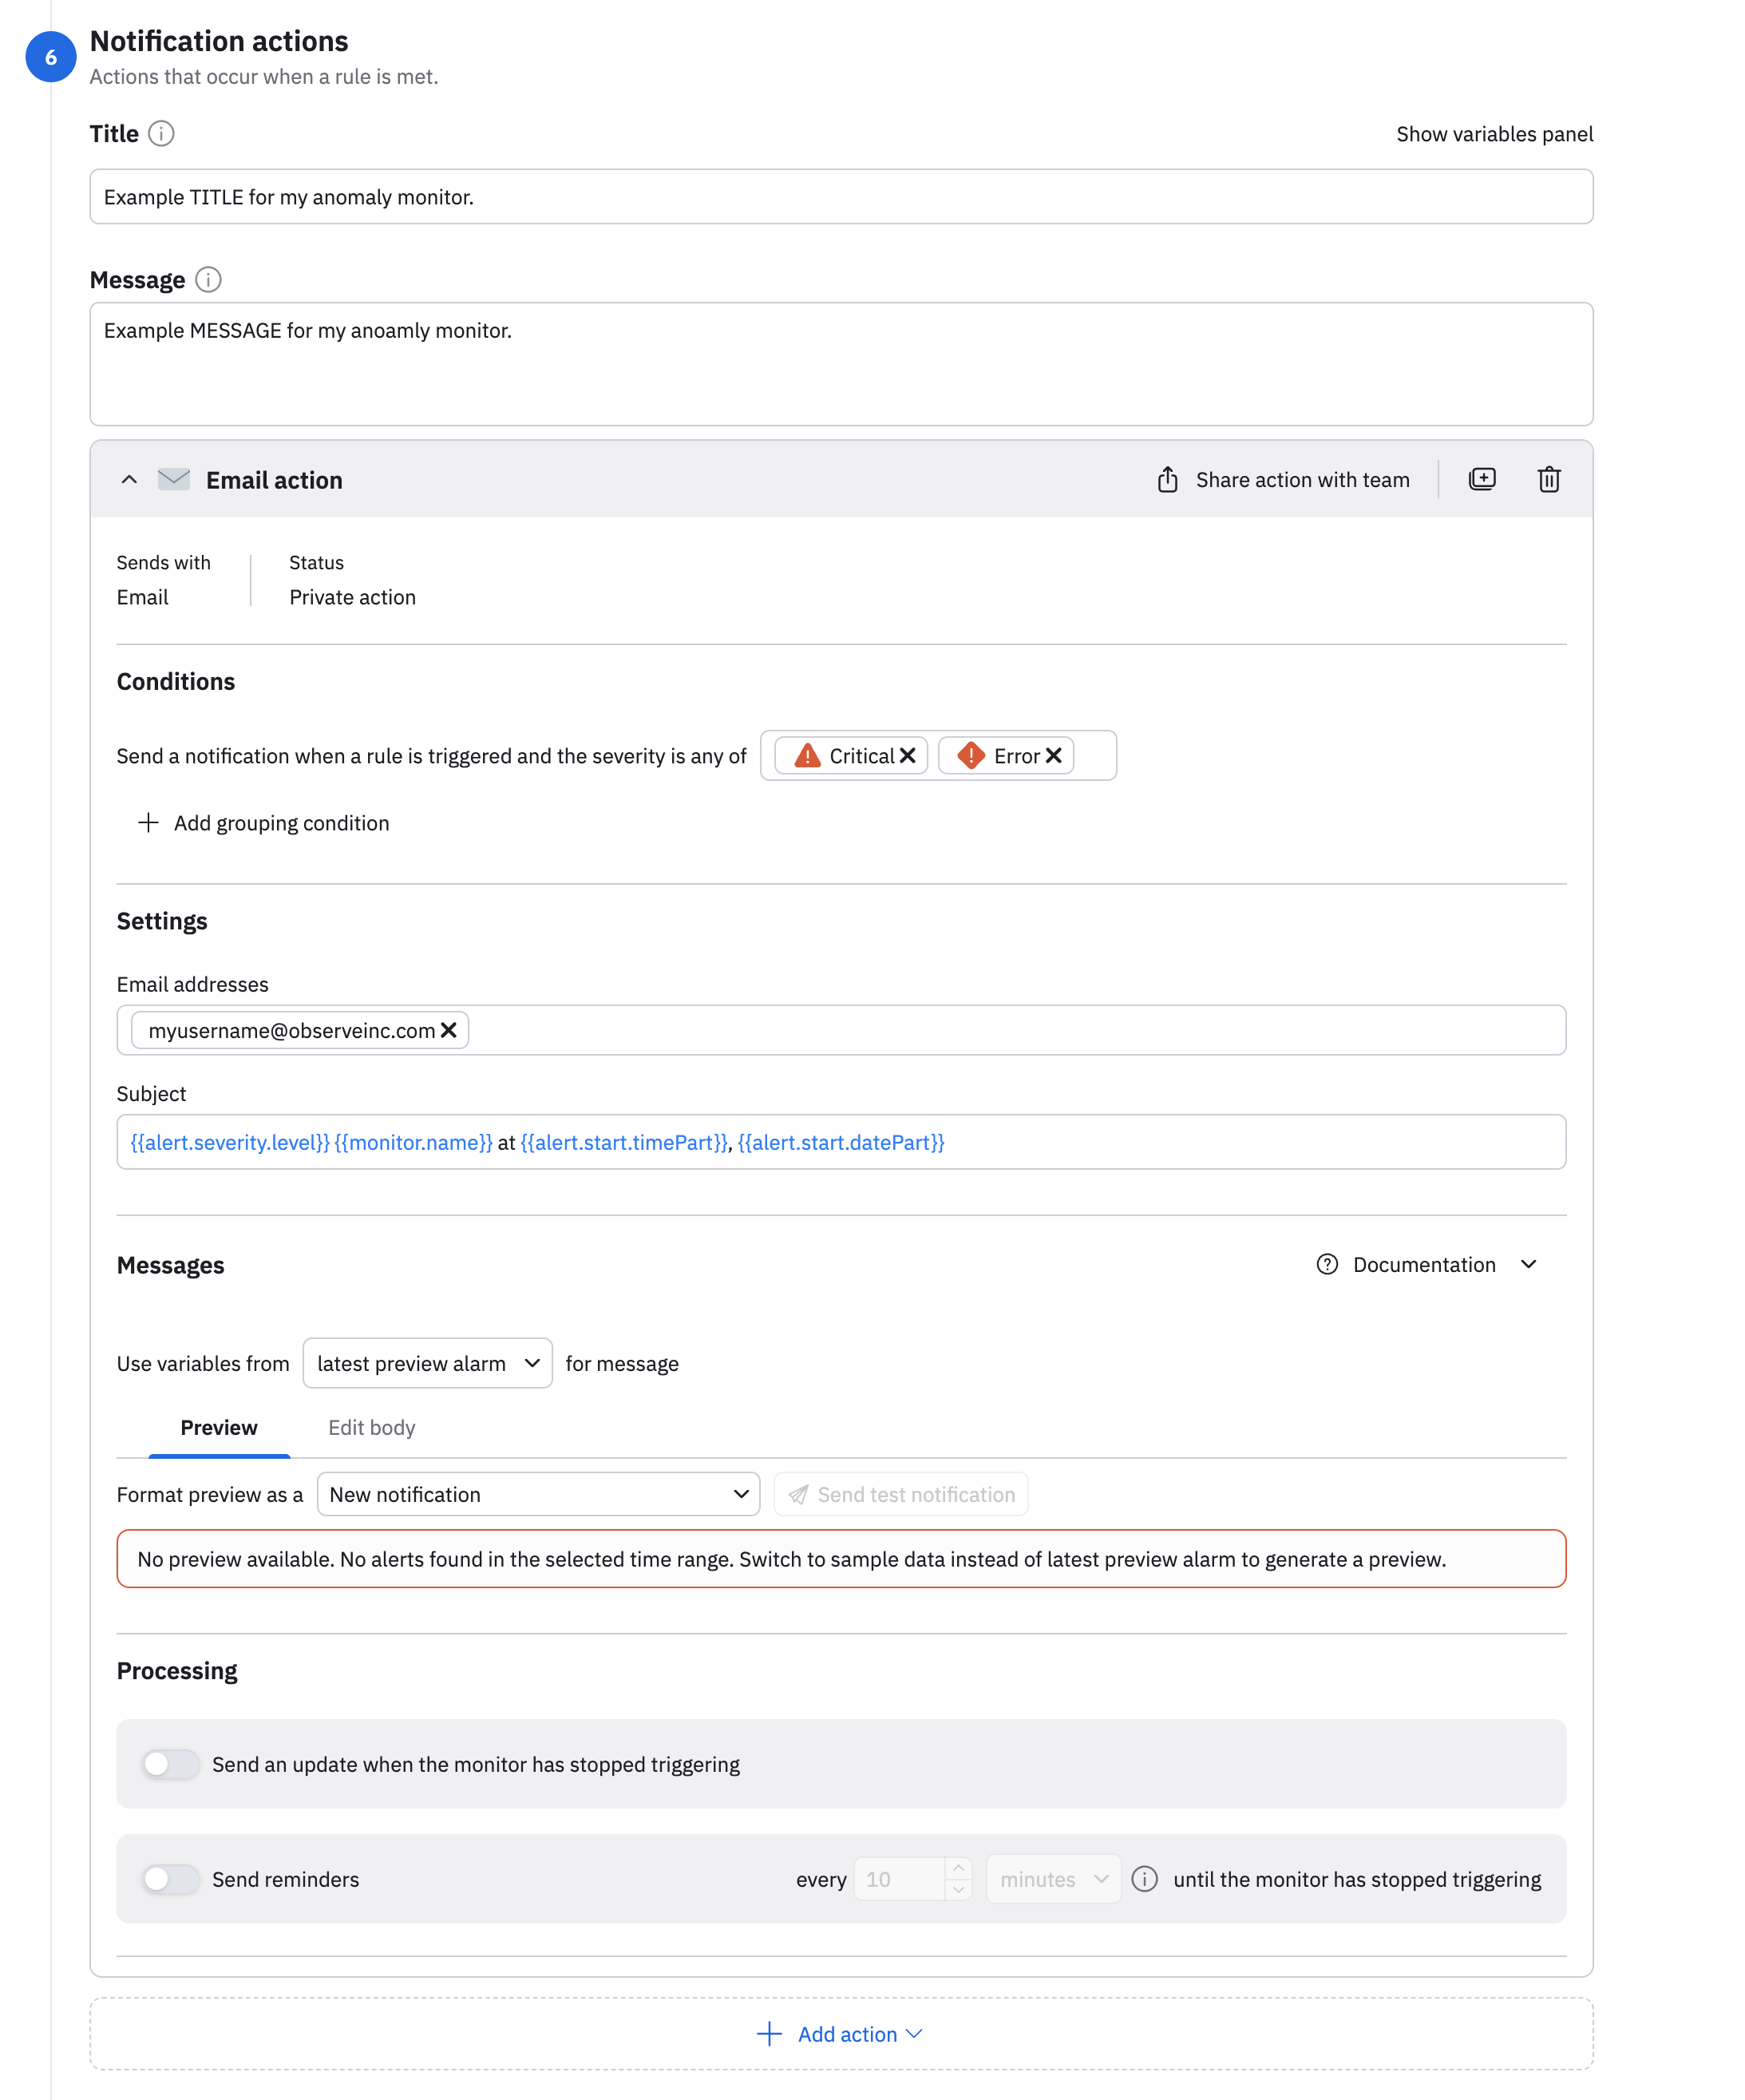
Configure the notification actions
Configure the notification actions you want to launch when a rule is met. You can configure notifications actions using email, webhook, Slack, or PagerDuty. Below is an email example:
Preview a triggered alert
Take a look at a preview of a triggered alert as you have configured it.
Save and publish the monitor
Click Save changes to create the anomaly monitor.
Updated 4 days ago