Customize and configure your visualizations
This page describes the ways you can customize your visualizations in Observe.
Customize the X and Y axis and number formatting
The Visualization Setting area has the following options:
- X Axis selects the variable that will be used for the horizontal range of the chart. A common option is to set this to a variable representing time, to make a timechart.
- Y Axis selects the variable that will be used for the vertical range of the chart.
The Axis area controls display of the X (horizontal) and Y (vertical) axis:
- Show X-Axis toggles the unit legend of the horizontal axis on or off. You can also add a Label string. You can also choose to hide the X axis gridlines. The range of the X axis can also be adjusted here. Select from Query Window (range is as long as the query) or Fit to Data (range is as long as the amount of data in the query).
- Show Y-Axis toggles the unit legend of the vertical axis on or off. You can also add a Label string. The minimum and maximum bounds of the Y axis can also be adjusted here if automatic sizing is not working for your use case. Activate the Y-axis log scale option and select a base size to use logarithmic scale. You can also choose to hide the Y axis gridlines.
You can also choose to set custom lower and upper bounds for the Y axis.
The number formatting section allows you to select the base unit type of the Y axis variable. You can select from pre-existing options such as weights, volumes, and data amounts, or enter a custom unit label. Custom units do not perform any math conversions on the data. See Units of measurement for more detail.
Add summary statistics to your legend
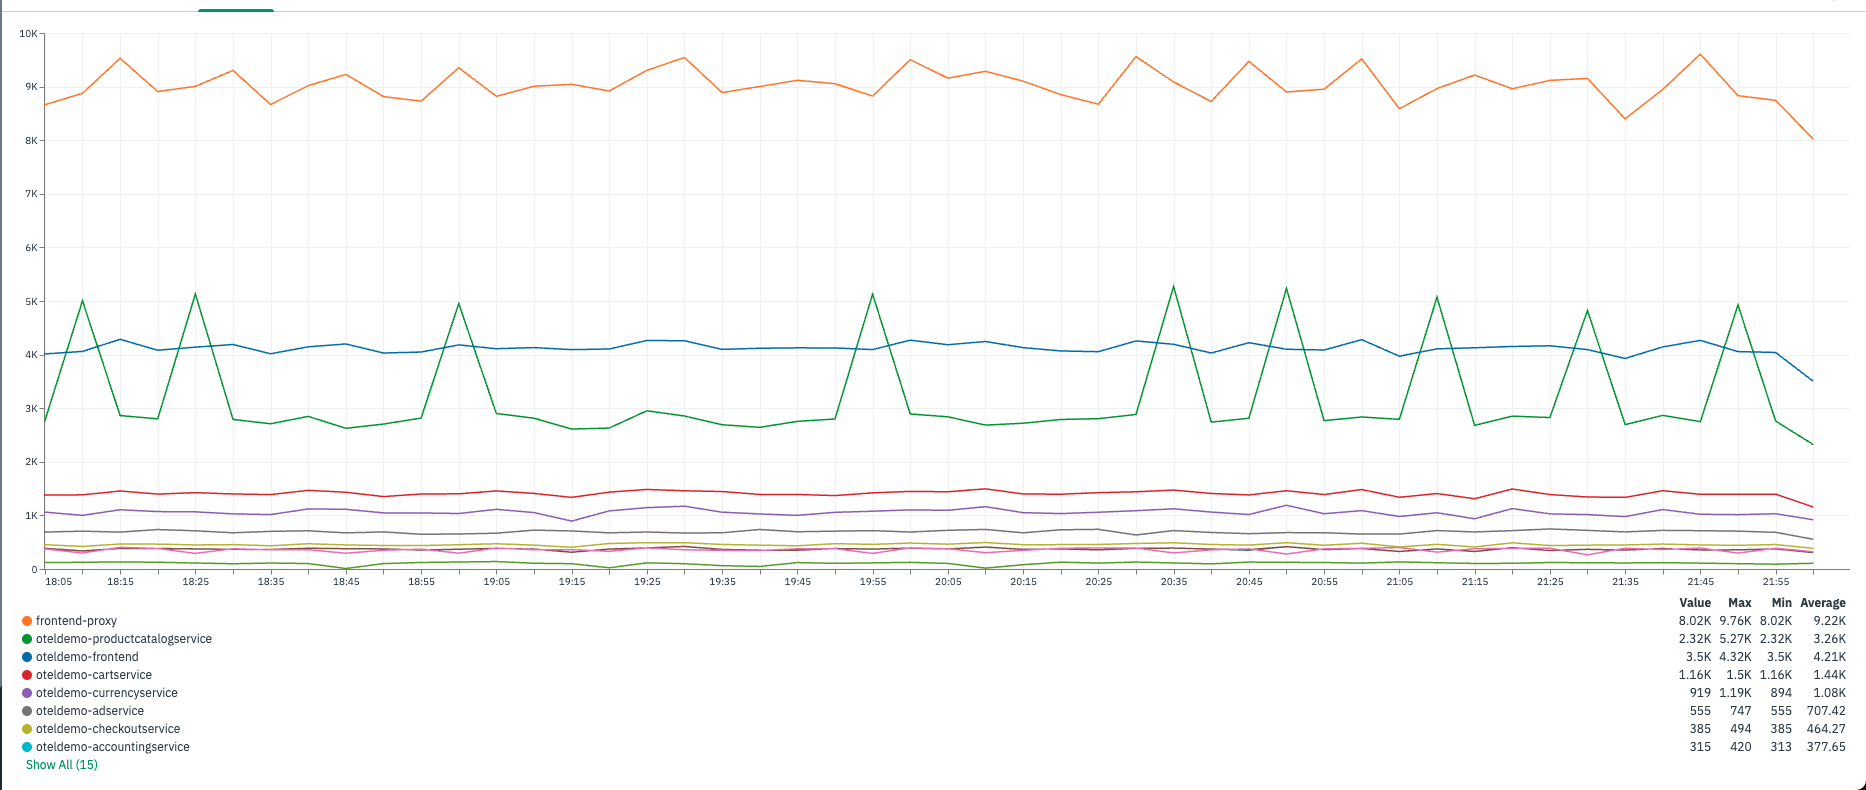
The Legend and Tooltip area allows you to customize the legend for the graph. If you choose Table presentation, you can choose to add the following values per series to the legend:
- Max
- Min
- Average
- Total
- Value
Manage colors in visualizations
The Color area allows you to manage line colors. If you have a single value, use the Single option and select a color from the palette. If you have multiple fields in a group_by, use the By Value option and name each grouped field, then click the pencil to the left to set its color. If no changes are made in this area, colors are selected randomly by Observe. The Chart Area Fill Style option in Color allows you to decorate a line chart with a color fill.
Add annotations to visualizations
The Overlays area supports adding Annotations to your charts.If you use this feature, you can overlay a threshold as a horizontal line or a shaded area over the chart. This makes it easy to visualize when the data is breaching an intended range. Multiple thresholds can be overlaid on a single chart.
Annotation is a line chart feature that supports dynamic overlays from a single existing data source for charts with time on the X axis. Select a data source (Dataset, Query, or Dashboard filter from the same dashboard as the chart). Data sources for annotation need to have a time column as well. If the annotating chart has a Valid From timestamp column, it will be used automatically to overlay rows onto the chart. You can select another timestamp column for annotation, select fields for the tooltip, and select the annotation color.
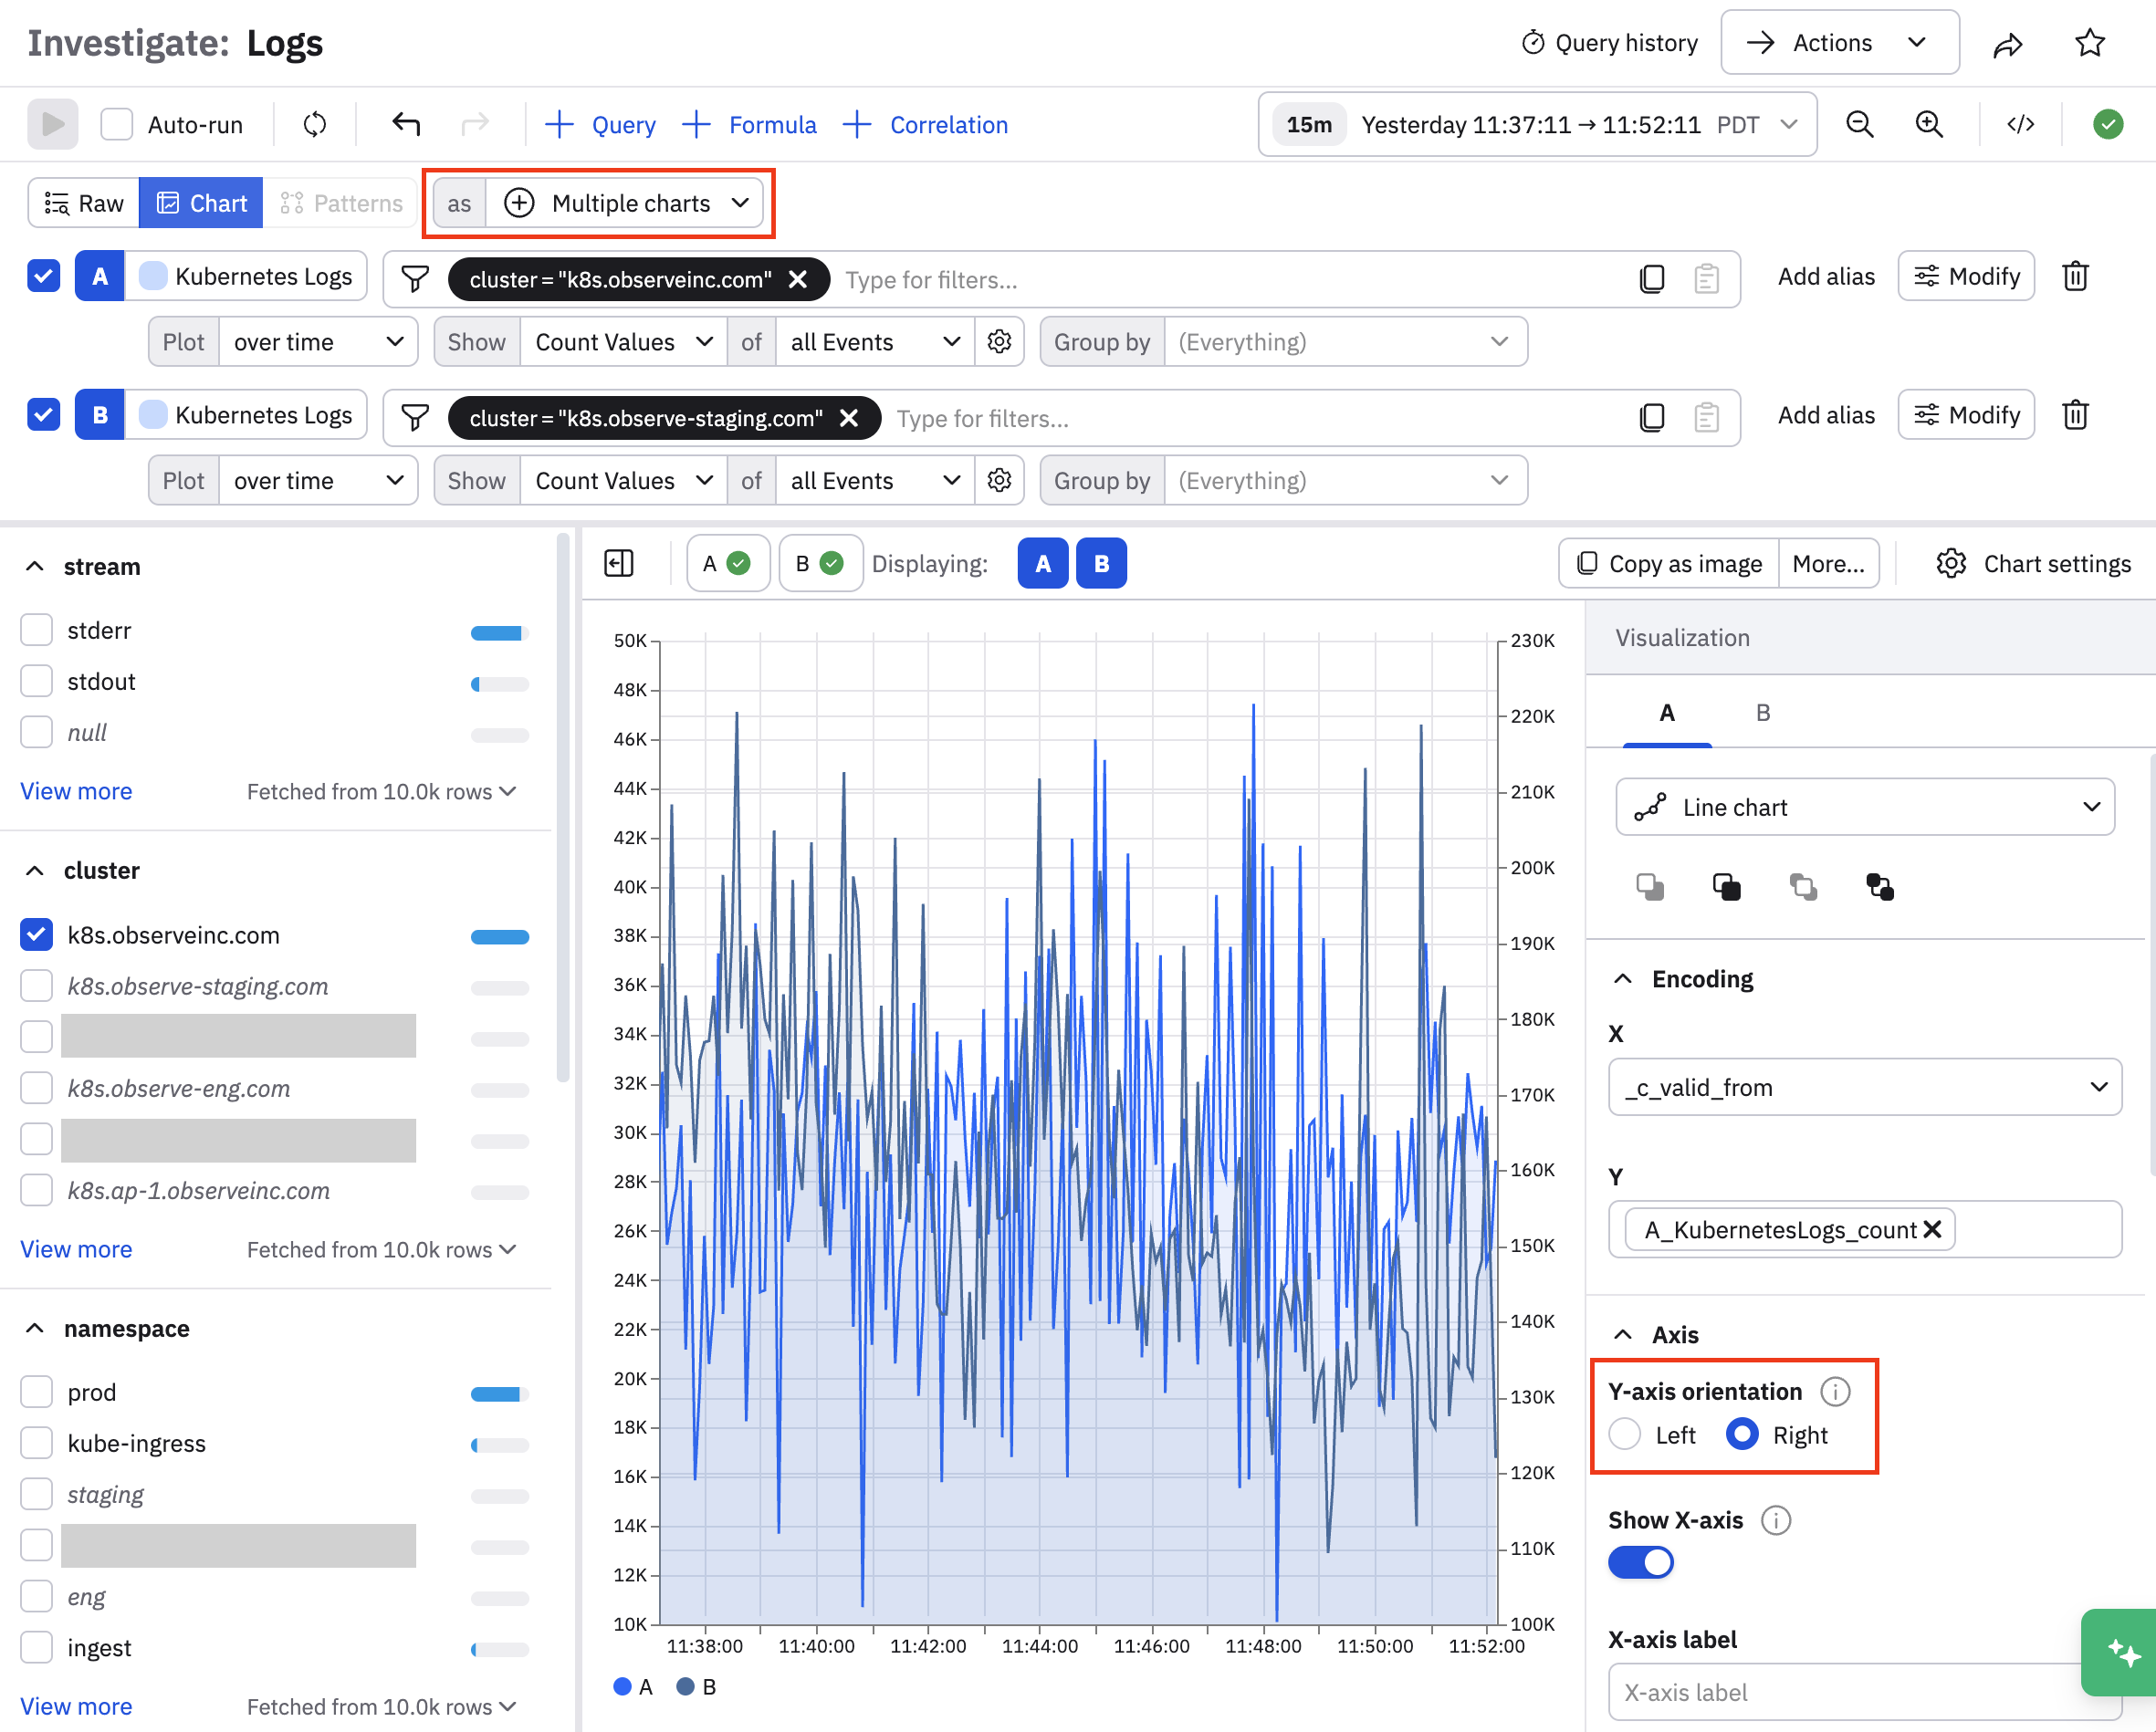
Use the Multiple Charts visualization for plotting multiple Y-axes
If you have a use case where you want to plot two different sets of data in a single chart, you can use the Multiple Charts visualization type. In this example we are looking at the number of log events for two clusters, k8s.observeinc.com (query A) and k8s.observeinc-staging.com (query B) over time.
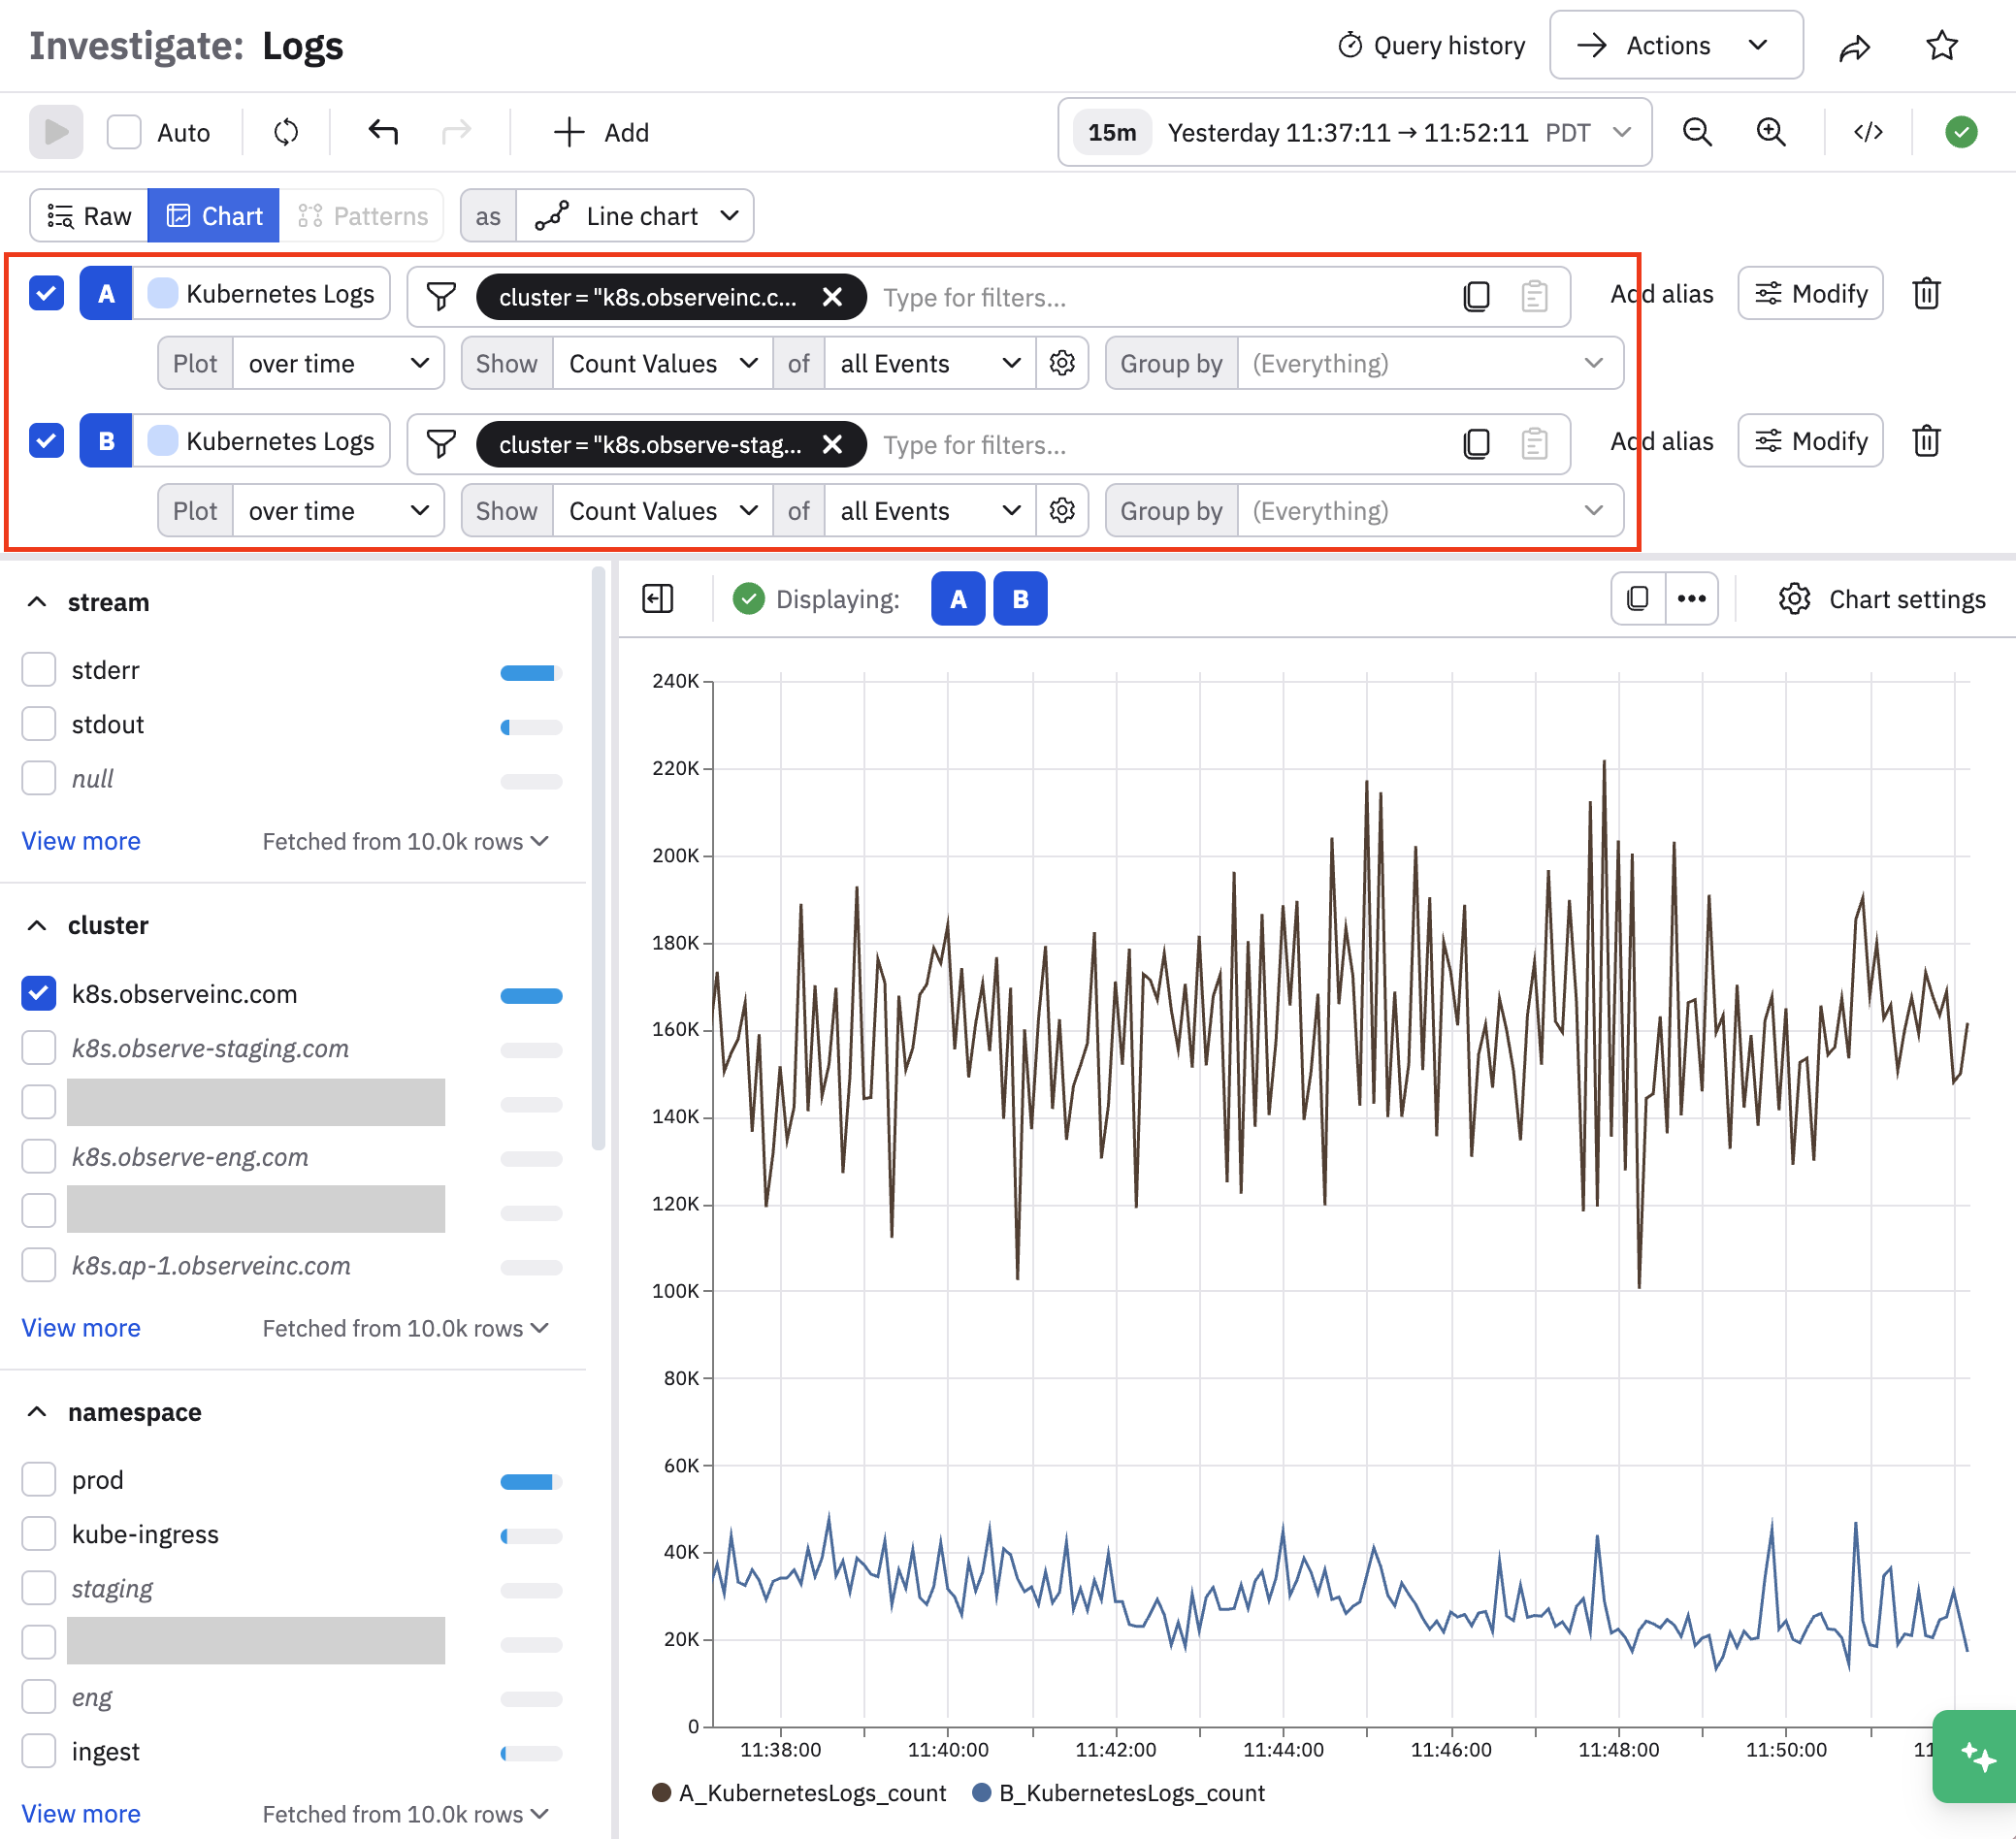
To set up multiple charts, perform the following steps:
- Select Multiple charts as the visualization type.
- Open the Chart settings, and change one of the query settings to Right.
Updated about 1 month ago