Line chart
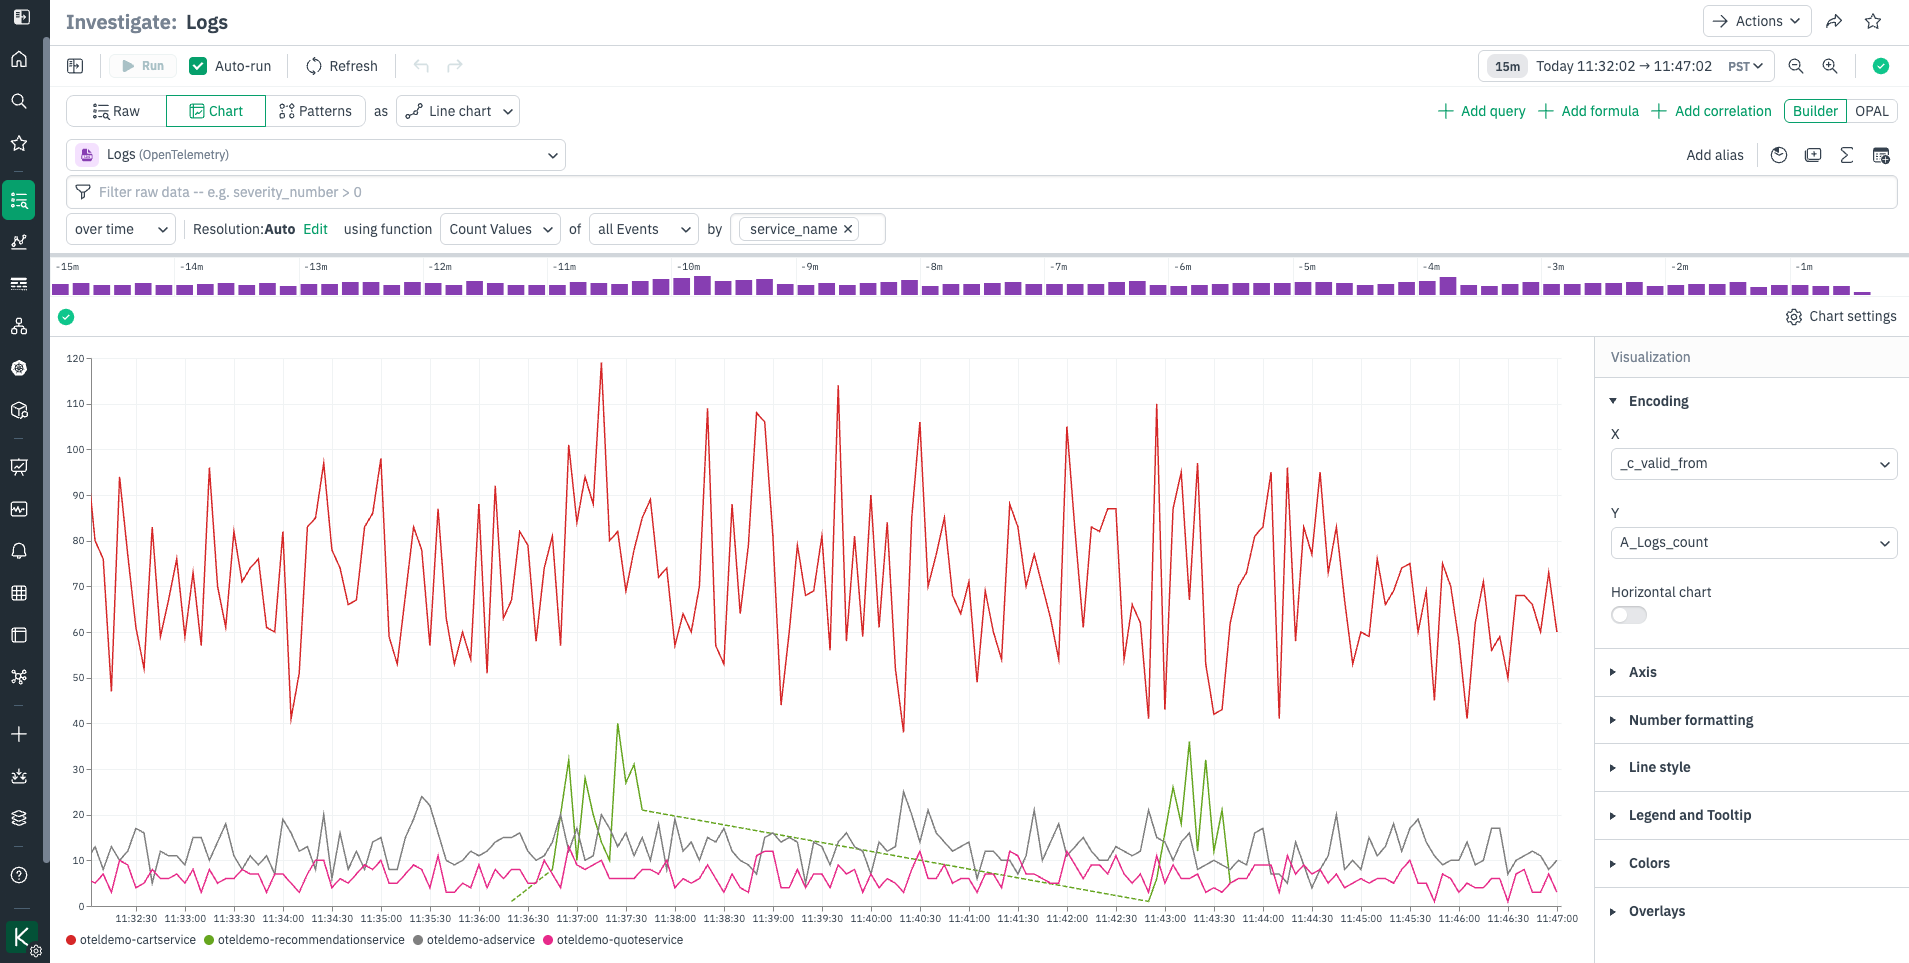
The line chart, also known as time series in other systems, presents values on an X and Y axis. It is the most common and default type of visualization. Line charts are effective at showing how something changes over time.
Updated 6 months ago
Did this page help you?