

Change over time
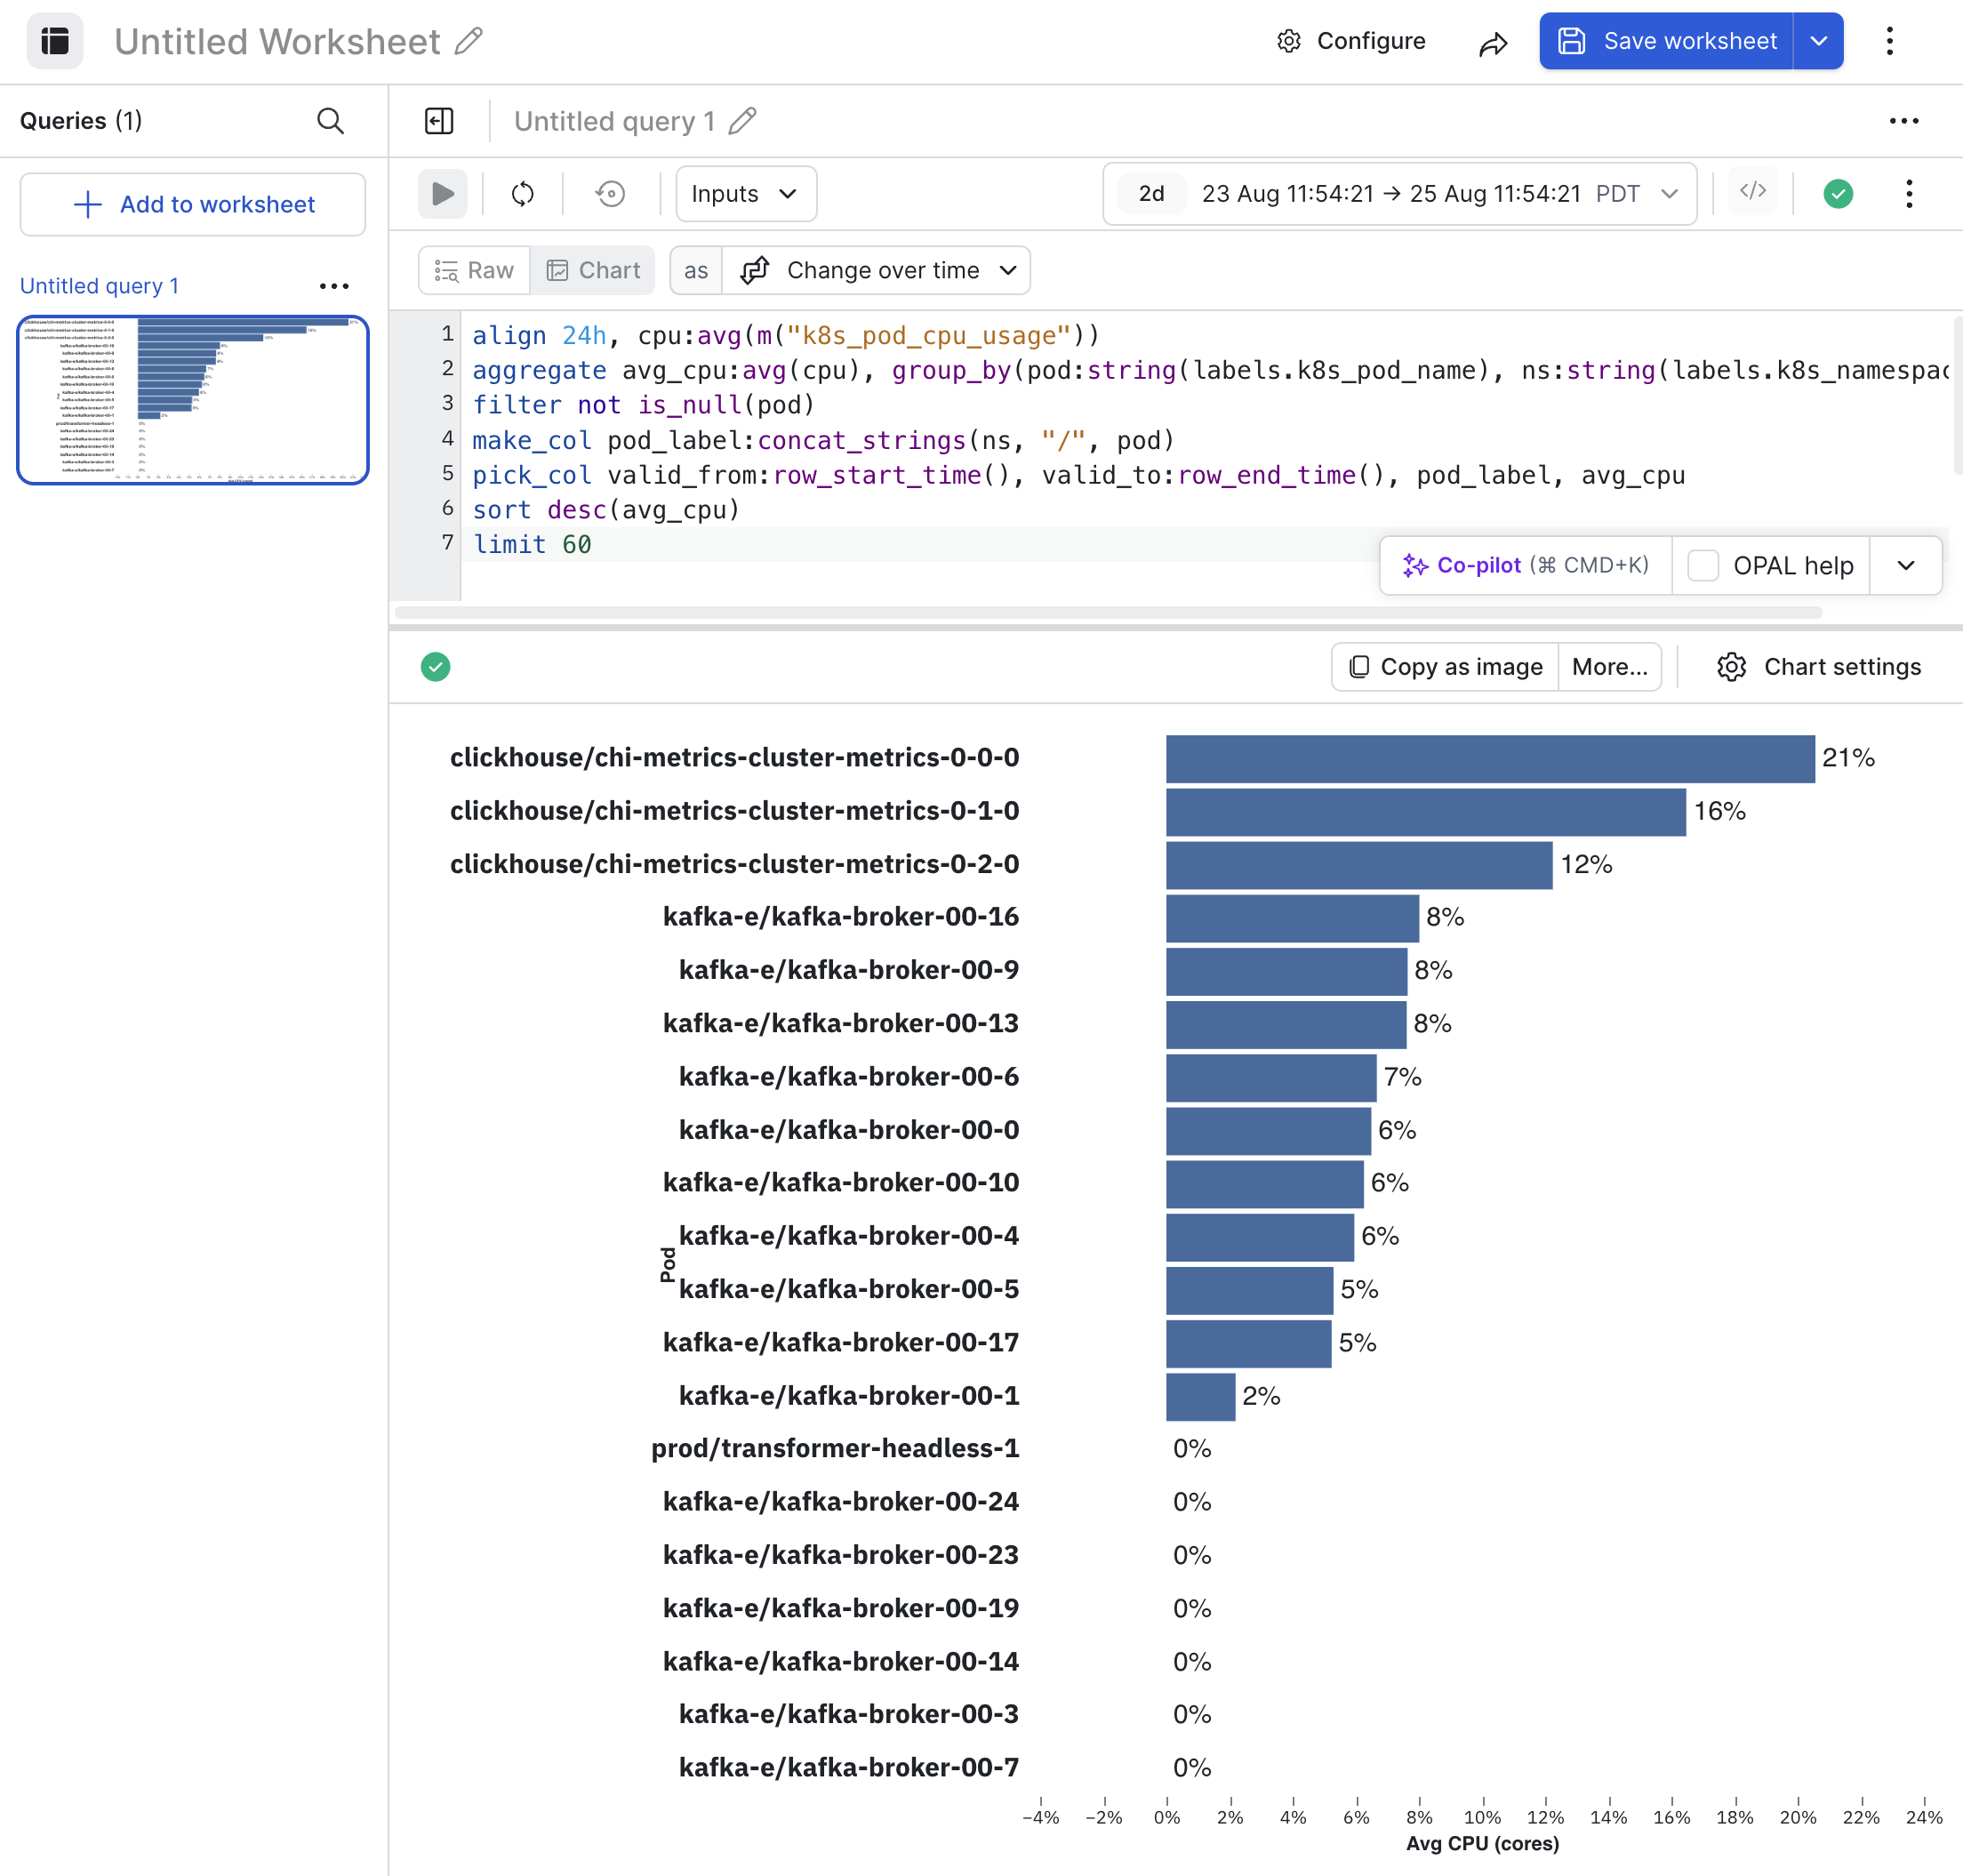
Change over time is a convenient way to visualize the change in a metric over the query window, split out by groups.
Change over time settings
Click Chart settings to configure the properties for a change over time chart.
| Setting | Description |
|---|---|
| Encoding | Configure how the data is mapped to the X and Y axes. |
| Axis | Configure whether or not you want to show the X axis on the chart. |
| Value formatting | Configure how the values on the Y axis are represented.
|
| Colors | Configure the color scheme you want to use for the chart. |
| List | Configure the sort order you want to use for the chart (ascending or descending). |
Updated about 2 months ago
Did this page help you?