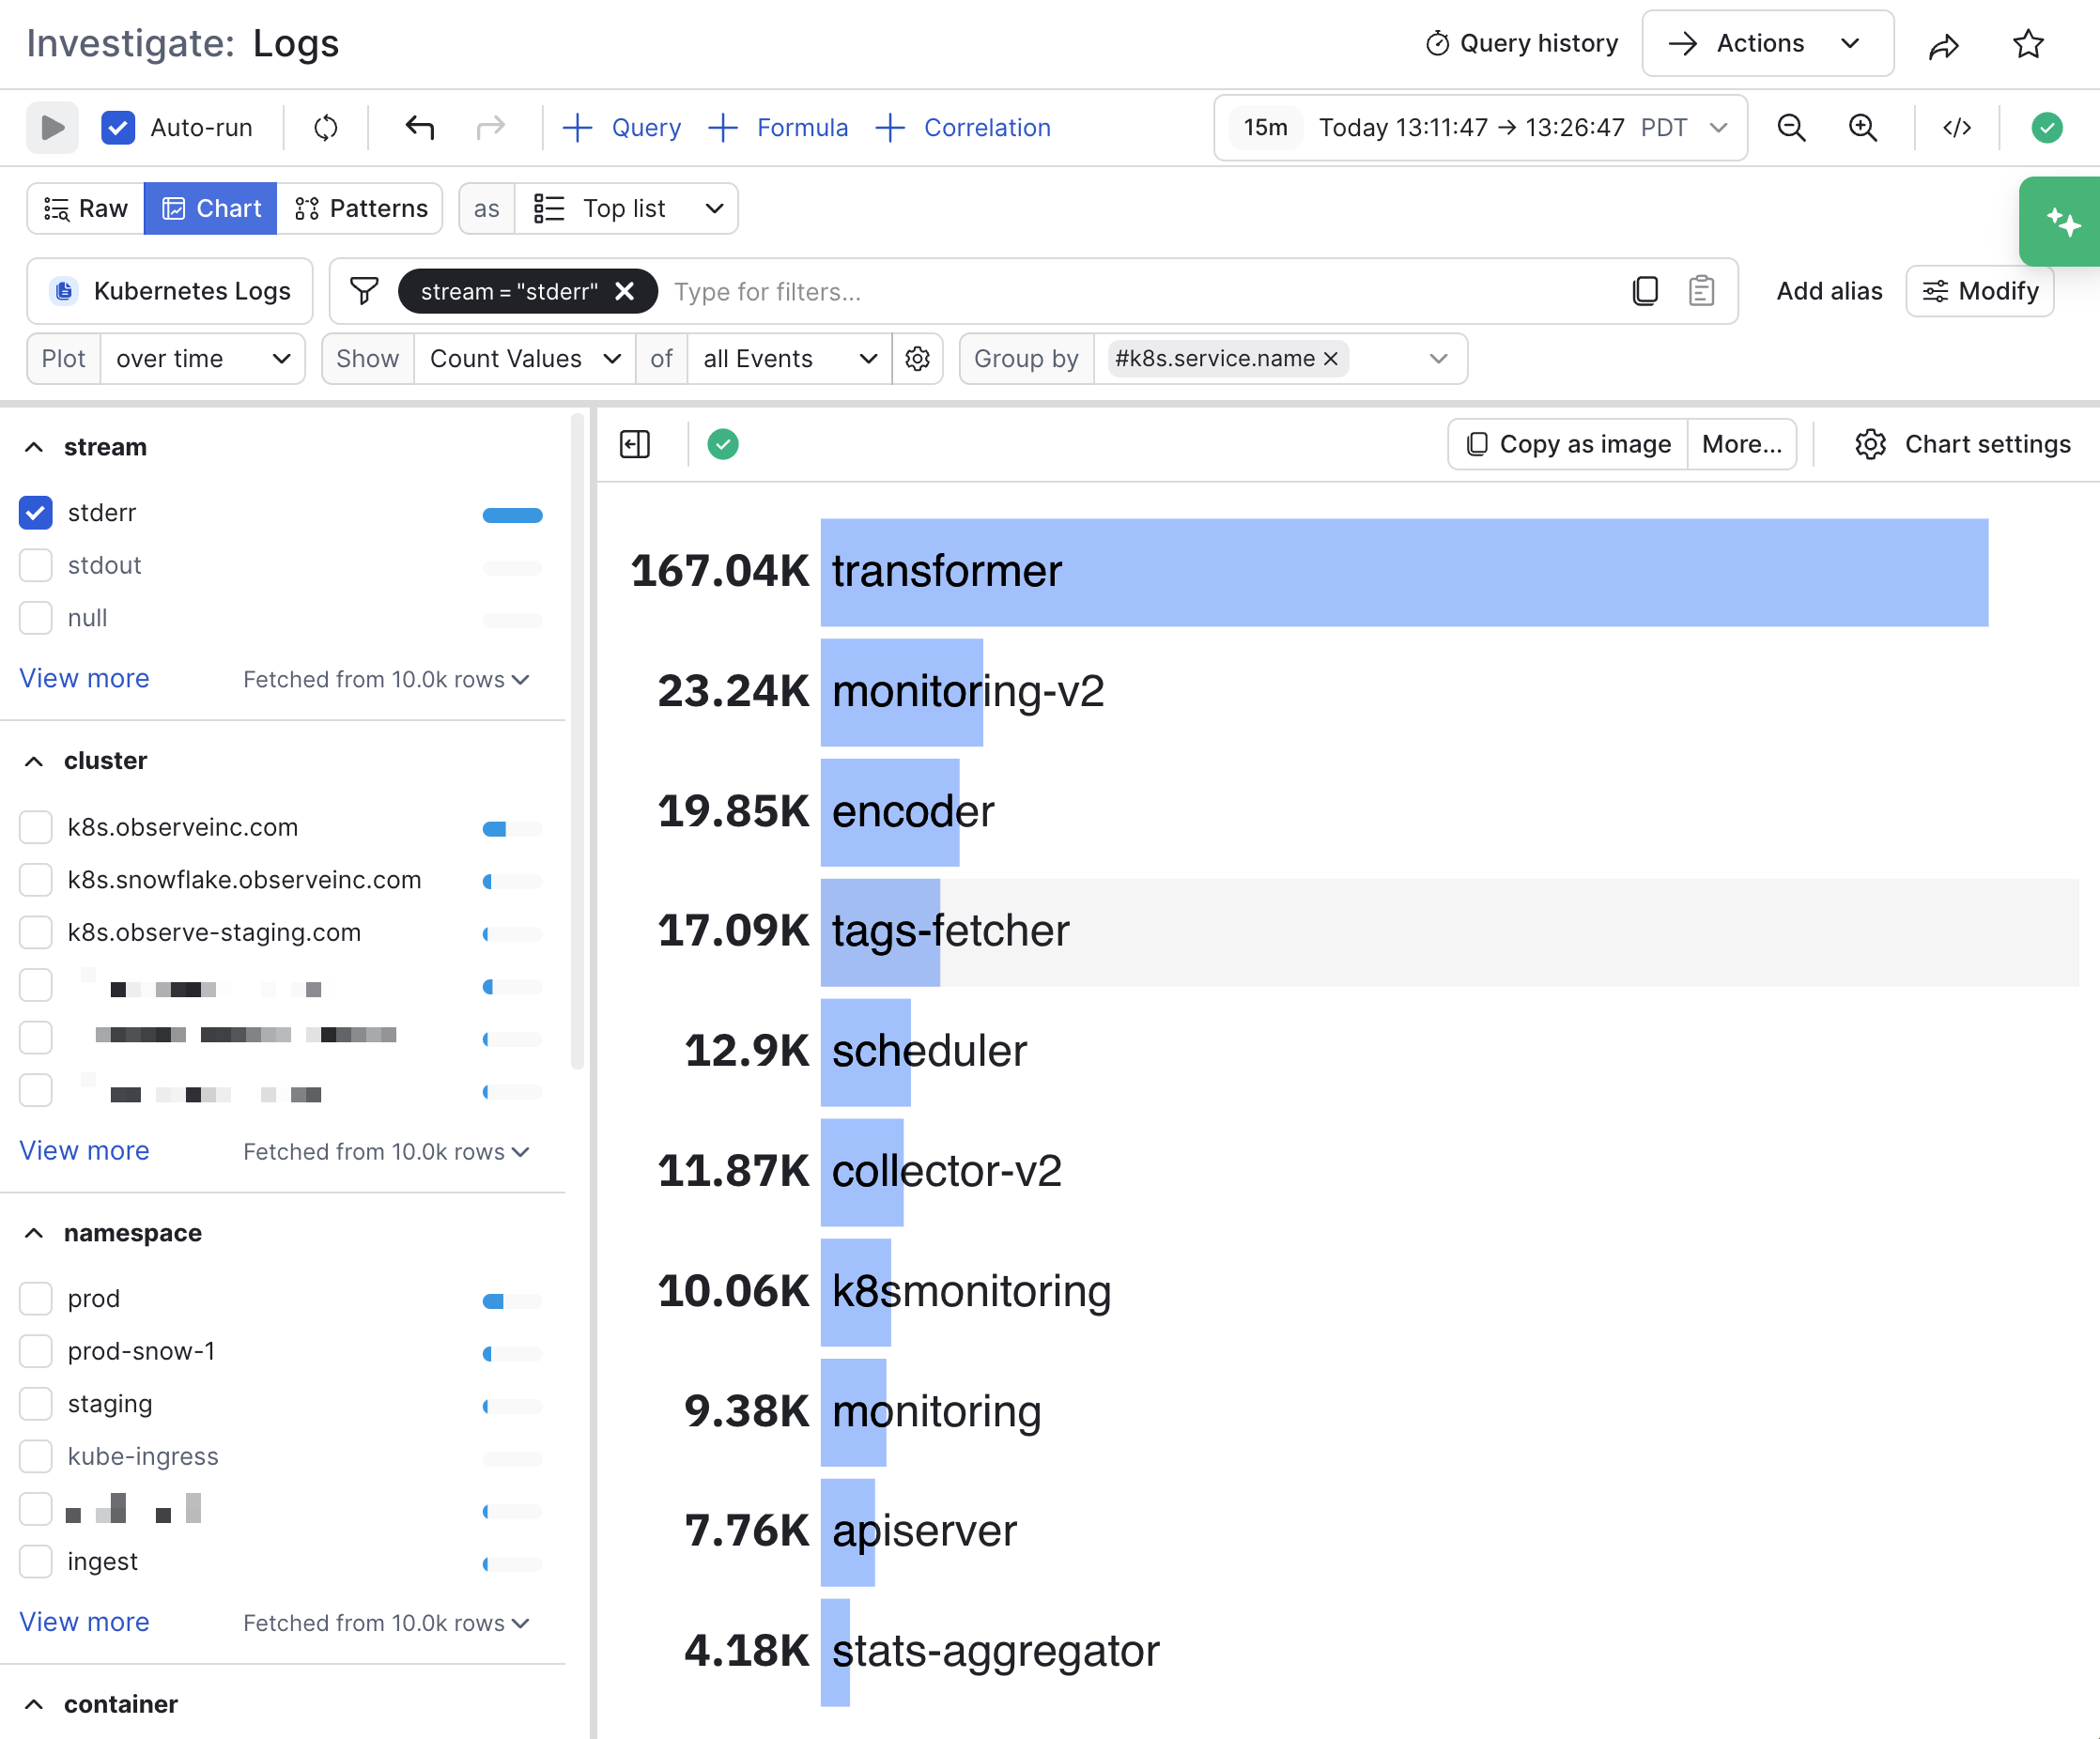
A top list visualization displays the Top N (where n is configurable) items from a query. It is a helpful way to visualize the top groups for a specific query.
Click Chart settings to configure the properties for a top list.
| Setting | Description |
|---|
| Encoding | Select what each row represents (Key) and how it is represented numerically (Value). |
| Value formatting | Configure how the values on the chart are represented.
- Select a number unit type, such as decimal, unit, or currency.
- Select a locale, notation, compact display, and sign display
- Select Hide grouping separators to remove the commas, periods, or spaces used to break up large numbers into readable blocks.
- Select the number of fraction digits and significant digits you want displayed.
|
| Colors | Configure custom colors you want to use for each item in the chart. |
| List | Configure the items that appear in the top list.
- Select the function used to aggregate values, such as average, count, distinct, max, min, or median.
- Set the height of each item. If this setting makes the chart bigger than the container, a scroll bar appears so you can view specific sections of the chart.
- Select the sort order of the items: more to less or less to more.
- Select the max number of items you want displayed. If there are overflow items, you can configure an Other category to combine the overflow items.
|