Single stat
The single stat chart presents the latest value for a single field.
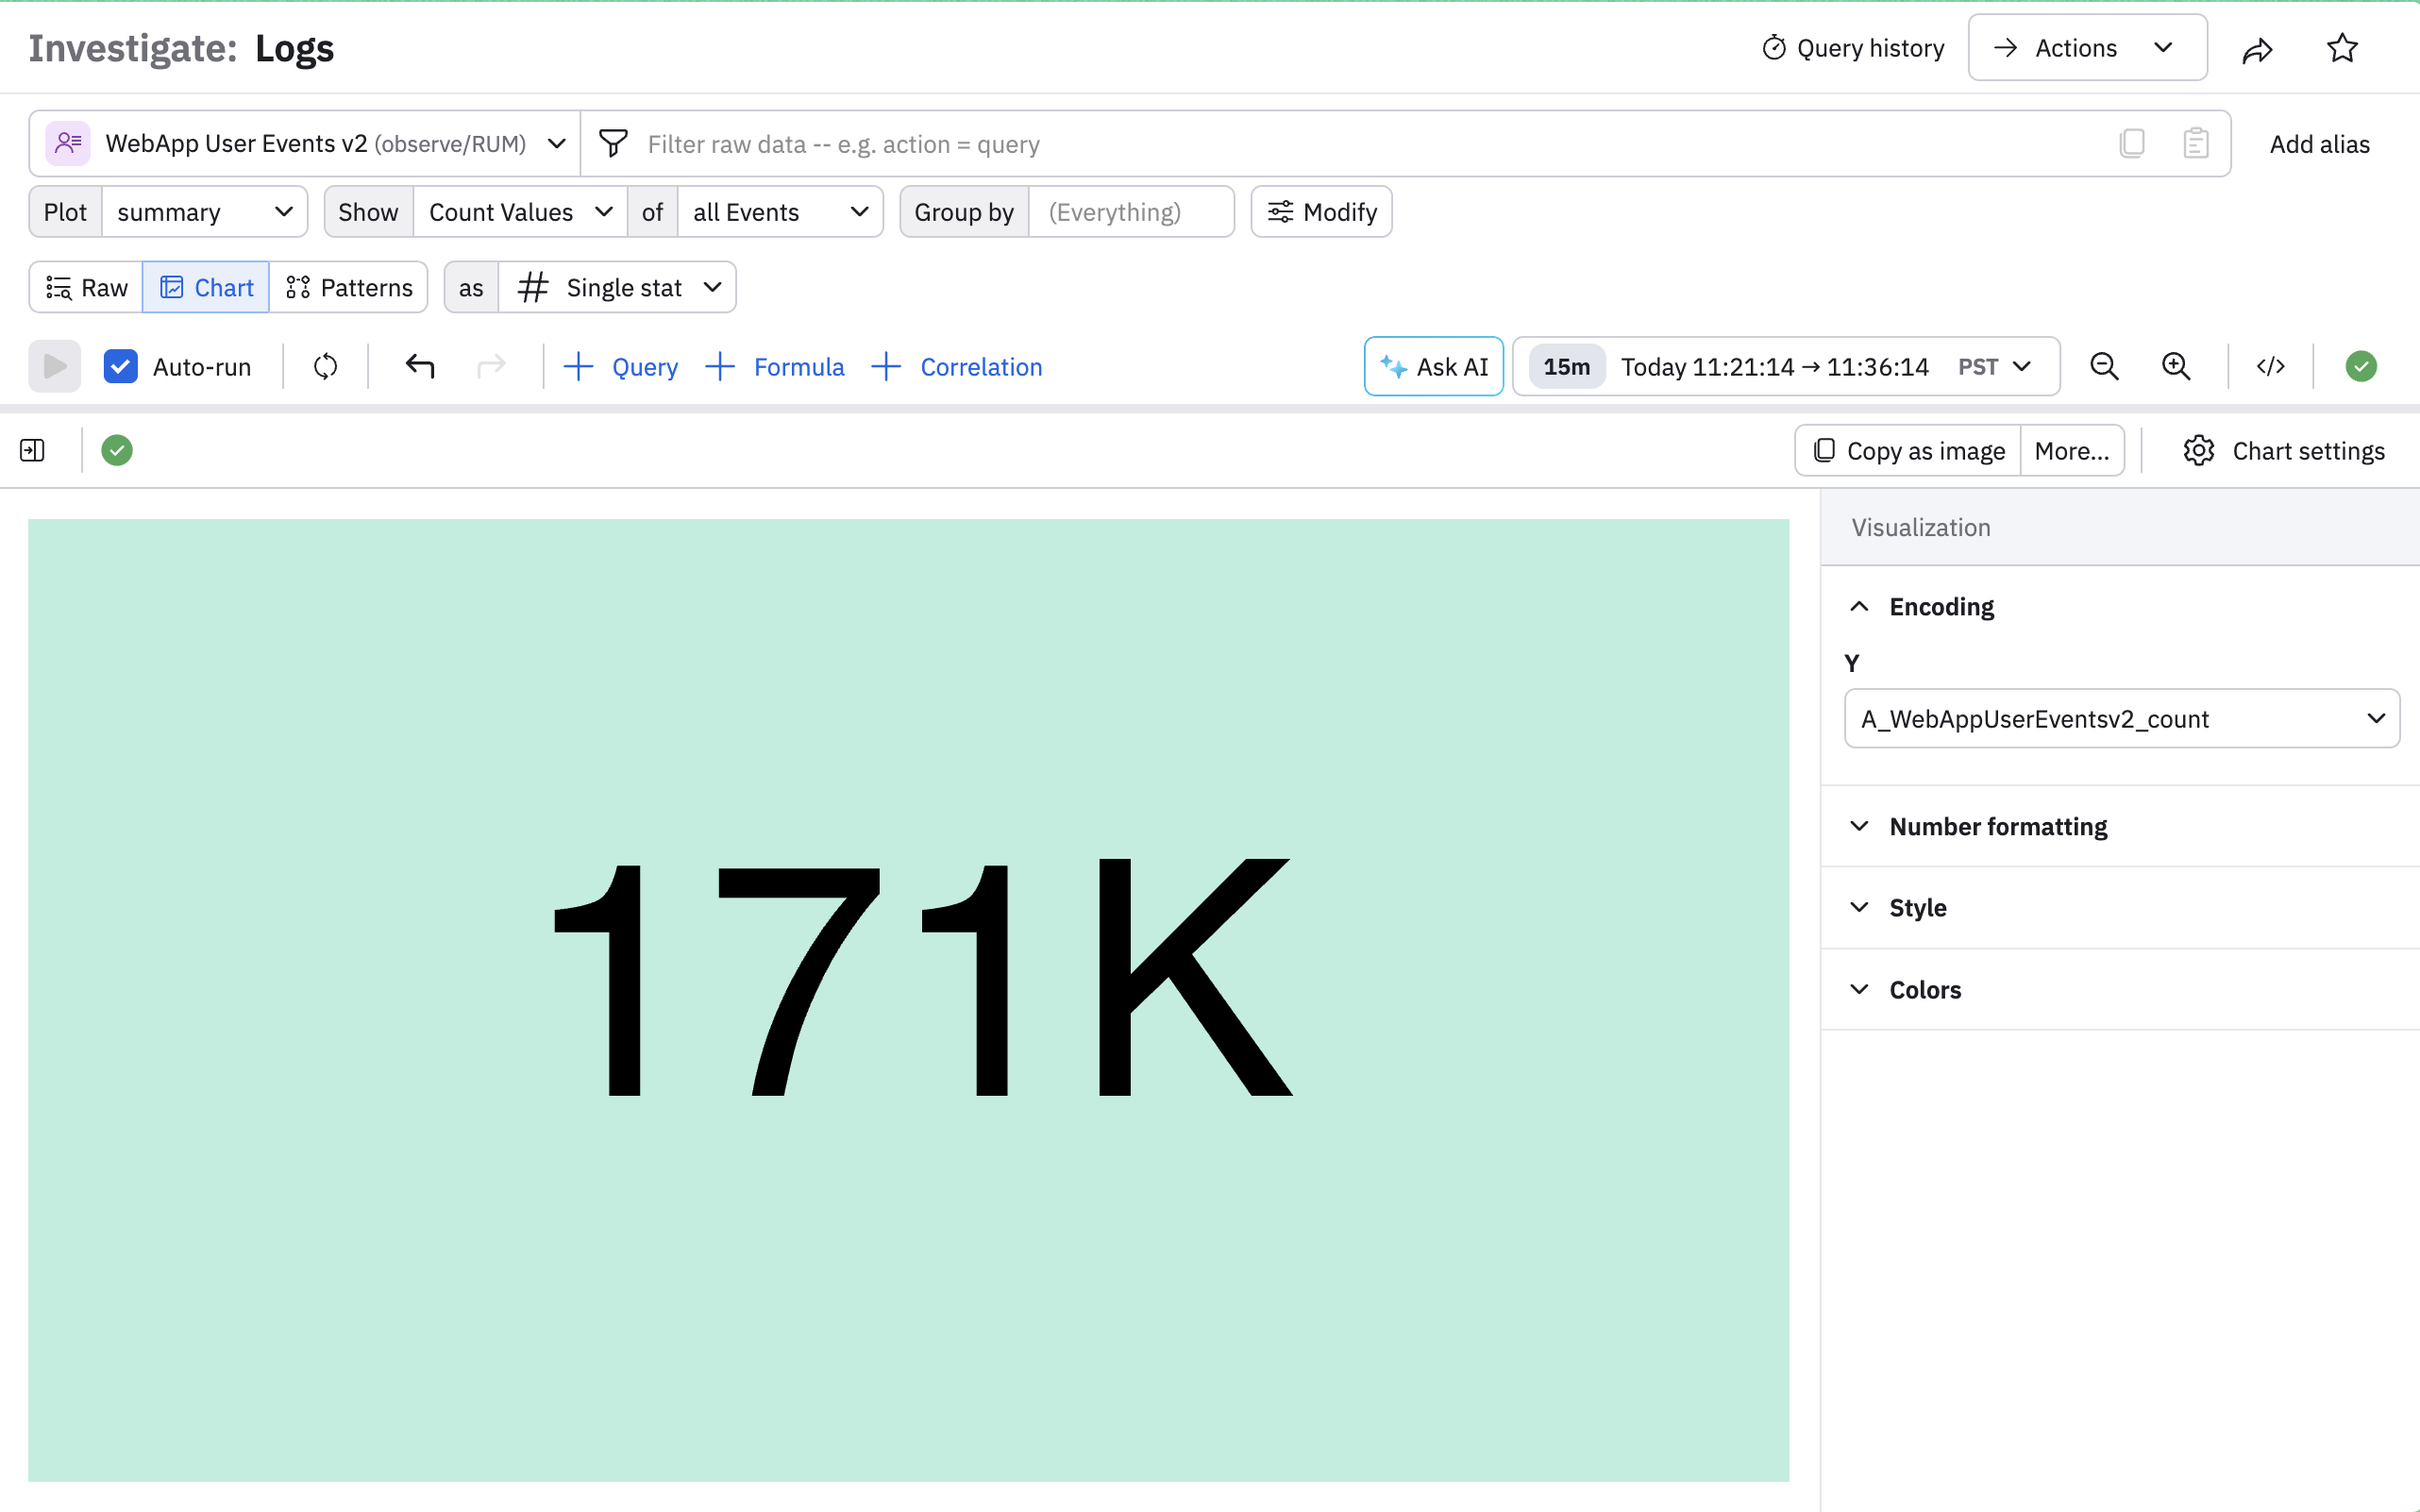
For example, here we see the total number of events for a web application:
Use the chart settings panel to customize this dashboard.
| Setting | Description |
|---|---|
| Encoding | This section shows just one value, which is the value being displayed in the chart. In this example, it's the total number of user events in the web application, A_WebAppUserEventsv2_count. |
| Number formatting | Some features available in this section:
|
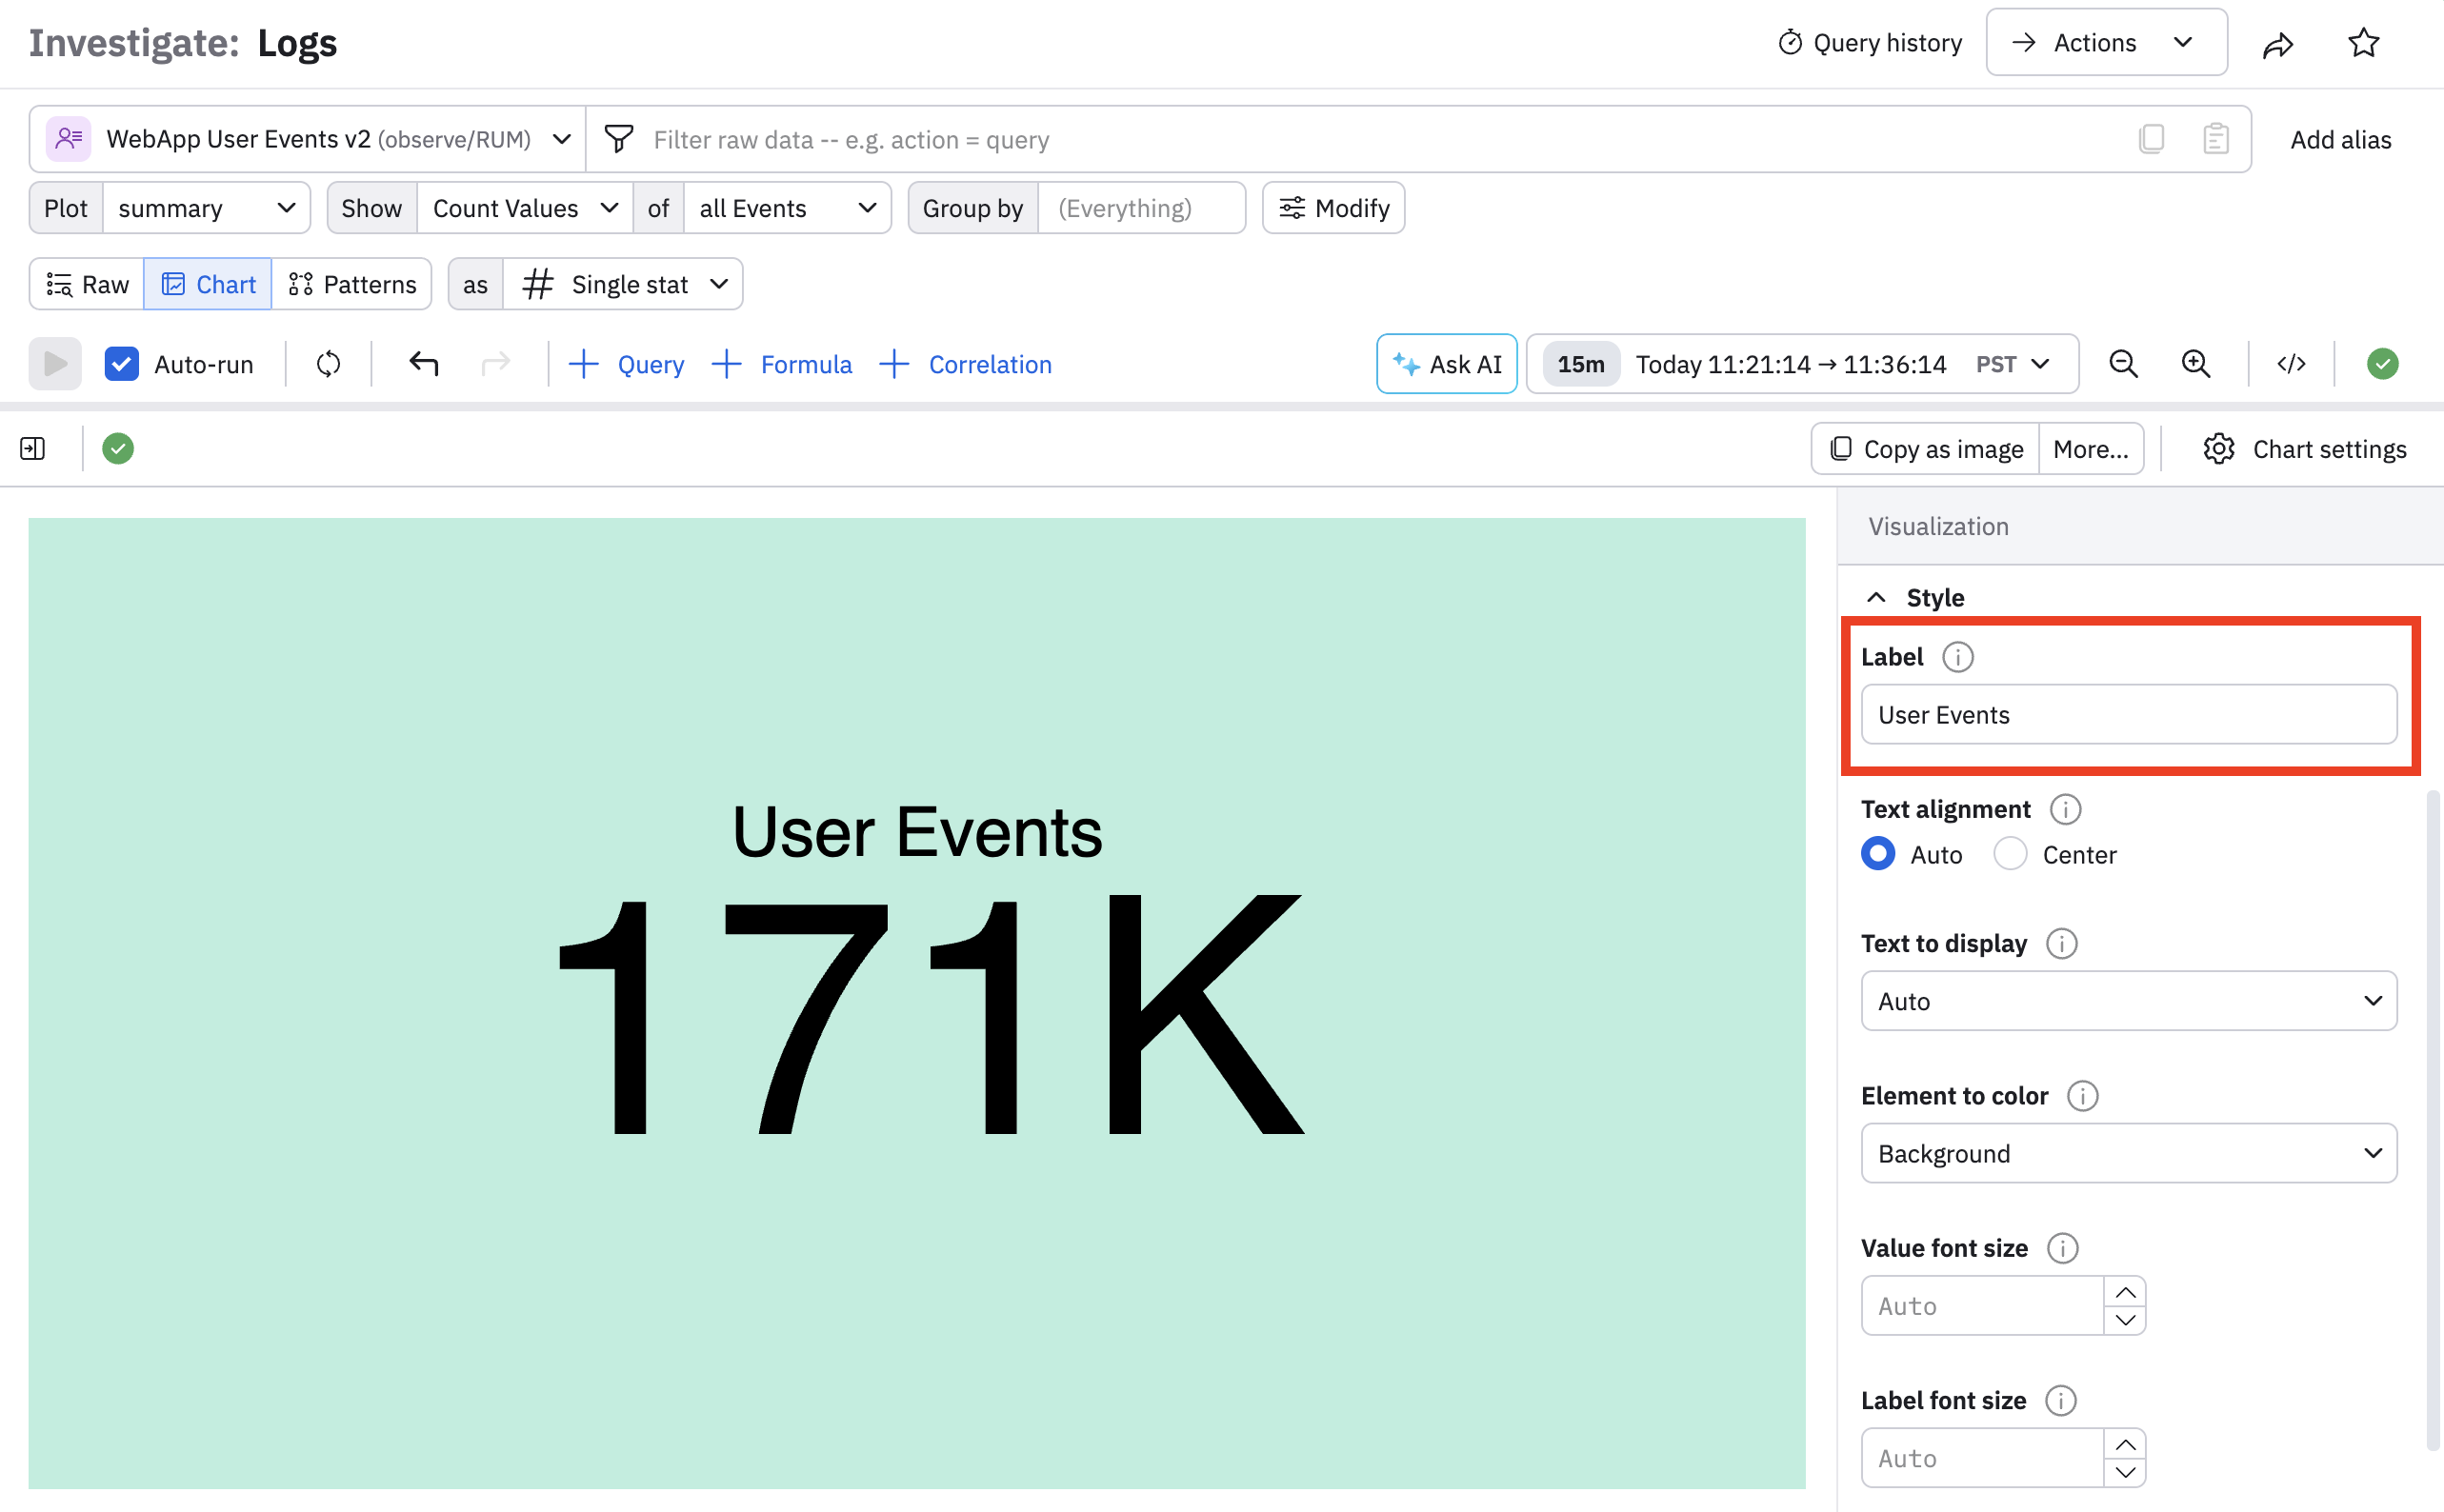
| Style | Some features available in this section include being able to provide a label, along with text alignment, color, and size options. |
| Colors | Specify color options. You can specify a single option, for the entire card, or color based on a threshold. |
In the example below, we add a label to the dashboard:
You can also use a single stat dashboard to use facets for multiple values. For example, if we want to group our total events by cluster, we can select clusterName from the Group by filter:
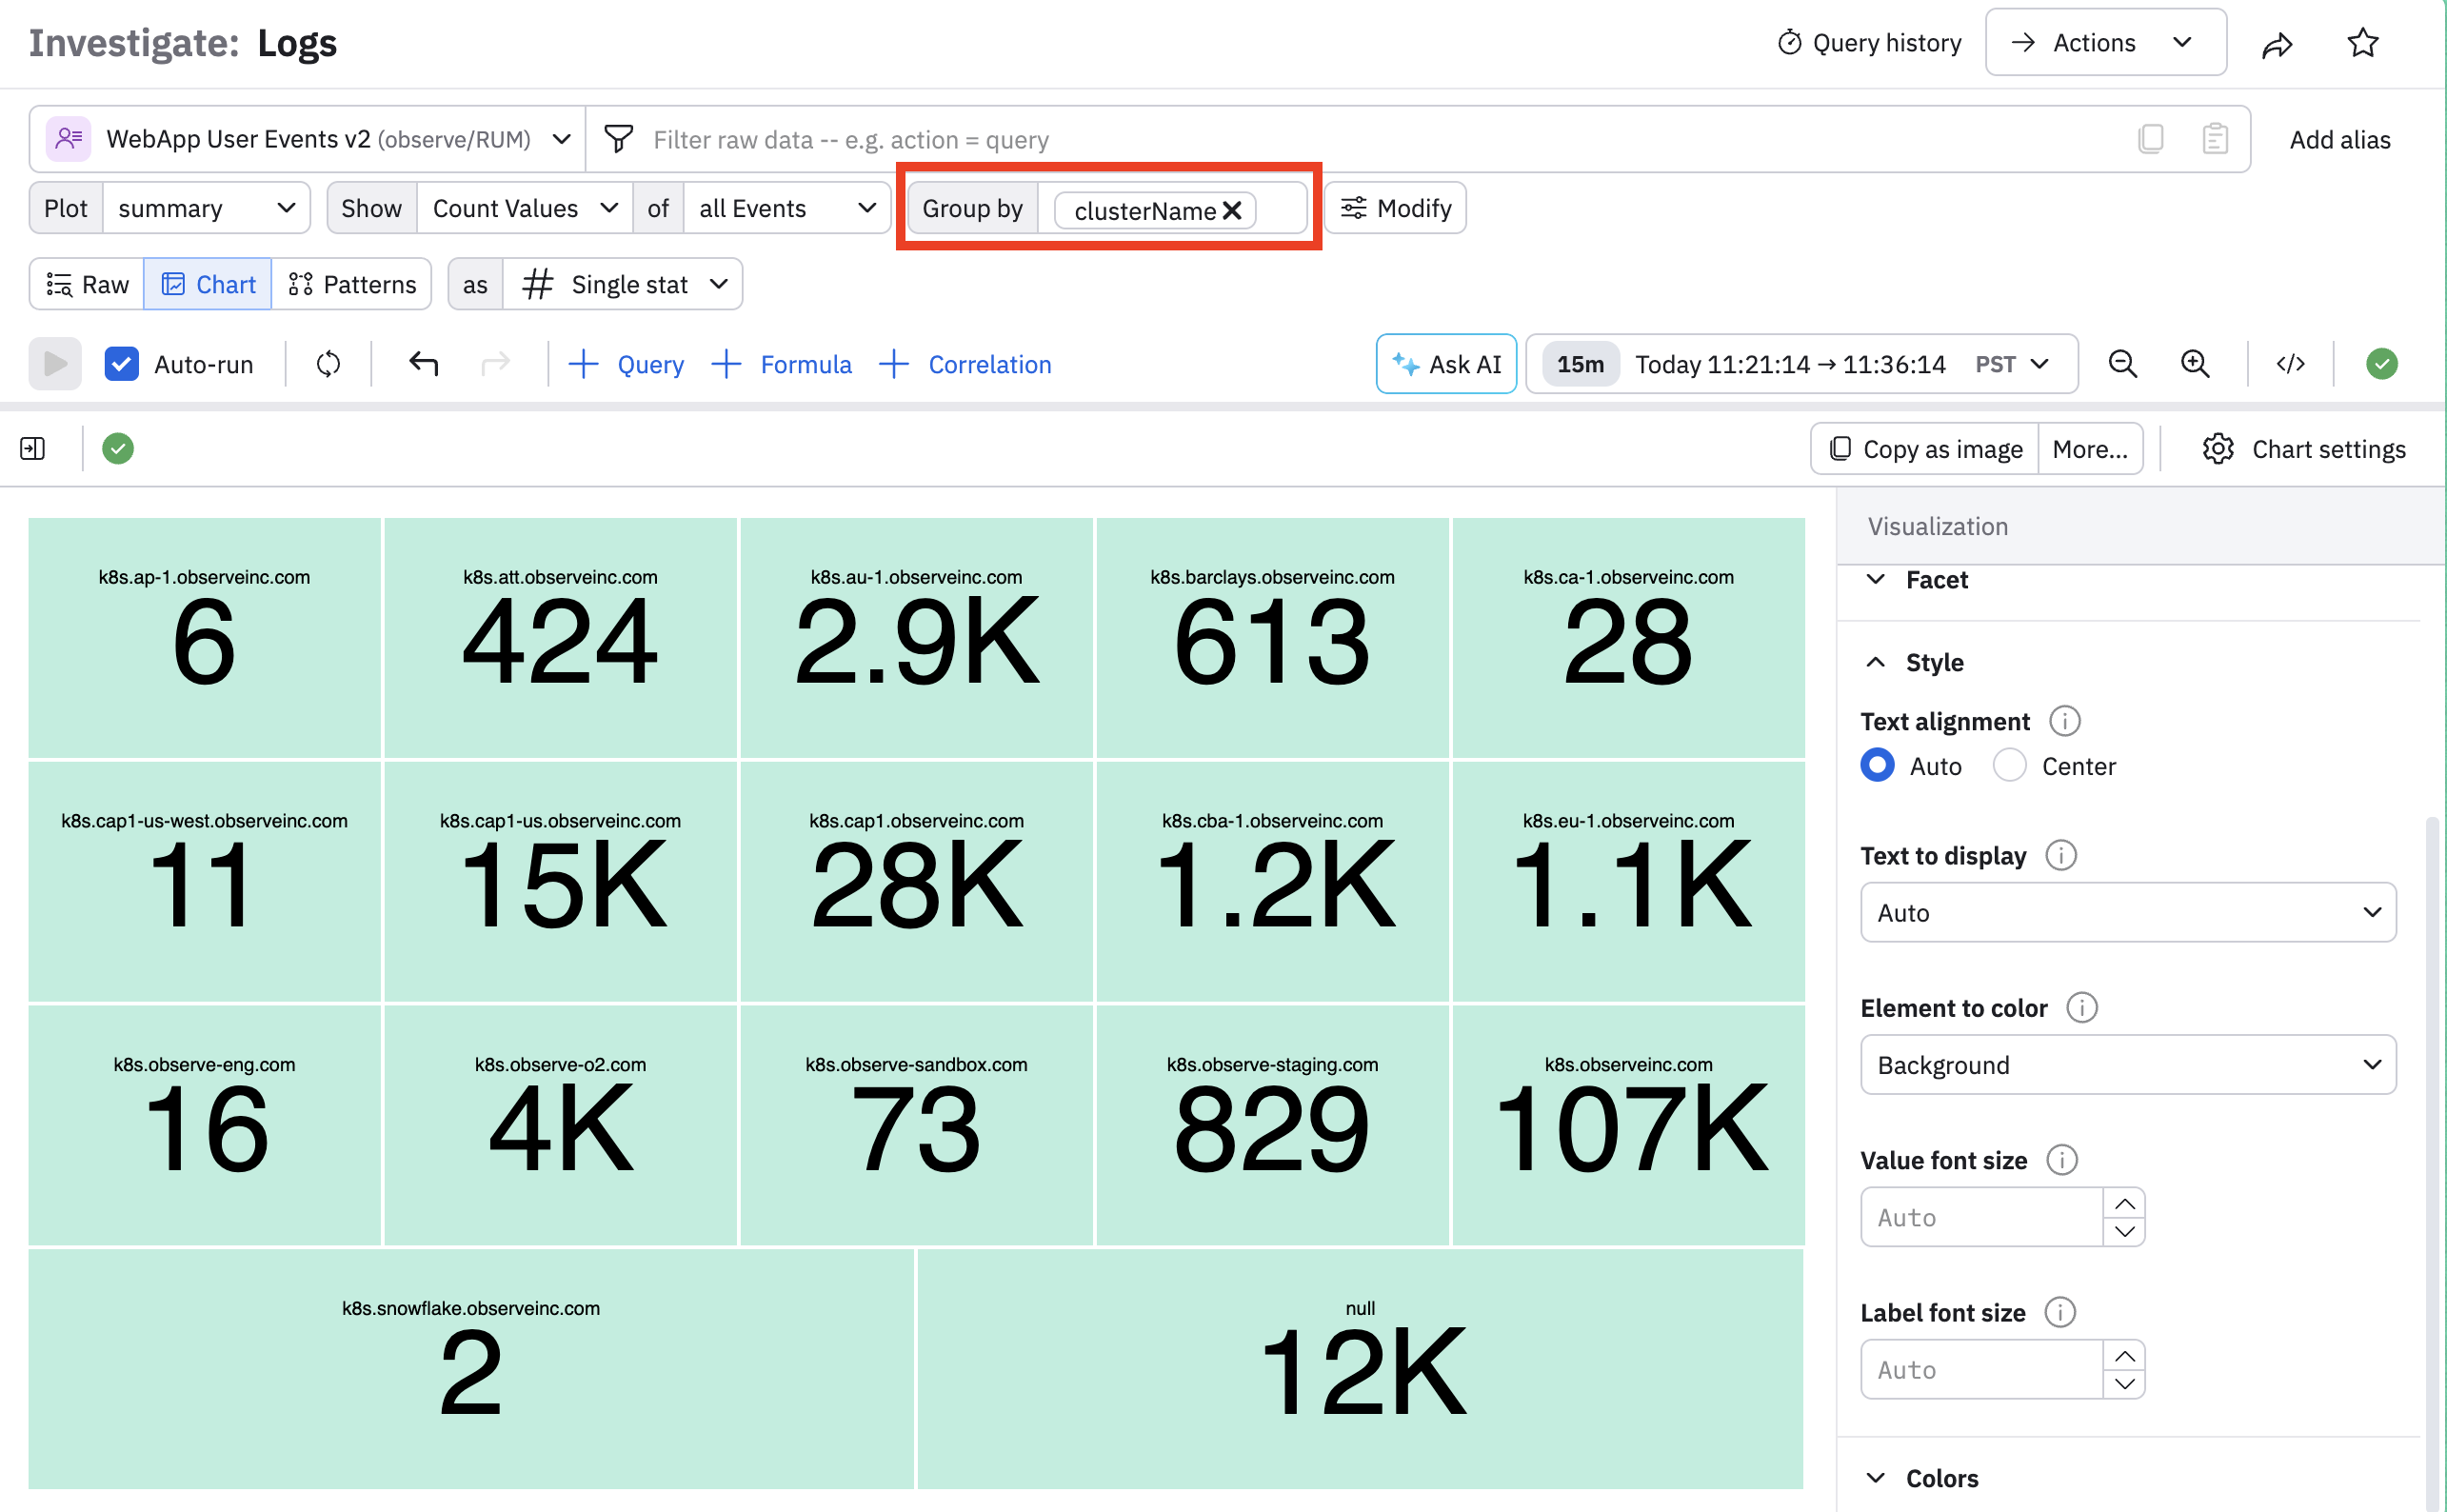
This gives us an additional setting called Facet, where you can sort by various metrics and also specify how many facets you want to see.
For example, suppose we only want to see the top five clusters, so we select the following:
- For Facet sorting, select Value descending.
- For Limit, enter 5.
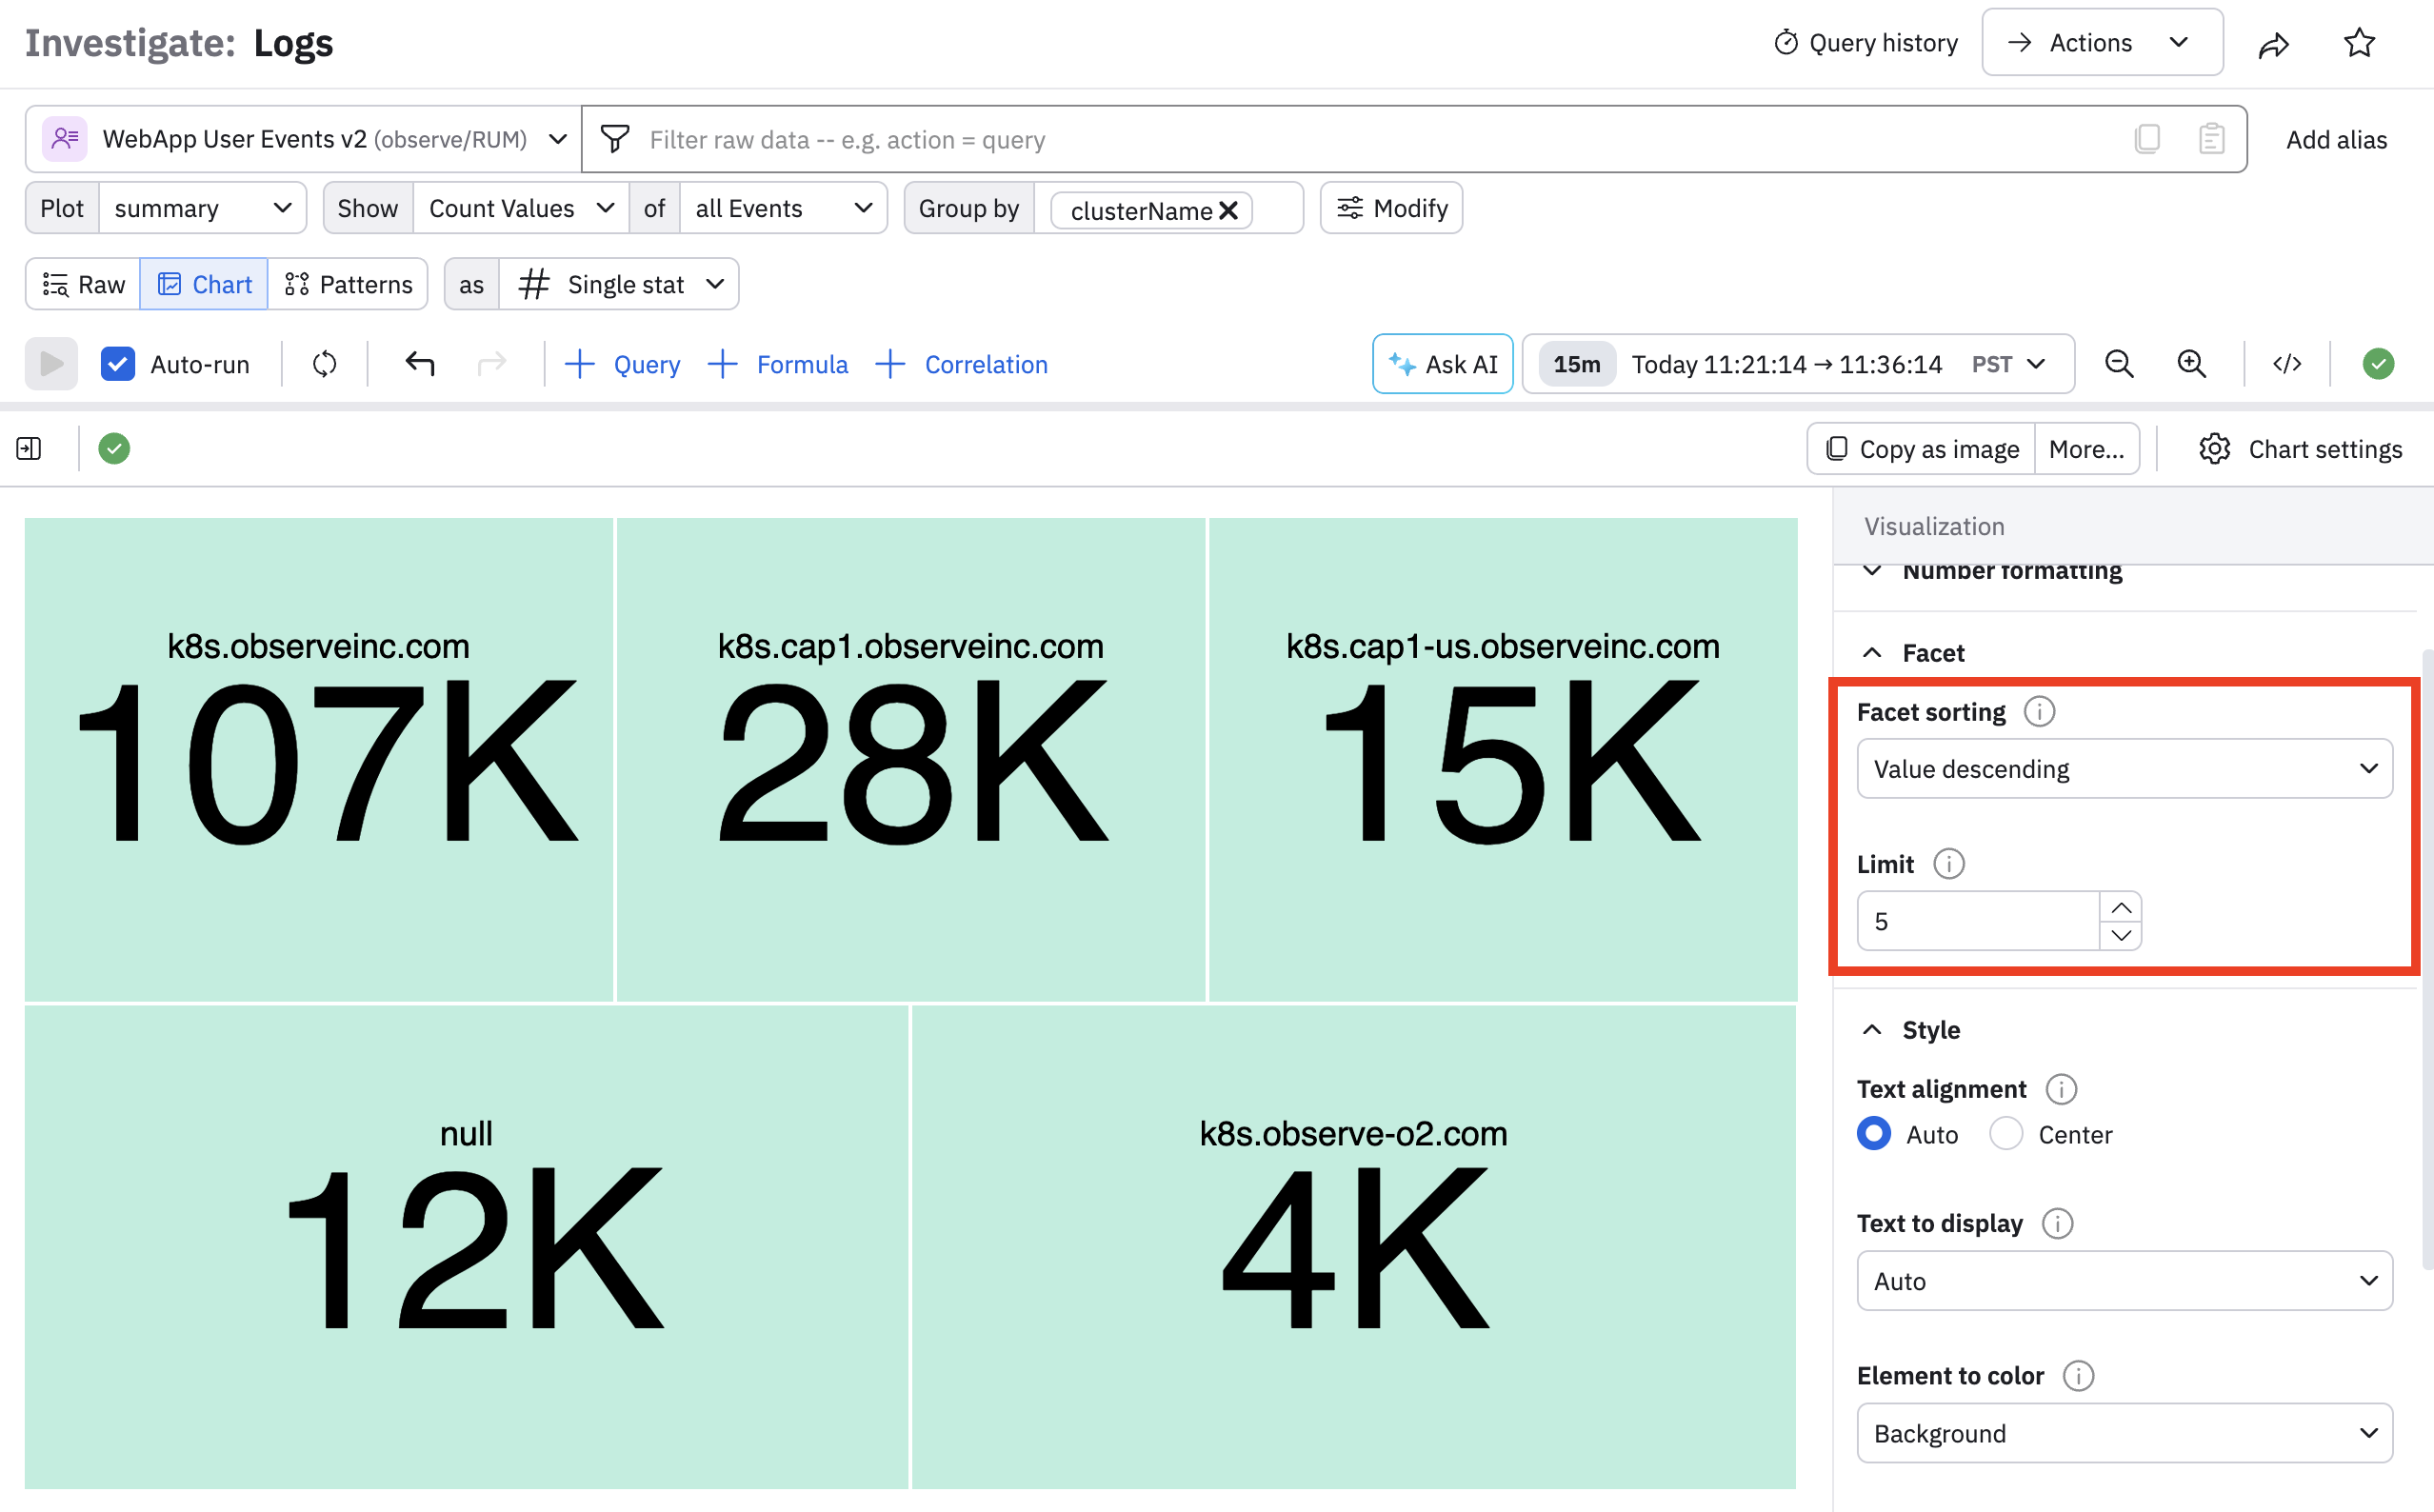
Note that the settings we applied previously are saved and applied to all facets, so since we added a label, each facet also includes a label.
You can also overlay your single stat dashboard on top of time-series data. In the Plot filter, select over time, and notice how time series data appears for each facet:
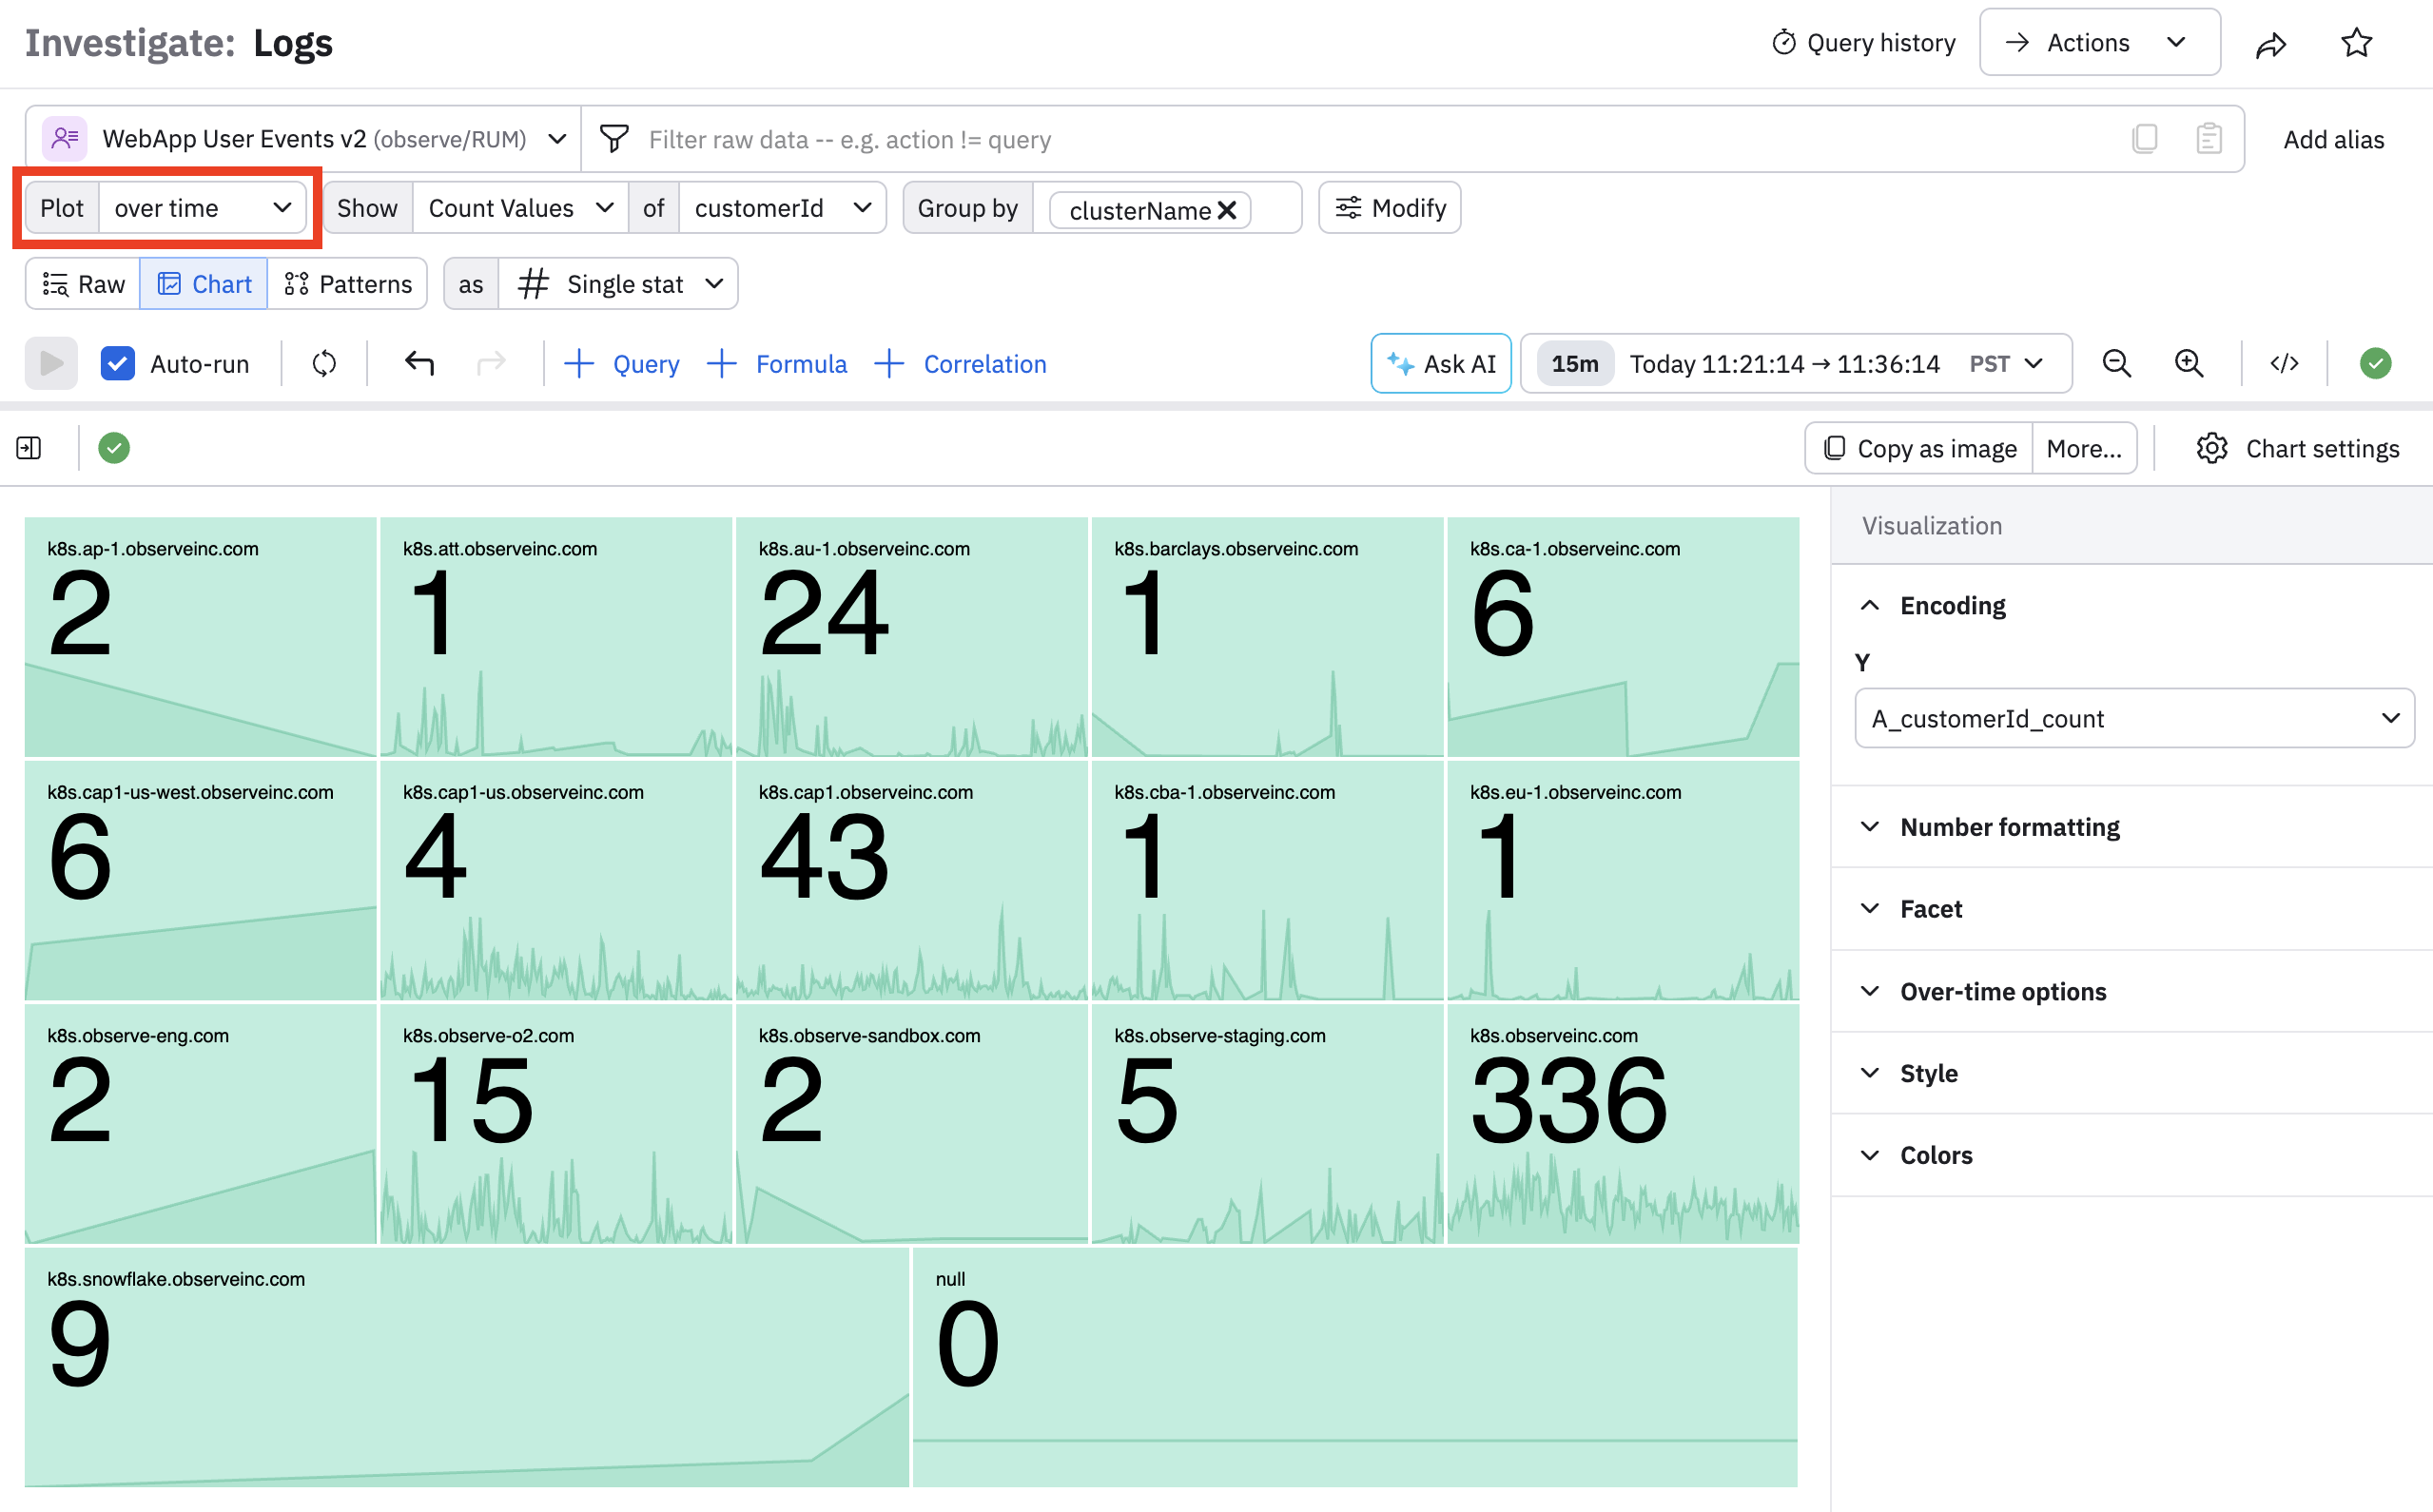
Notice that the labels and single stat value are moved to the upper left in each facet, for readability. You can customize this in the settings as desired.
Updated 5 months ago