Directed acyclic graph
Directed acyclic graphs (DAG) present a left-to-right graph of acyclic relationships between nodes so you can visualize relationships and groupings. This visualization works best with acyclic data, which is one-way data with no loops, as in the following examples:
| Data Type | Acyclic Example |
|---|---|
| Traces | Request flows across services |
| Spans | Parent → child relationships |
| Service dependencies | Frontend → backend → DB |
| Alerts | Trigger → notify → escalate |
| Metrics pipelines | Collect → aggregate → visualize |
| Logs pipelines | Emit → ingest → store → query |
| Infrastructure hierarchy | Cluster → node → pod |
| Root cause graphs | Cause → symptom → impact |
| Event correlation | Deployment → spike → incident |
Cyclic data can also be represented as a DAG, with its edges plotted as part of the layout of the graph.
Data modeling
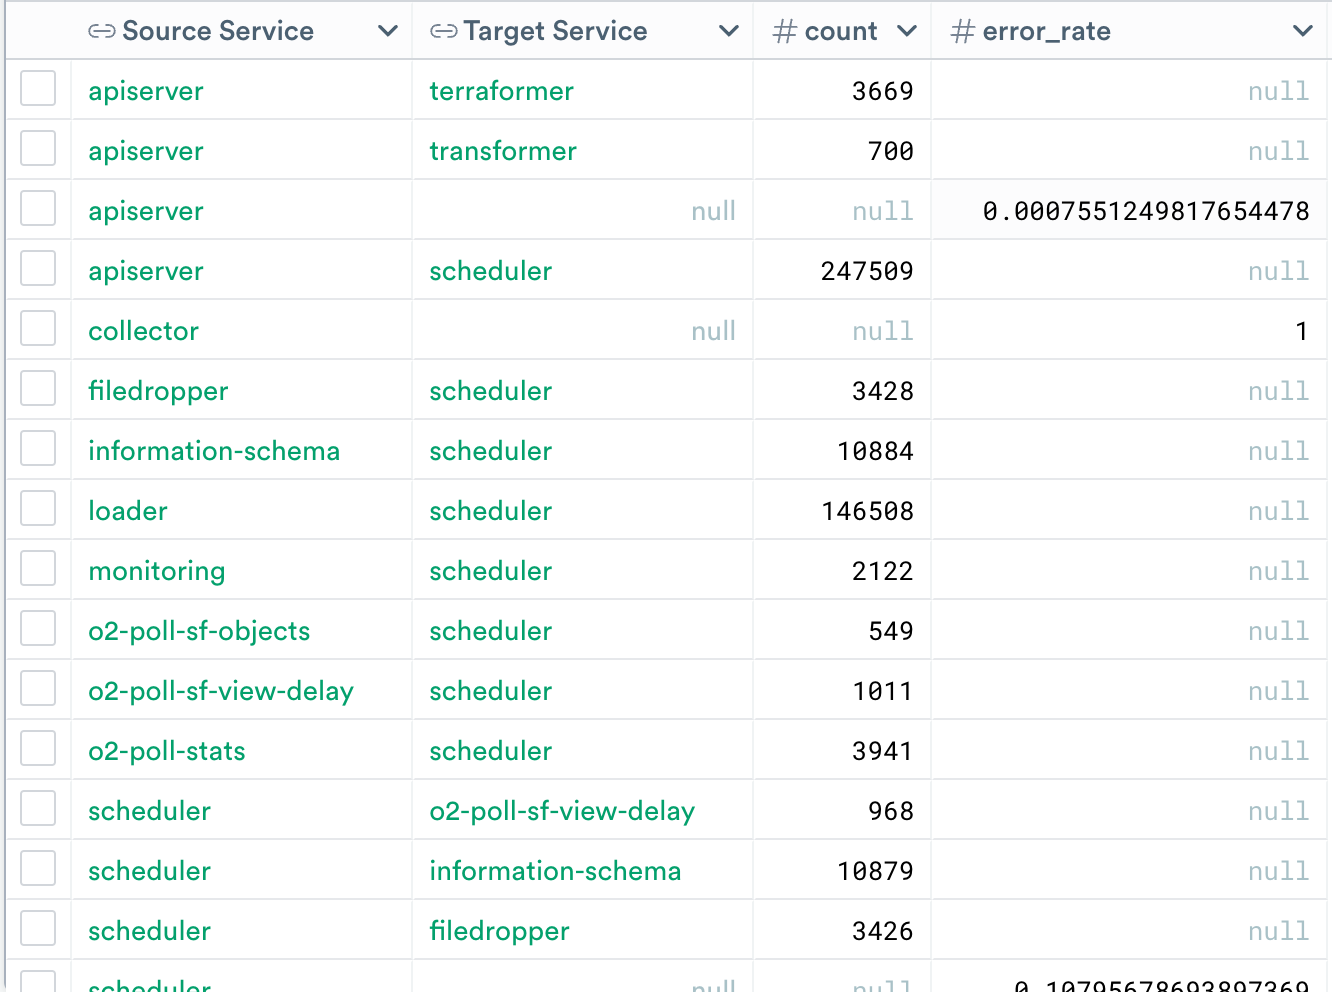
In order for your data to be represented in a DAG, it must have a source and destination column, called nodes. The relationships between nodes are called edges. In a DAG, nodes and edges can be labeled, color-coded, and sized by data-driven rules. In this example, we see a data source with a source and destination (target) service:
Your data modeling must observe the following conditions for valid nodes:
- If source field is null and destination field is non-null → row is ignored/invalid row.
- If source field is non-null and the destination field is null → row is a node row.
- If both source and destination fields are non-null → row is an edge row.
Node examples
Every non-null source cell is a node, and every non-null destination cell with a non-null source cell is a node. Some examples:
| Source and target description | How the row is treated |
|---|---|
NULL -X-> cart_service | This is an invalid node row (row is ignored). |
cart_server -> NULL | This is a valid node row (creates cart_server node). |
api_server -> terraformer | This is a valid node row (creates api_server and terraformer node) |
ad_service -> ad_service | This is a valid self-referencing node and is a valid node row (creates 1 ad_service node) |
Edge examples
Every non-null source or non-null destination row in the table is an edge. Some examples:
| Source and target description | How the row is treated |
|---|---|
NULL -X-> cart_service | This is an invalid edge row (row is ignored). |
cart_server -> NULL | This is an invalid edge row, but is a valid node row. |
api_server -> terraformer | This is a valid edge row. |
ad_service -> ad_service | This is a self-referencing node and is a valid edge row. |
Assign values to a node
To assign values to a node, the value must appear in a node row where the source is non-null and the destination is null. In the picture above, there are 3 node rows each with 2 values associated to their node:
| Node | count Value | error_rate value |
|---|---|---|
apiserver | null | 0.002 |
collector | null | 0 |
monitoring | null | 0 |
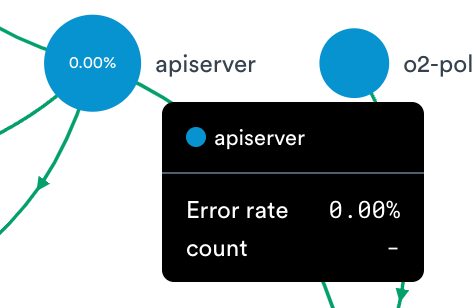
If we were to assign these columns to be displayed in the tooltip, it would look as such:
Assign values to an edge
To assign values to an edge, the values must appear in an edge row where the source is non-null and the destination is non-null. In the picture above, there are 8 edge rows each with 2 values associated to their edge:
| Edge | count Value | error_rate value |
|---|---|---|
apiserver → scheduler | 251648 | null |
apiserver → terraformer | 4274 | null |
apiserver → monitoring | 15 | null |
apiserver → transformer | 1084 | null |
filedropper → scheduler | 3441 | null |
information-schema → scheduler | 10846 | null |
loader → scheduler | 154801 | null |
monitoring → scheduler | 2817 | null |
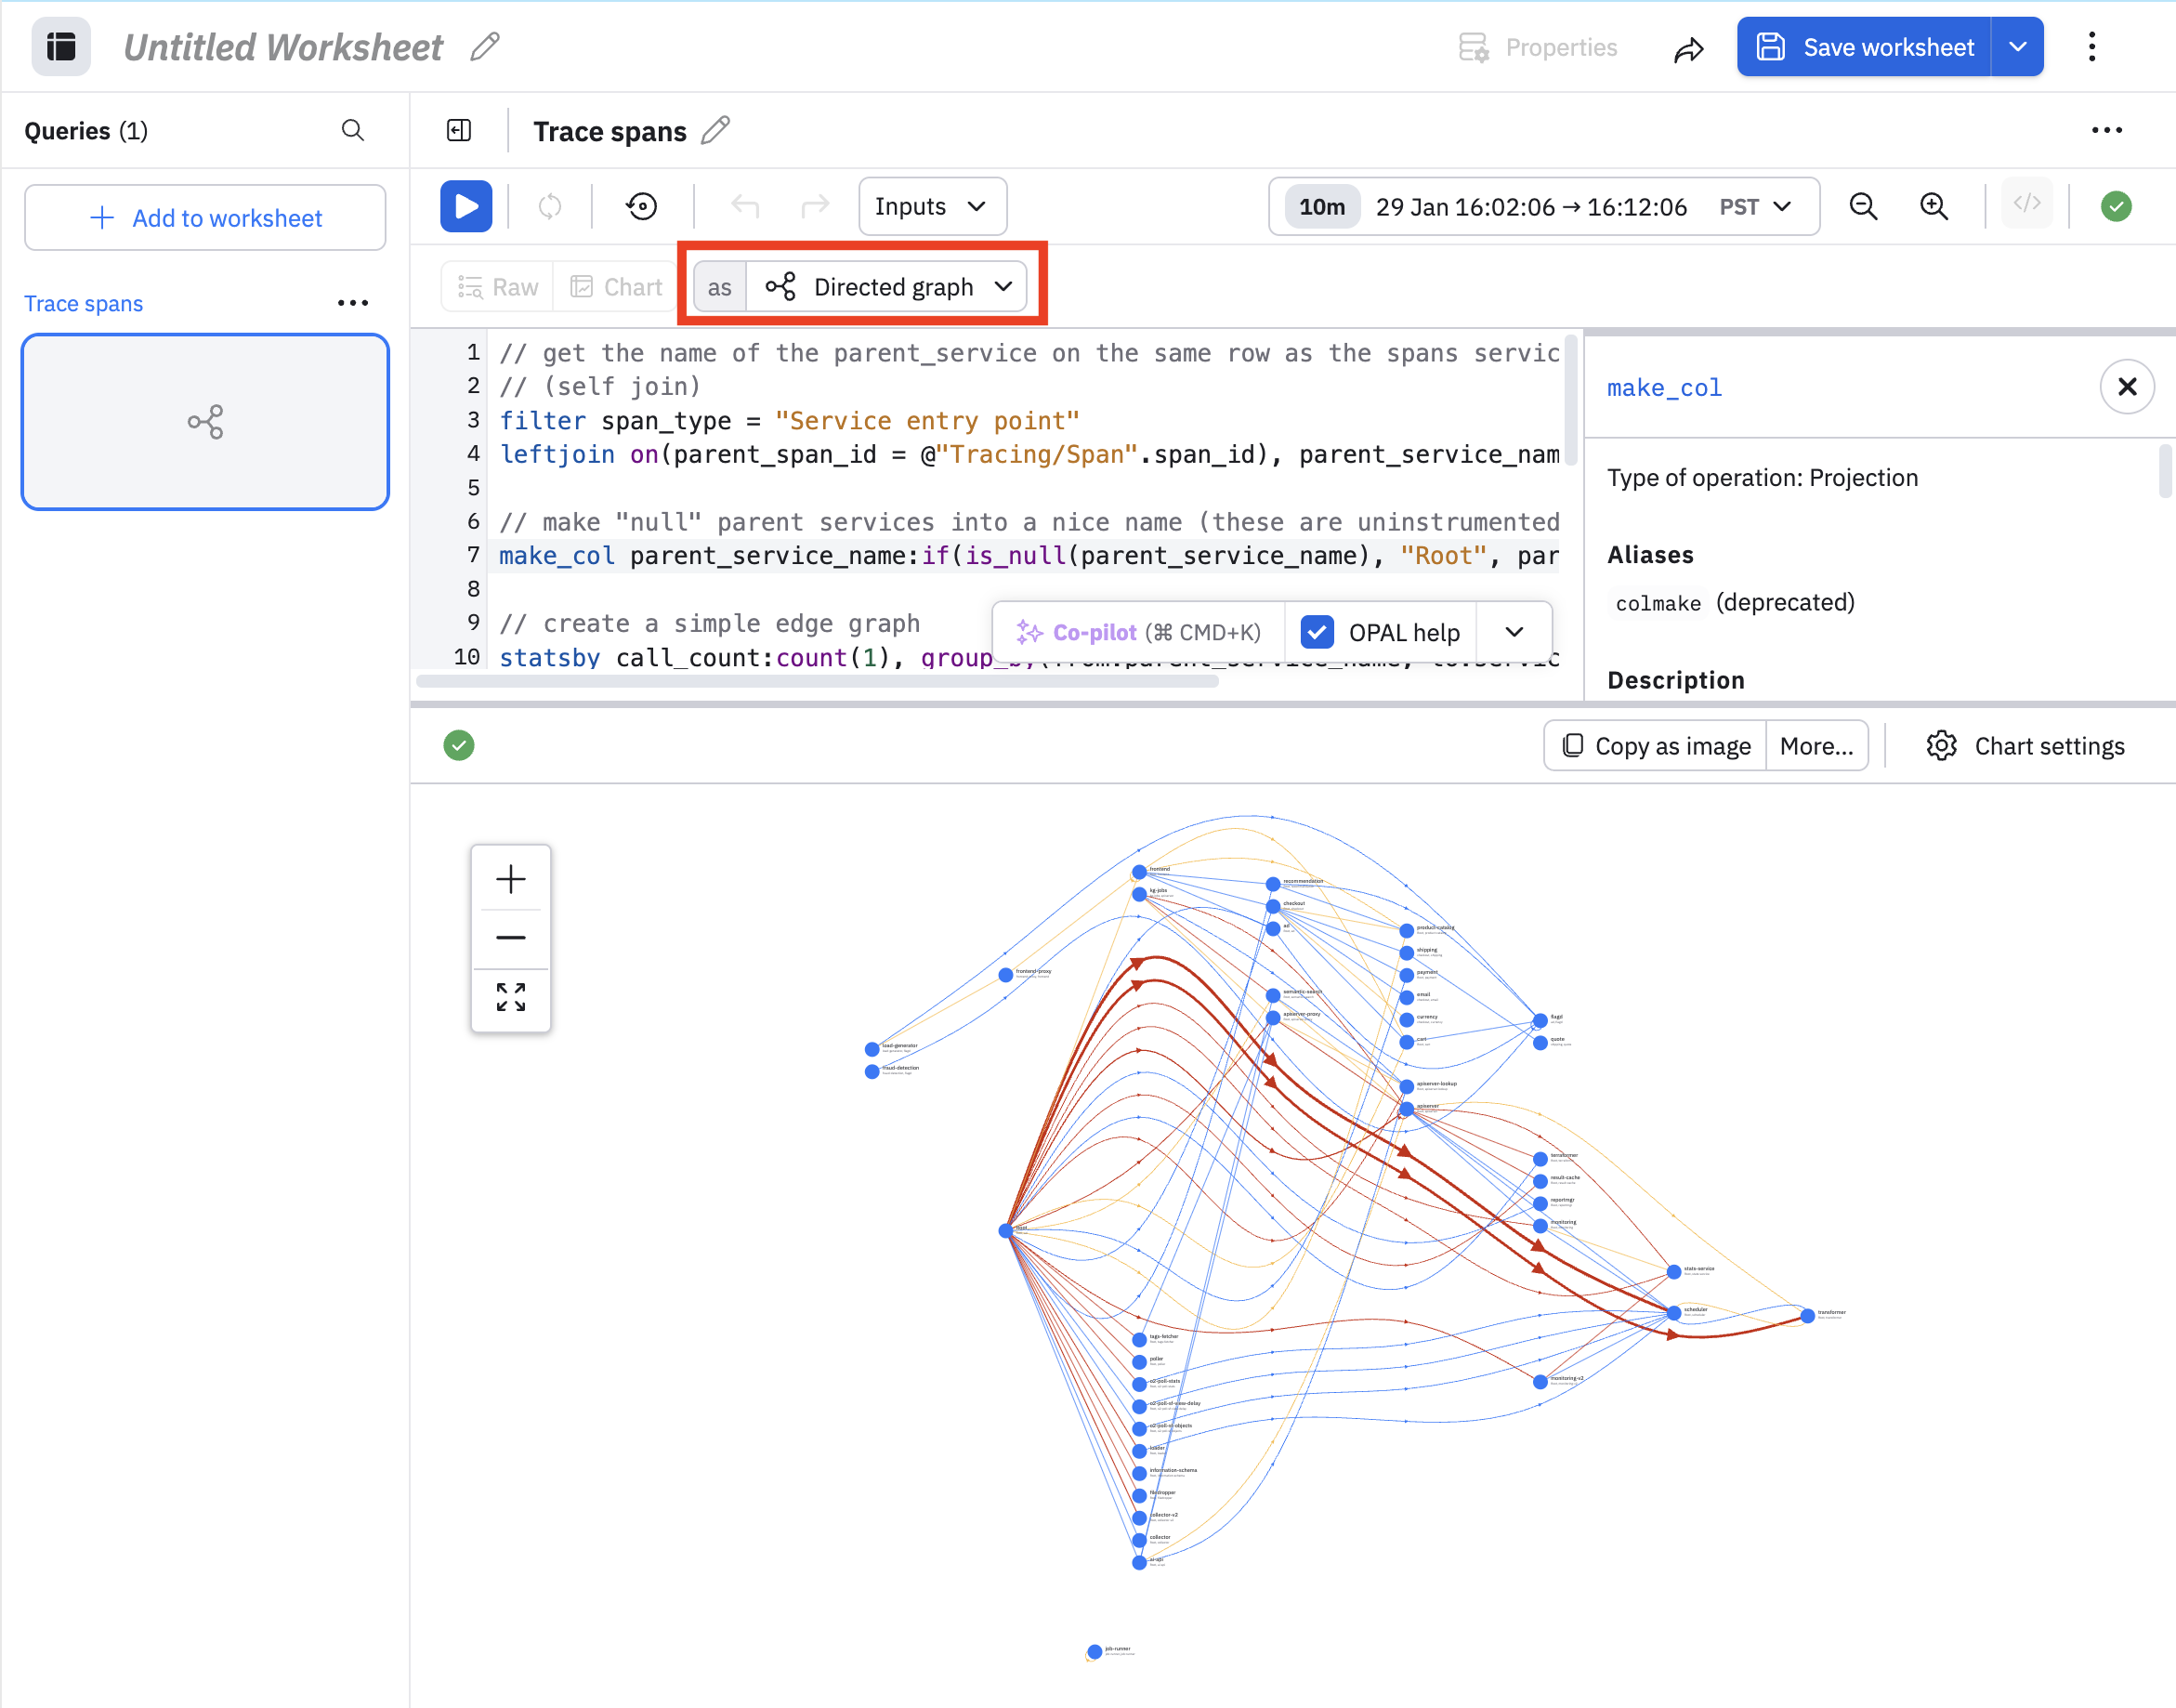
View a directed acyclic graph
To view a DAG, access the log or Worksheet and select Directed graph as the chart type. Here is an example from a Worksheet:
Click Chart settings, then Settings to see the source and destination fields:
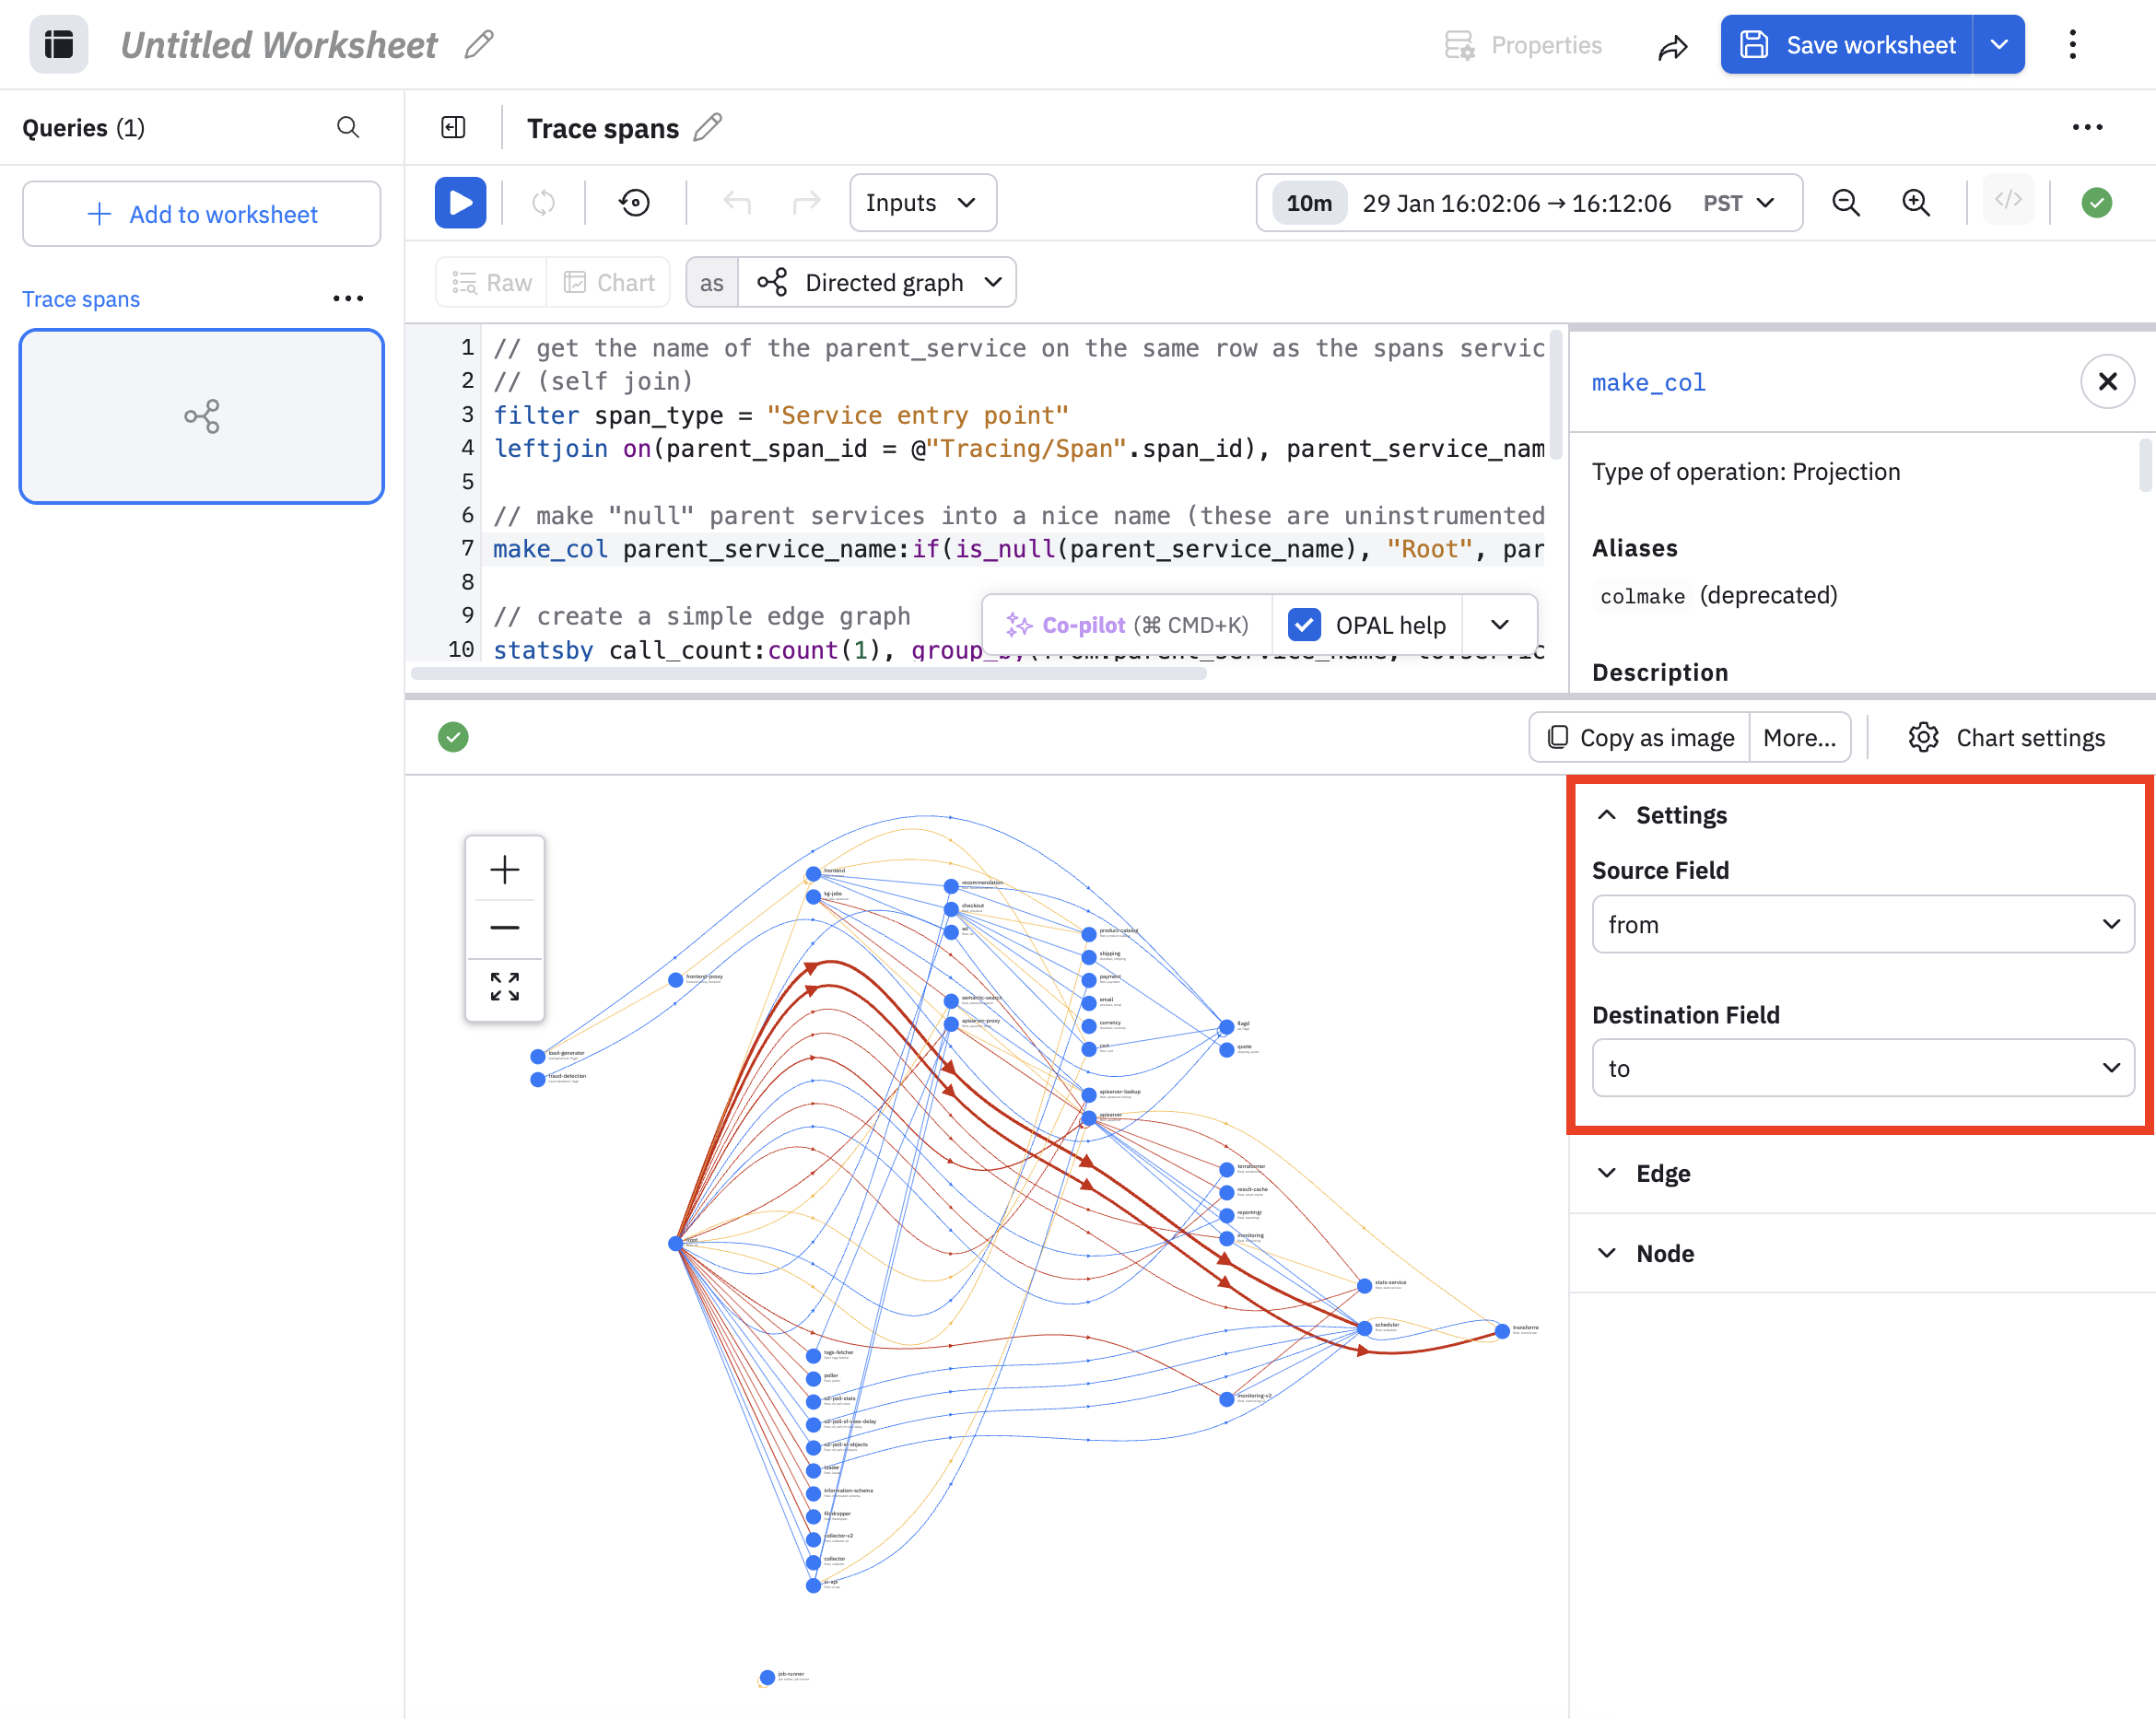
You can further refine the graph by expanding the Edge and Node panels in the Settings panel.
Customize the edges in your DAG
Expand the Edge panel to customize the tooltip content when you hover on an edge, the label for each edge, and the edge colors.
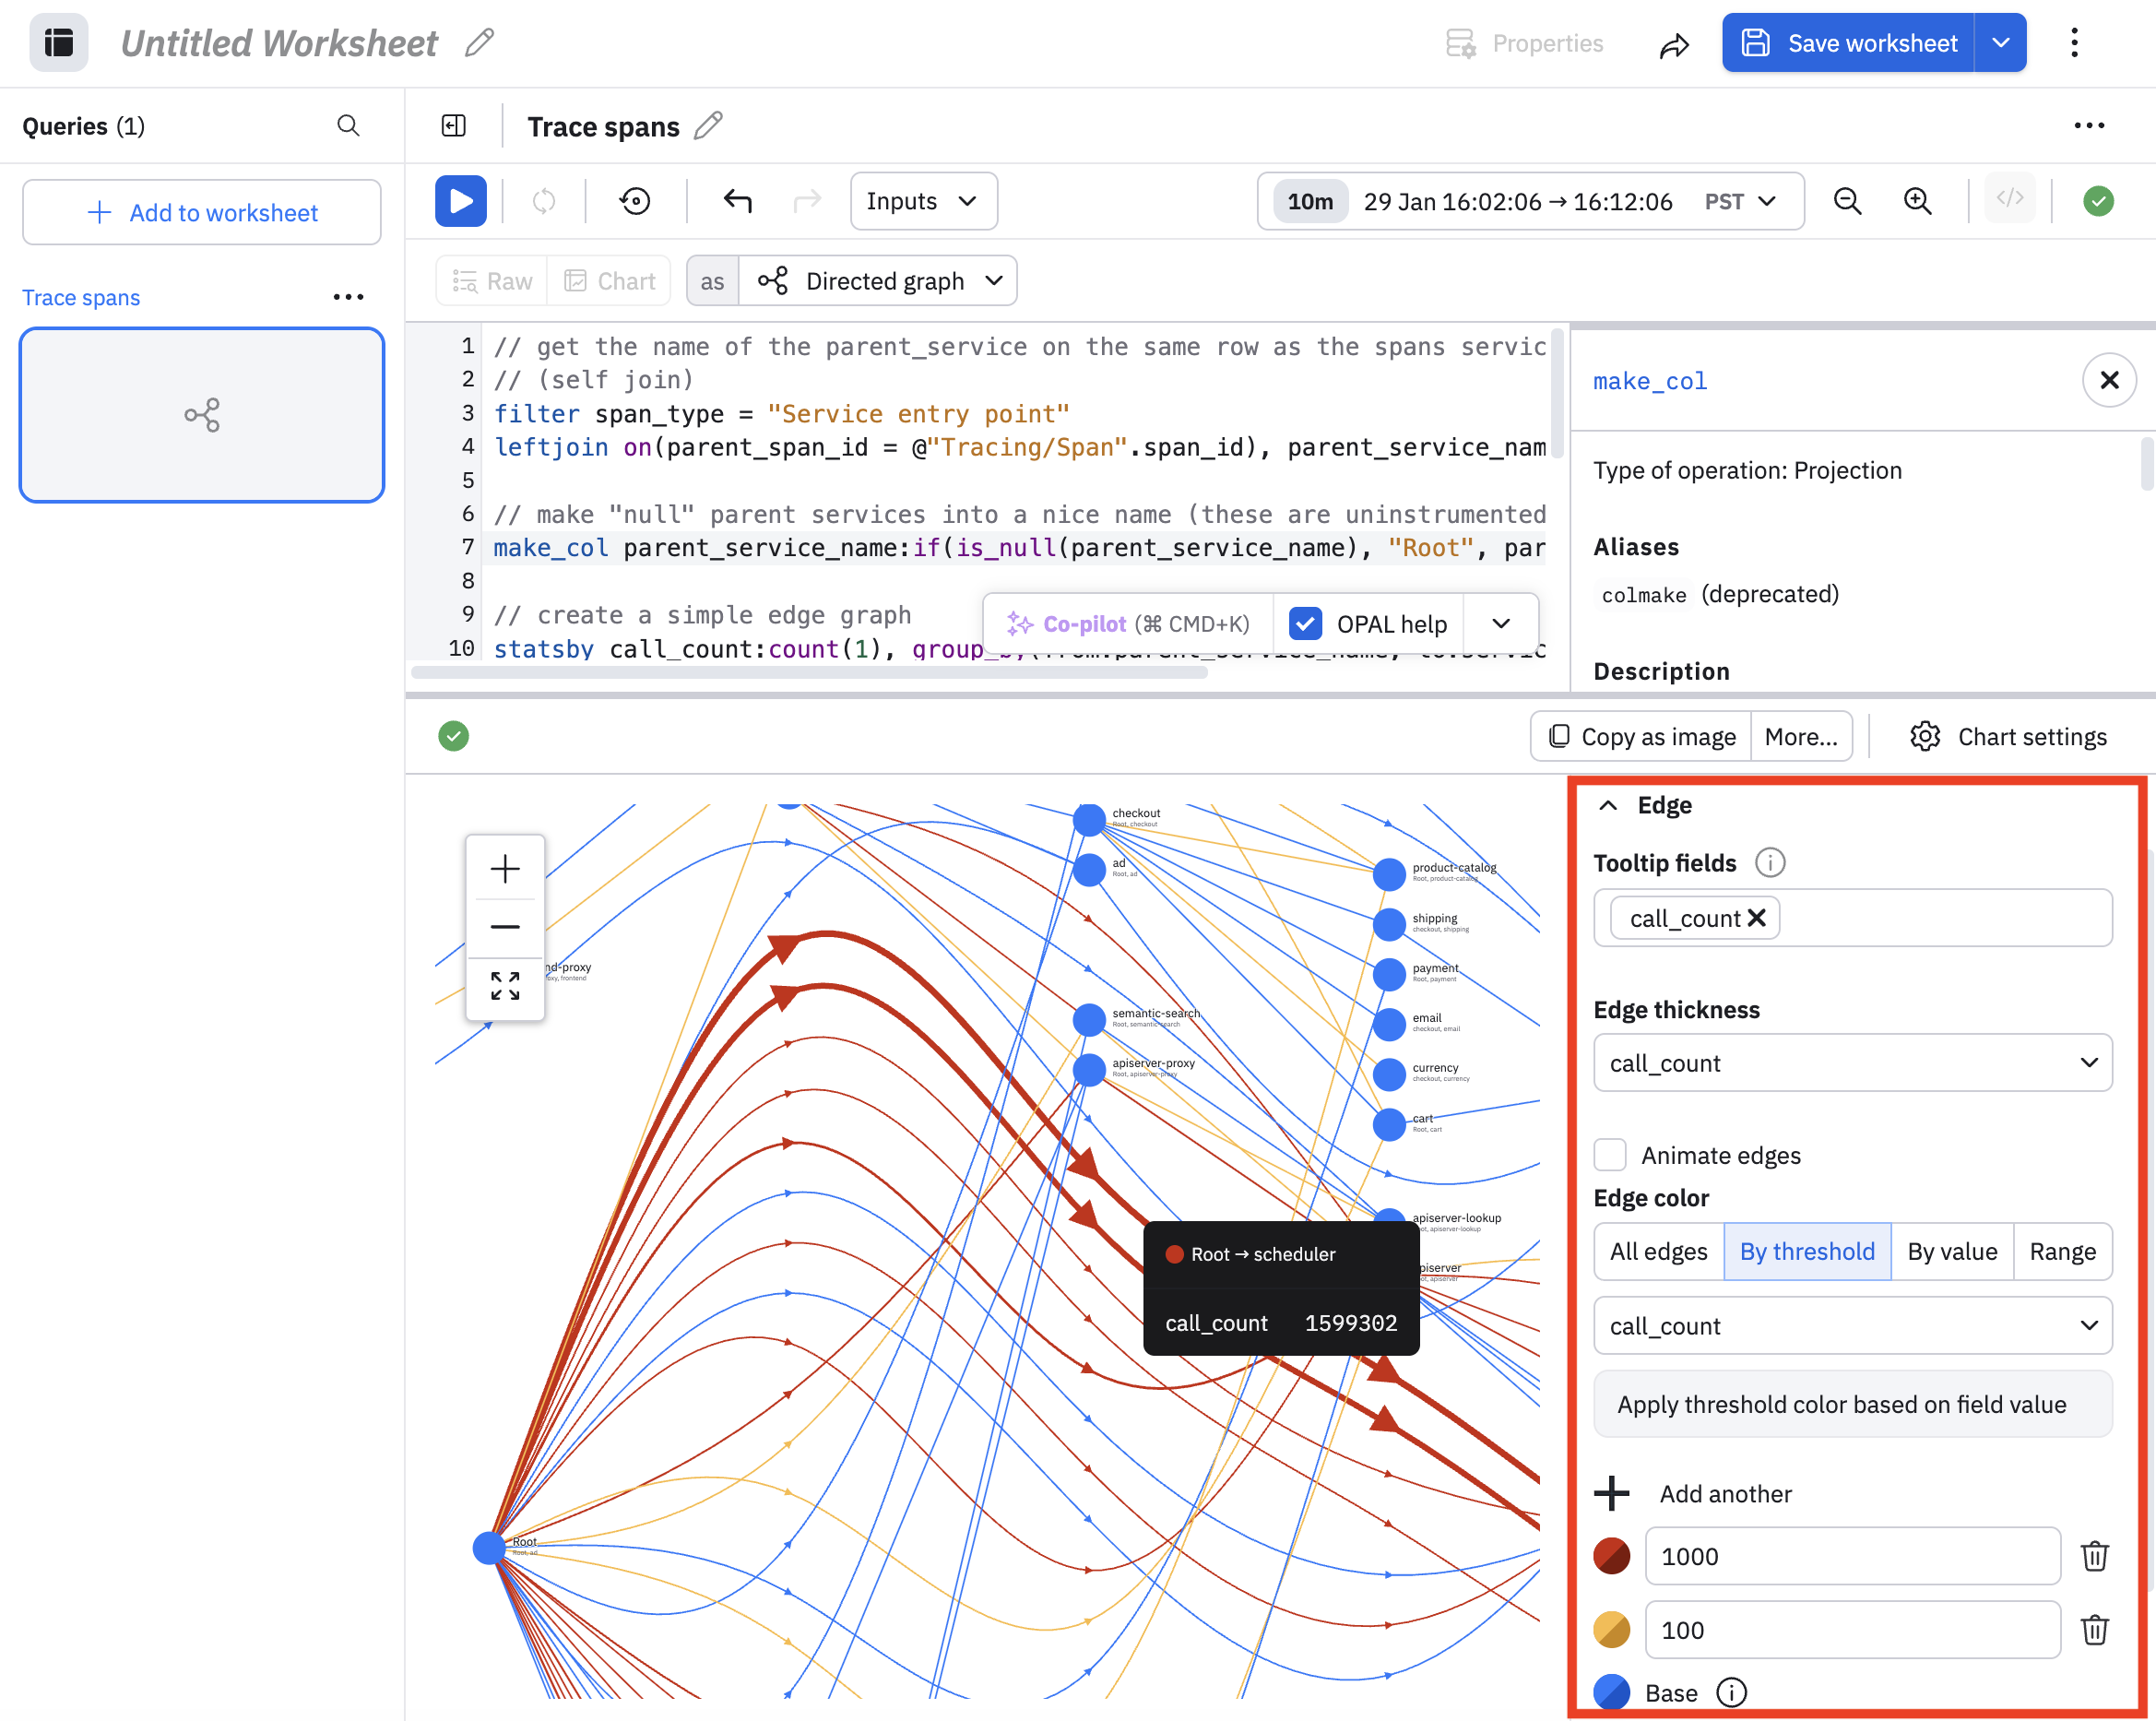
In this example, we have configured the following:
- Use the call_count value to determine the thickness of each edge.
- Configure the color of the edges. If the call_count is 100o or more, then use red. If the call_count is between 100 and 999, use yellow. Otherwise, use blue, which is the base color.
You can see the thicker red lines in the example, indicating that the call_count is greater than 1000. Use the Tooltip Fields to configure what you see in the tooltip when you hover on any edge. By default, each tooltip shows the source and destination fields. In this example, we also added the call_count.
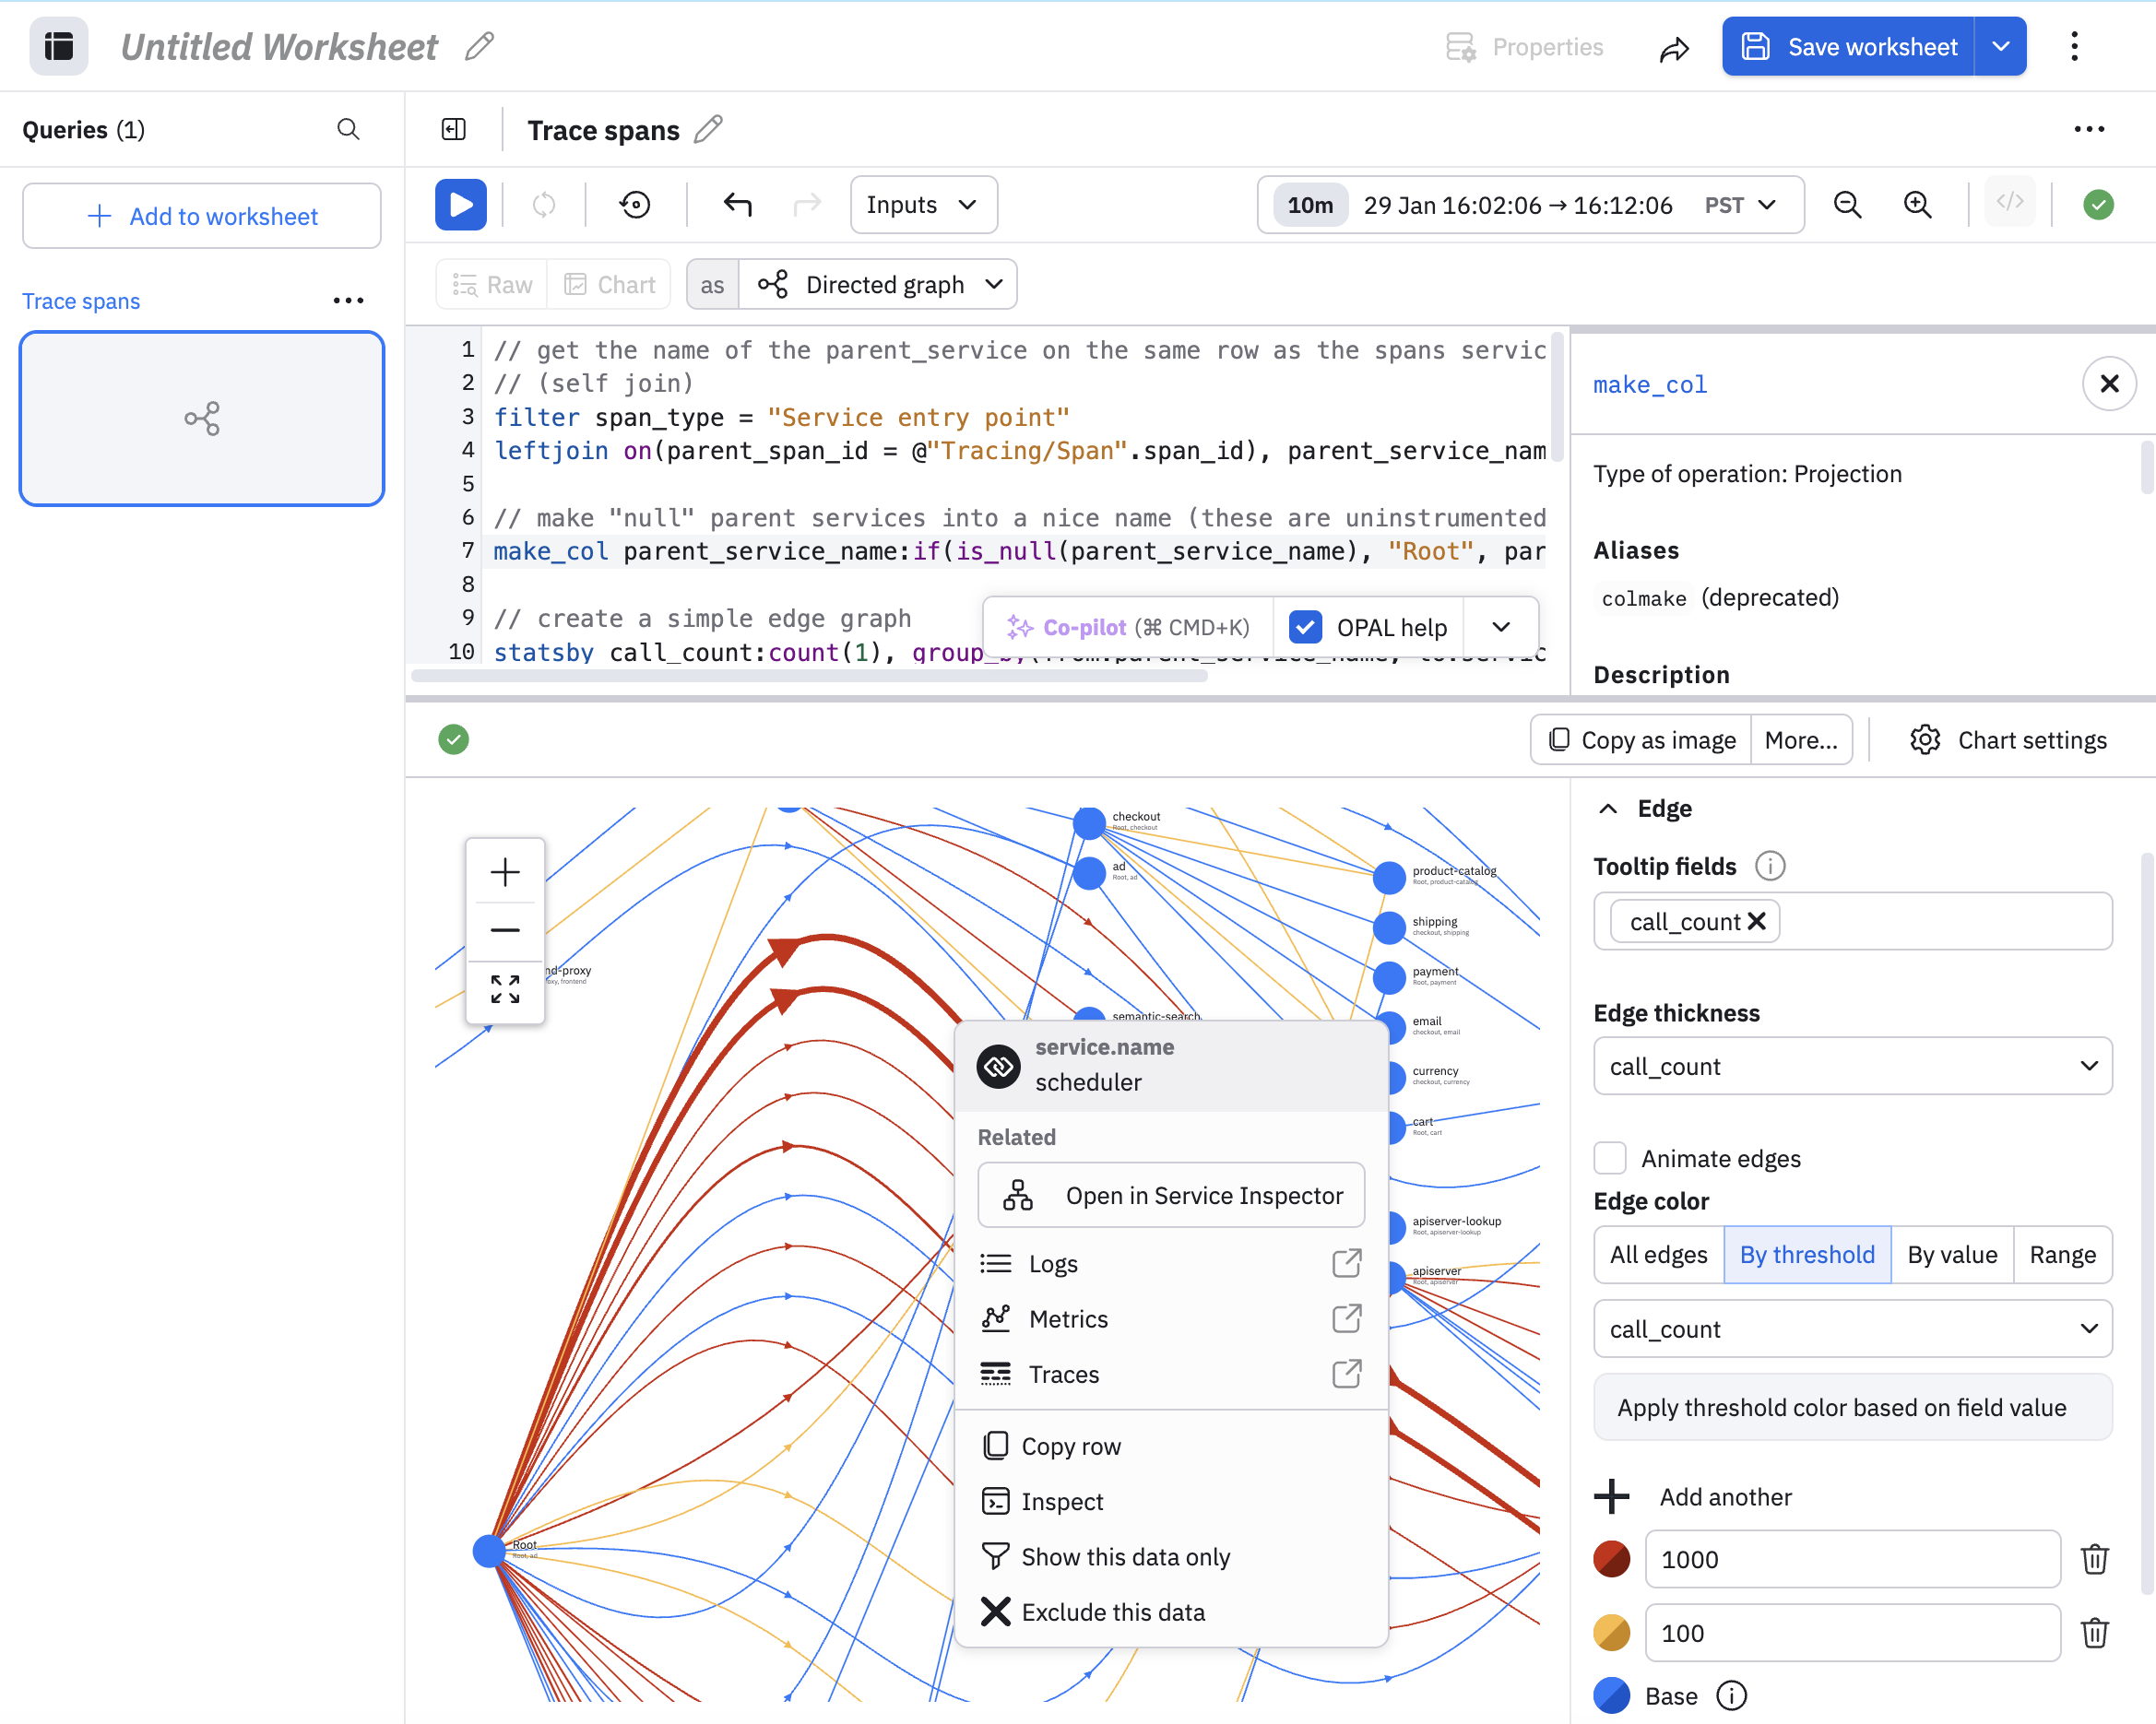
You can click on any edge to pivot and investigate further. The following example shows the pivots available for logs, metrics, and traces. You can also click Open in Service Inspector to go to the Service Explorer.
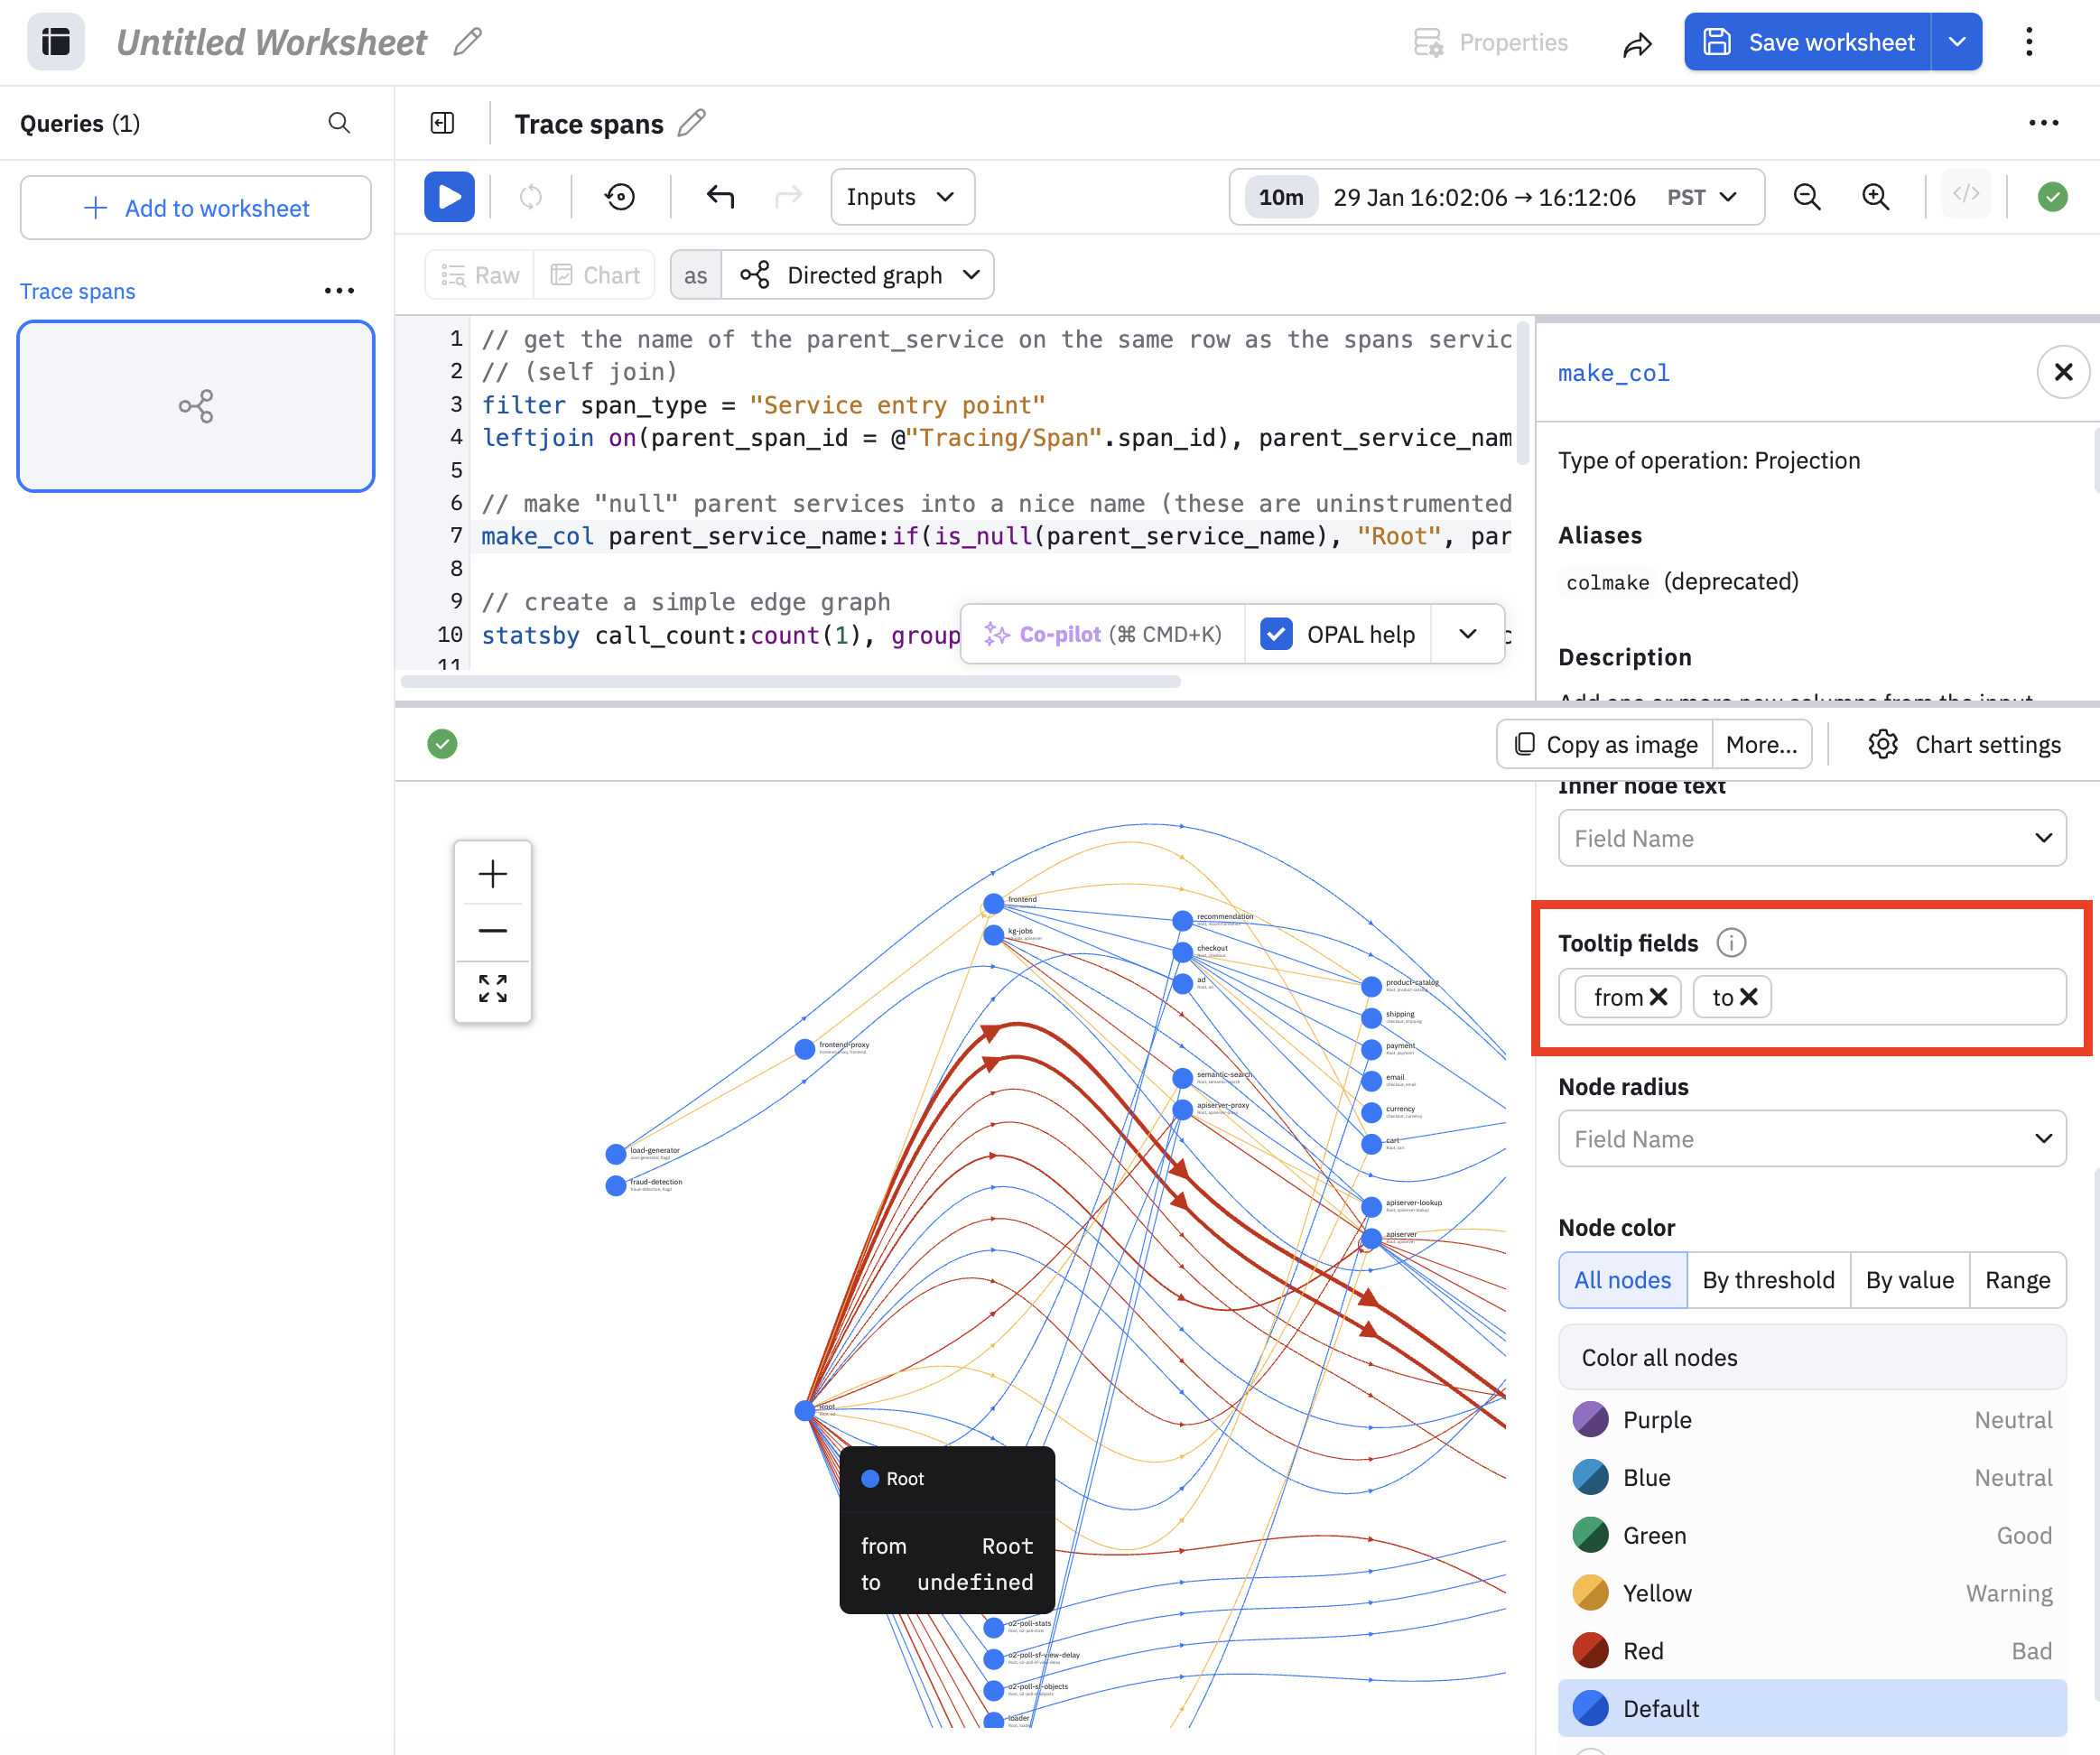
Customize the nodes in your DAG
Expand the Node panel to customize the nodes in your DAG, such as color, full, text placement, and tooltip content. In this example, we added the from and to fields to the tooltip when you hover on a node:
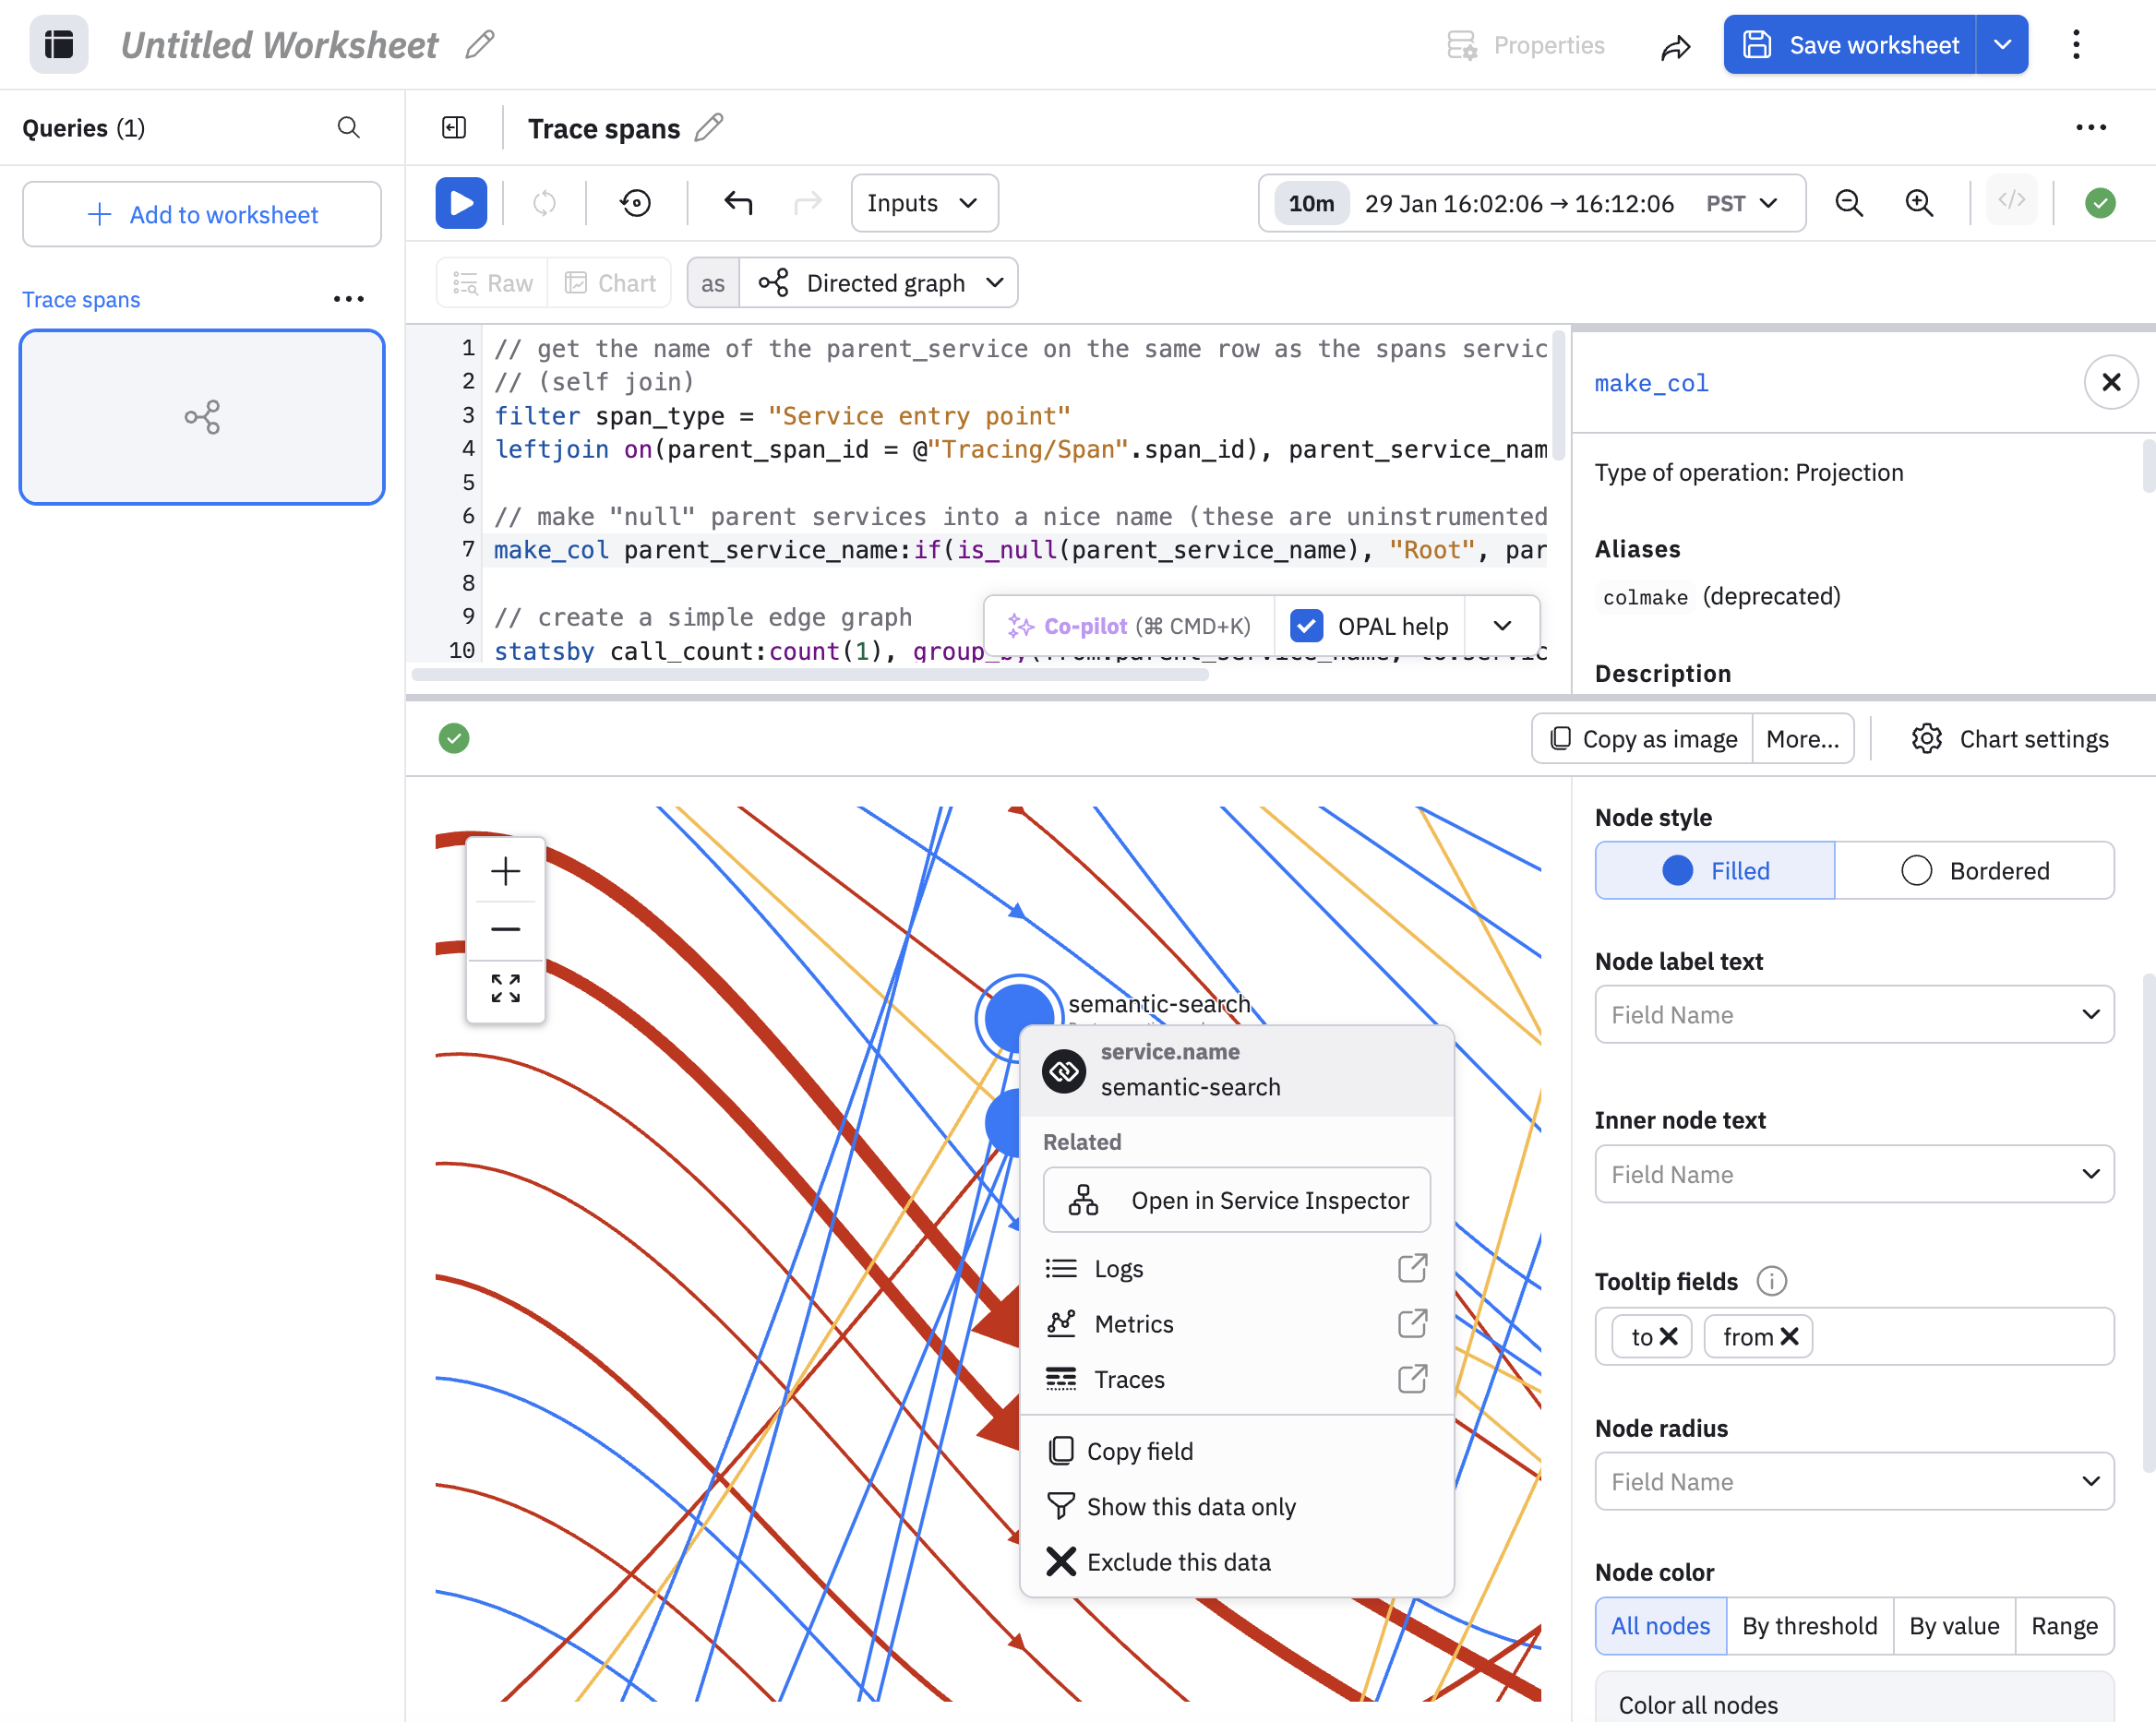
Like edges, you can click on any node to pivot to logs, metrics, and traces, or click Open in Service Inspector to go to the Service Explorer.
Updated 5 months ago