Create a single-stat dashboard
This tutorial steps you through creating a simple Dashboards using Observe. Dashboards help you visualize and interpret your data.
Explore dashboards
Click Dashboards in the navigation bar to open the landing page for dashboards.
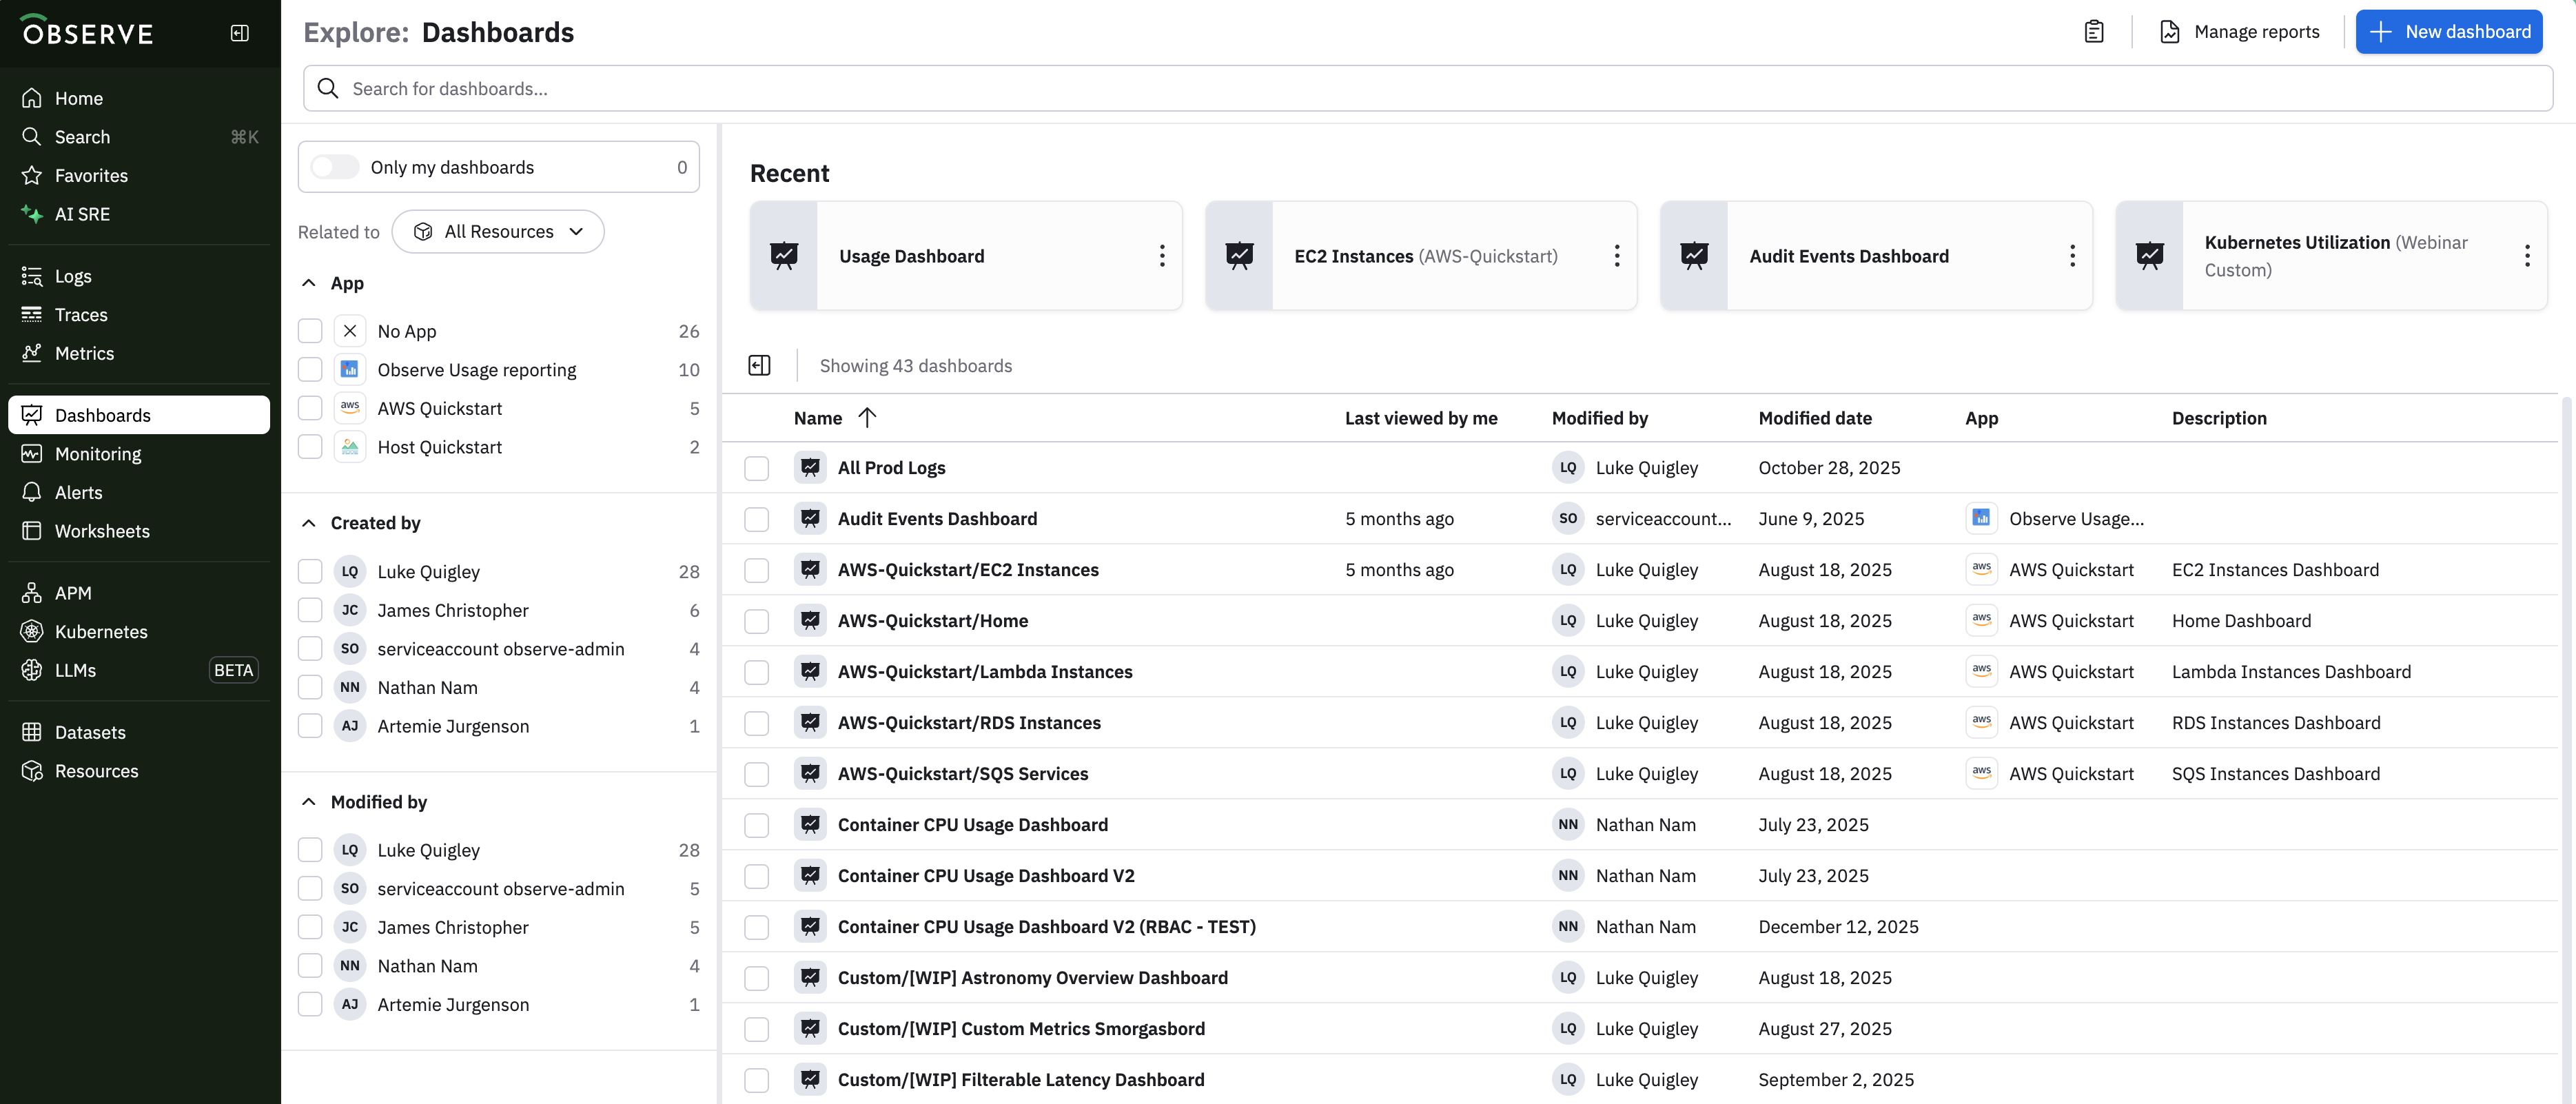
To locate a specific dashboard, enter text into the Search for dashboards... field to display a list of dashboards matching that text. To create a new dashboard, click New dashboard.
Get started with dashboards
Let's start creating your first dashboard using the following steps:
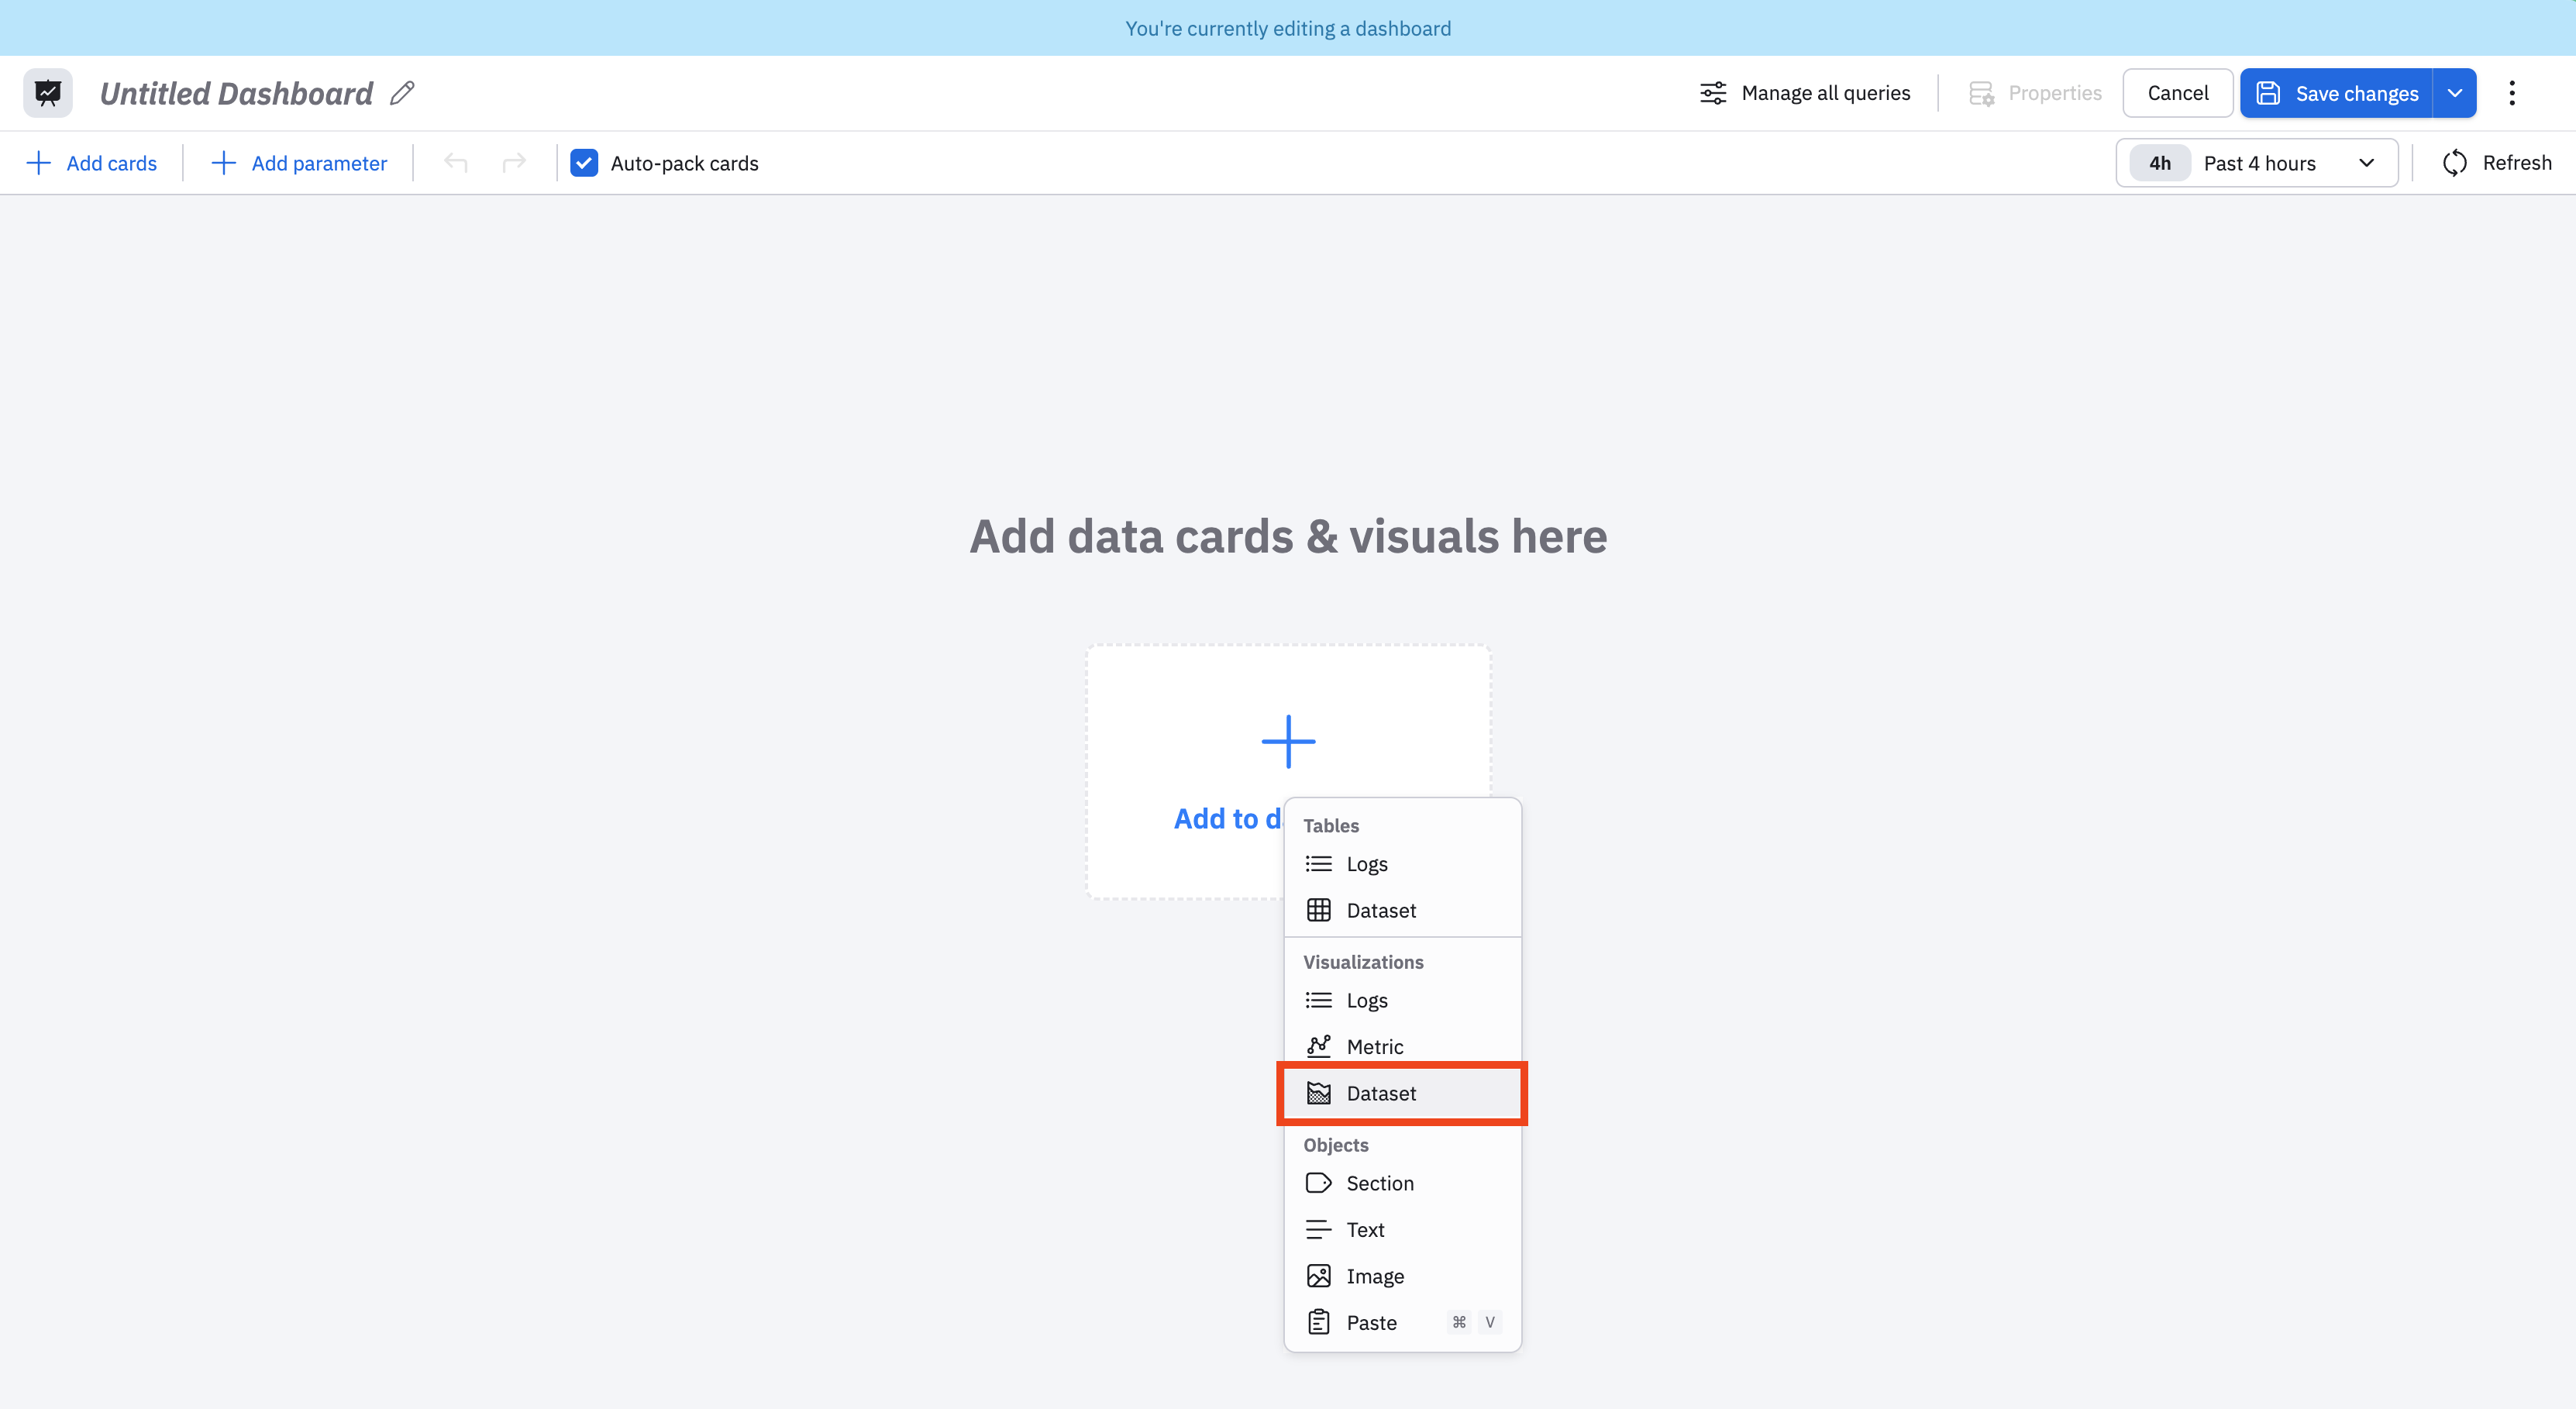
- Click New Dashboard, then click Add to dashboard.
- In the modal, you can select whether you want to add a table, visualization, or object to the dashboard you are creating. We want to add a visualization from a Dataset, so select Dataset under Visualizations.
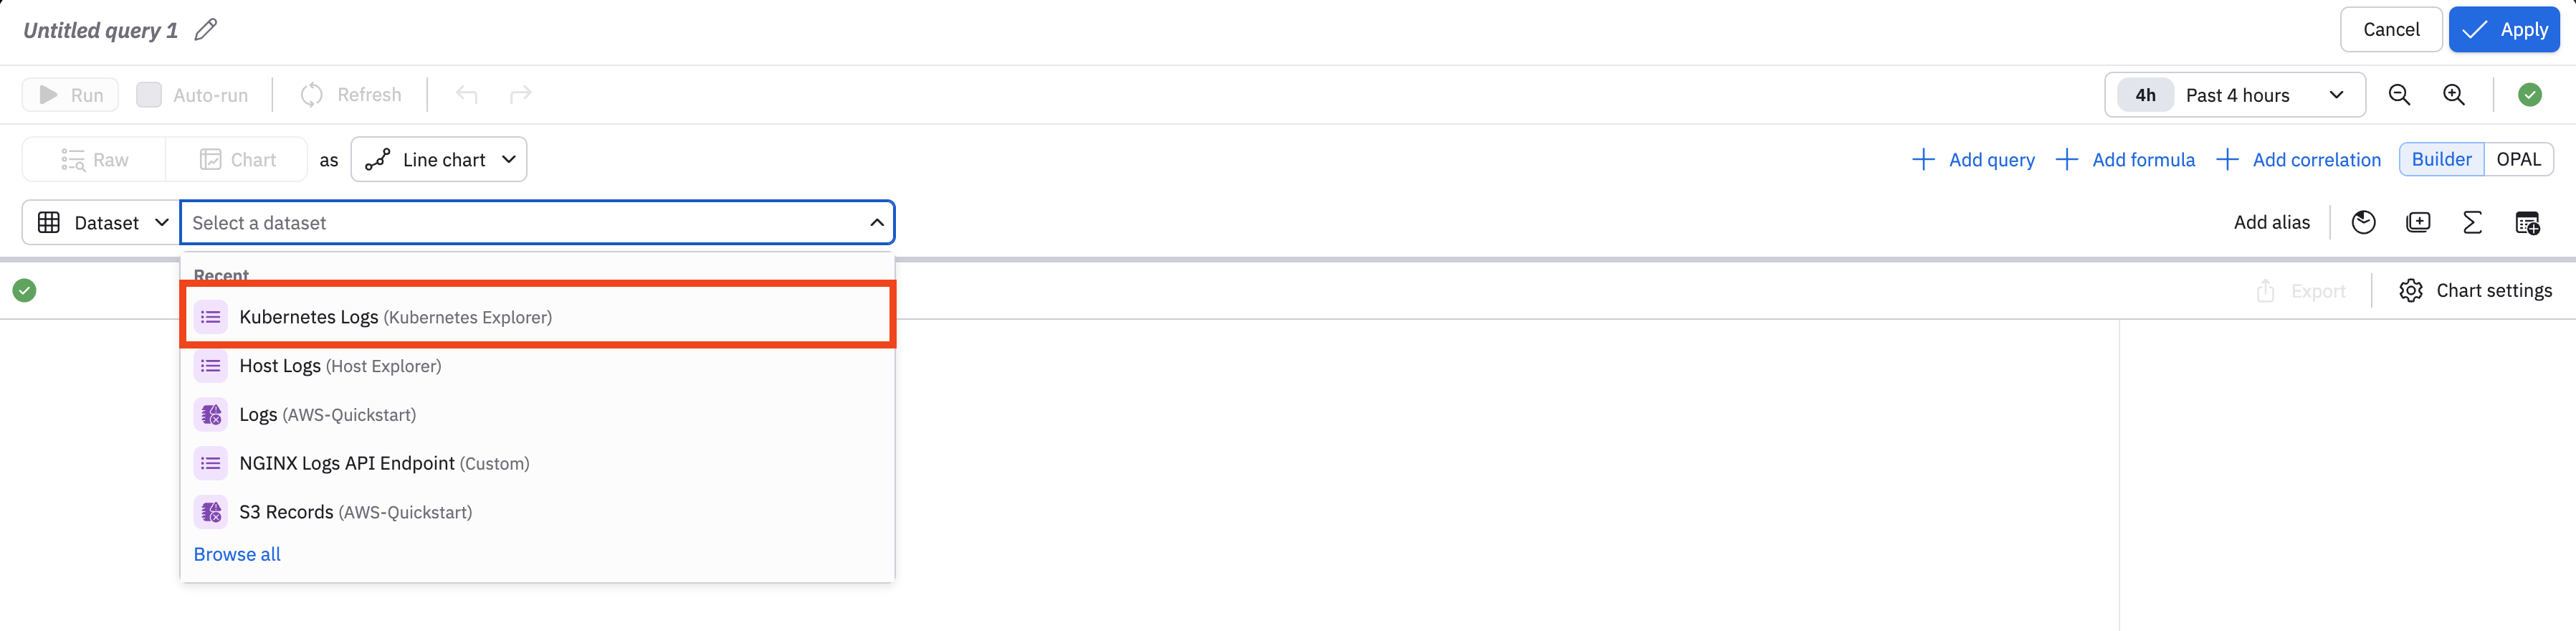
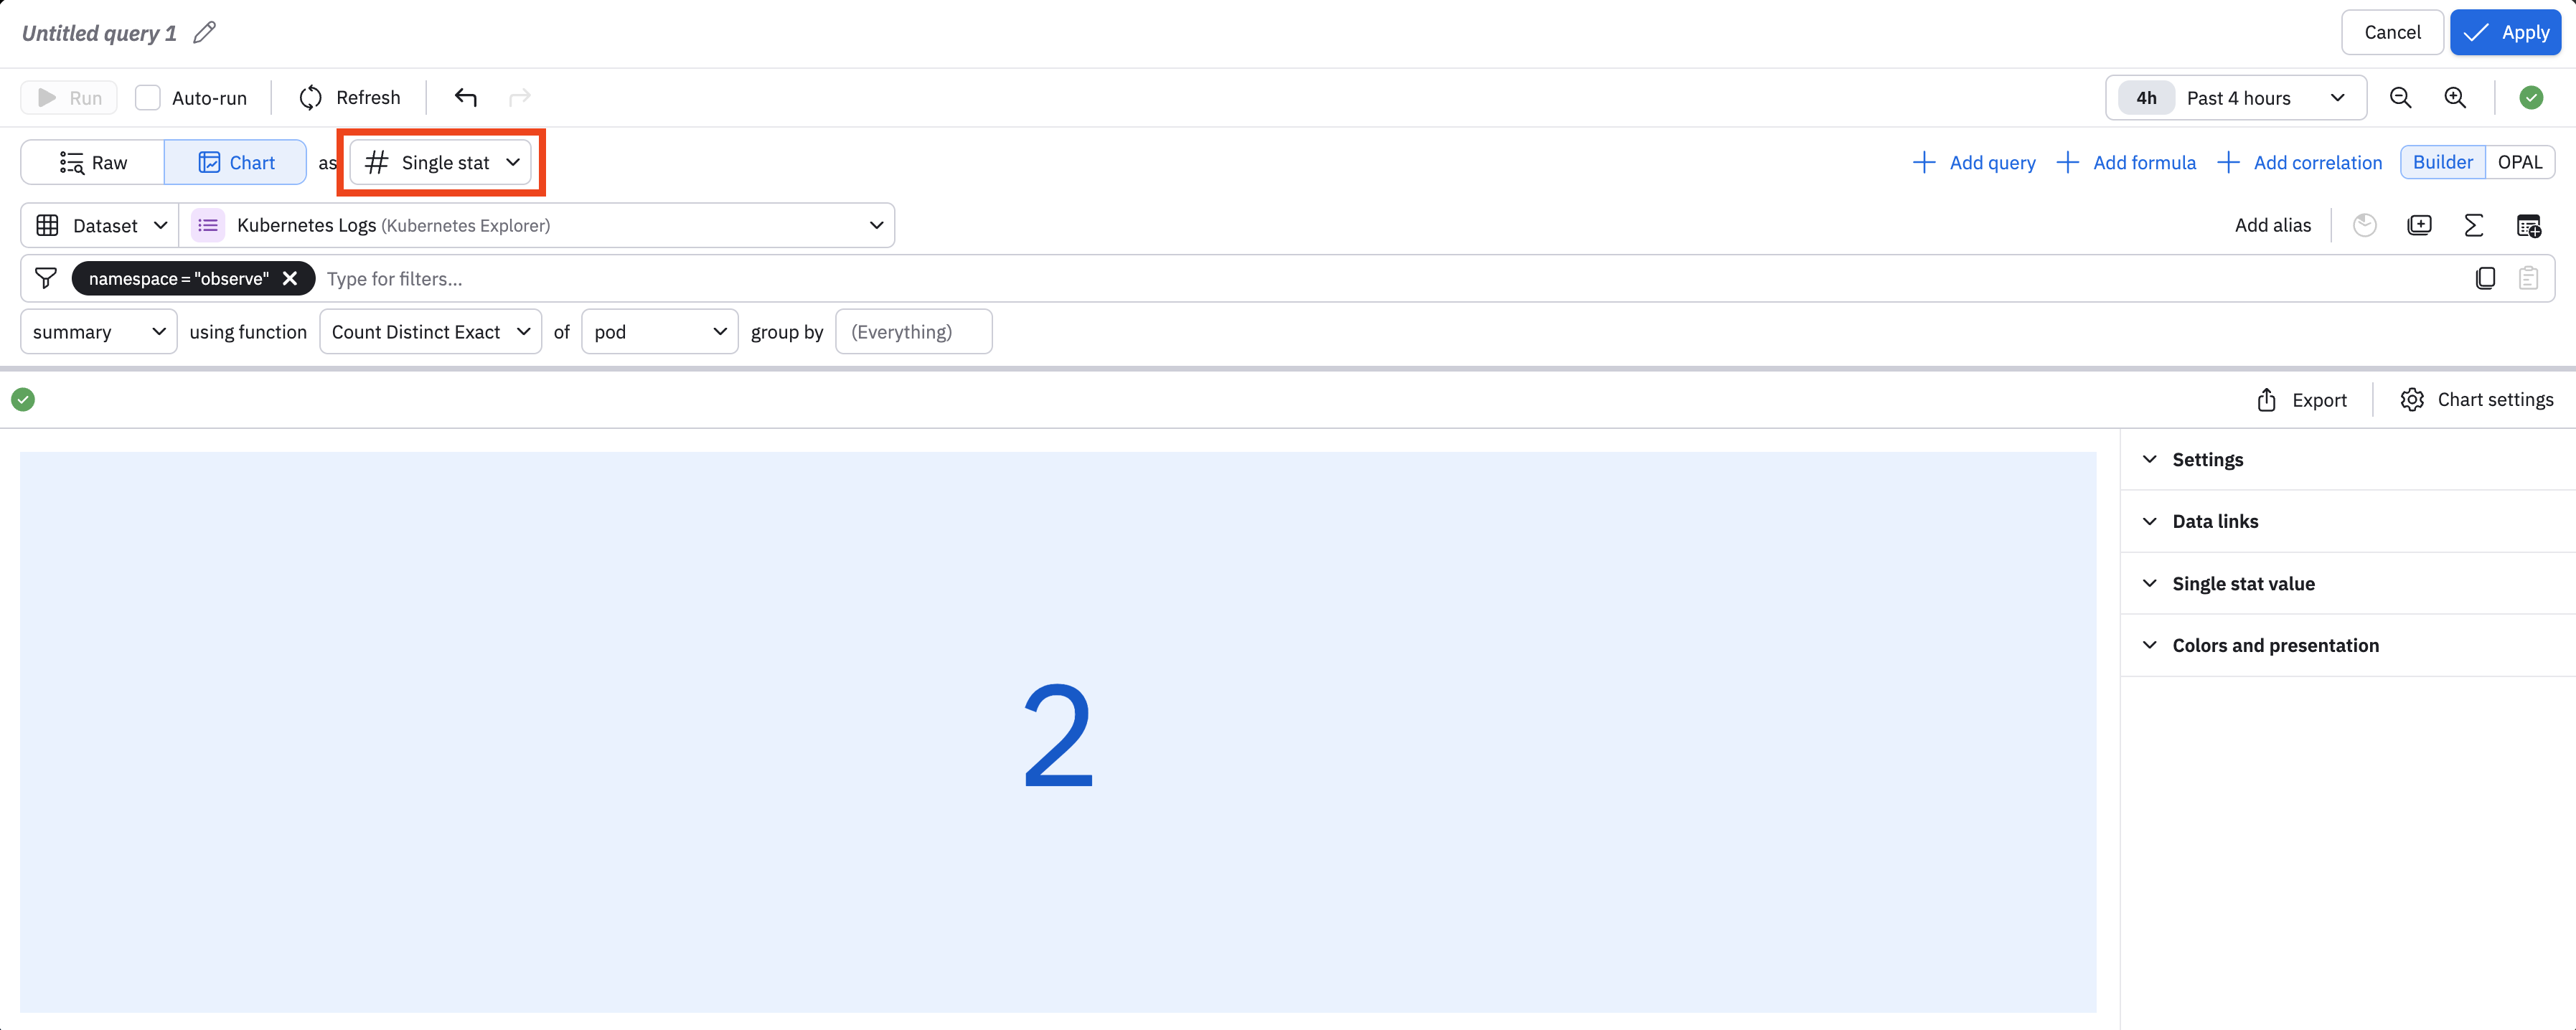
- Select Kubernetes Logsas the Dataset.
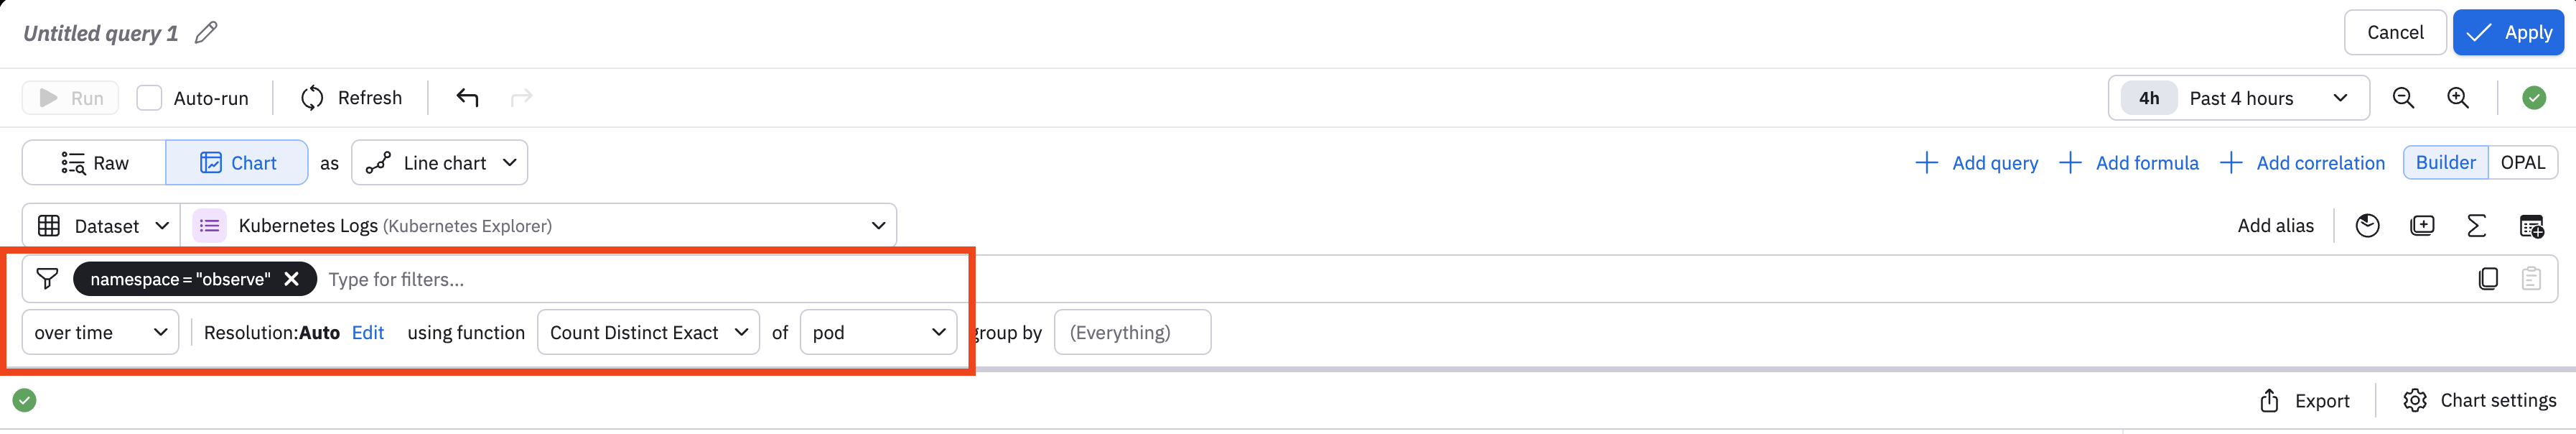
- We will create a single stat dashboard showing the number of pods in the observe namespace. Begin by adjusting the filters to find this data. In the Type for filters... field, enter namespace = "observe". Then select Count Distinct Exact as the function, and select of pods:
- Select Single Stat from the list of visualization types. You now have a single stat card you can add to your new dashboard.
- You can further customize your card:
- Give the query a name, such as Total Observe Pods.
- Expand the Settings section, and give the card a label, such as Total Observe Pods.
- Expand the Colors and presentation section and change the color.
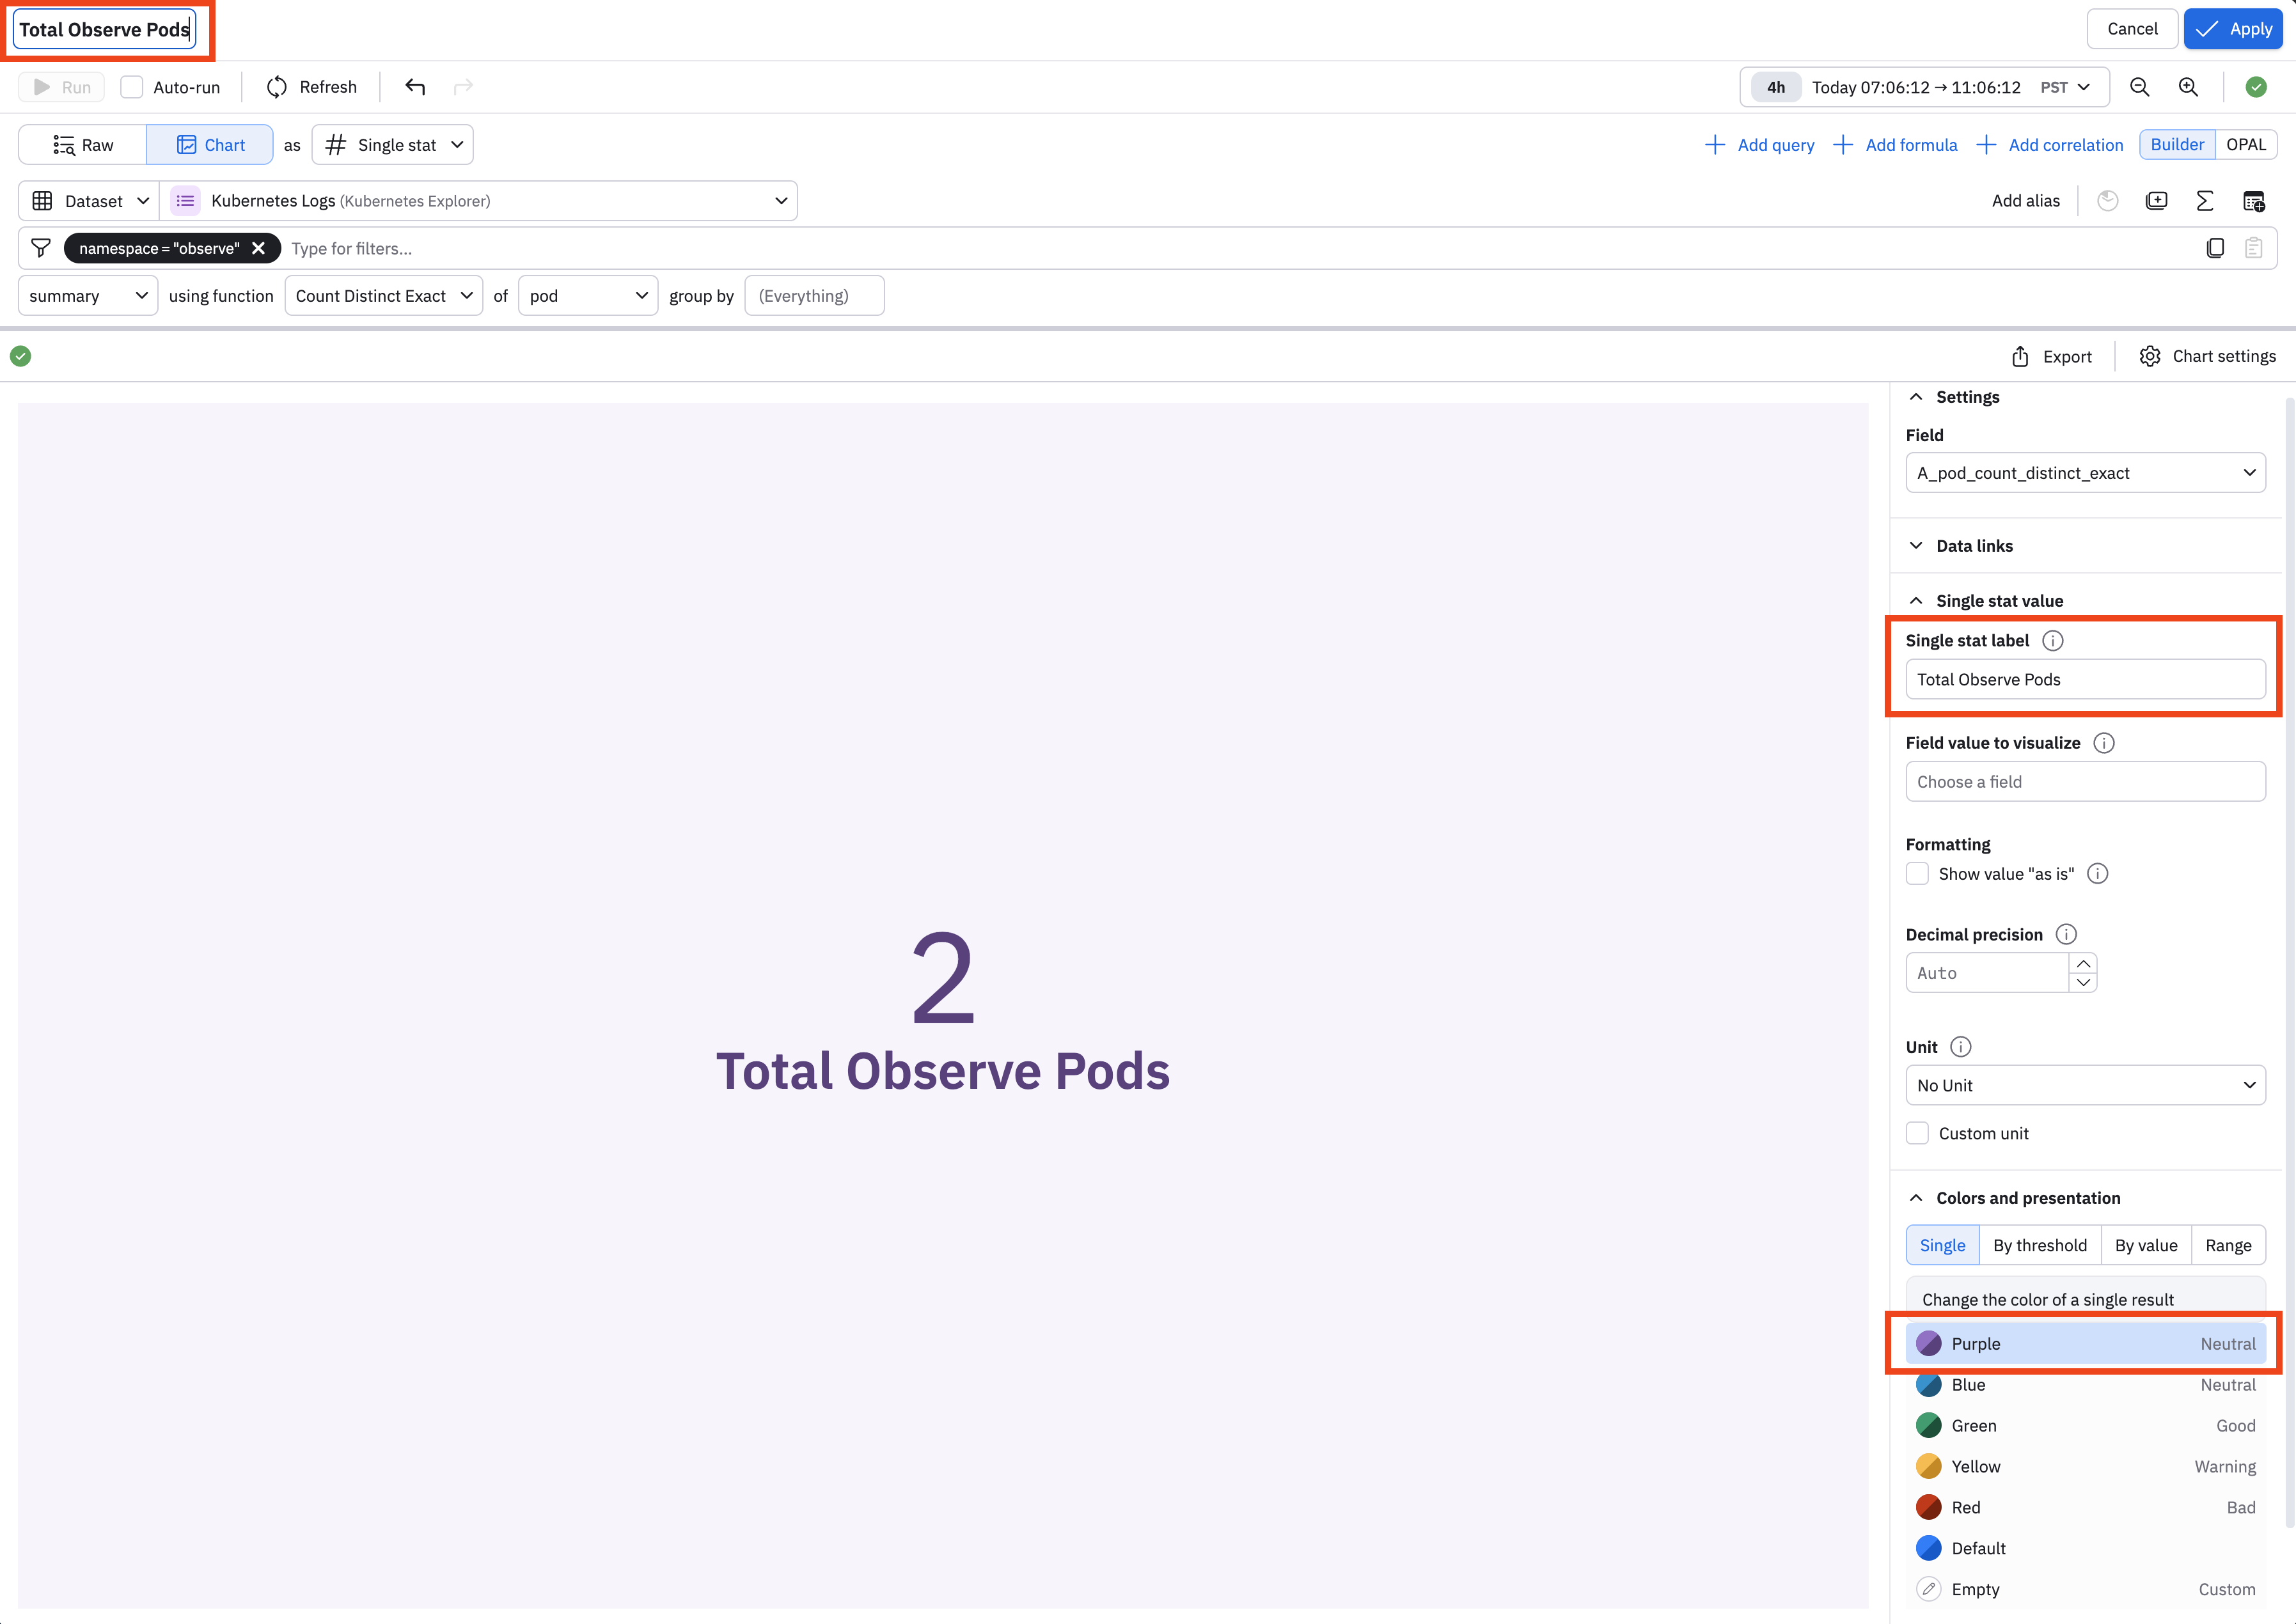
Click Apply when you are done to add this card to your dashboard.
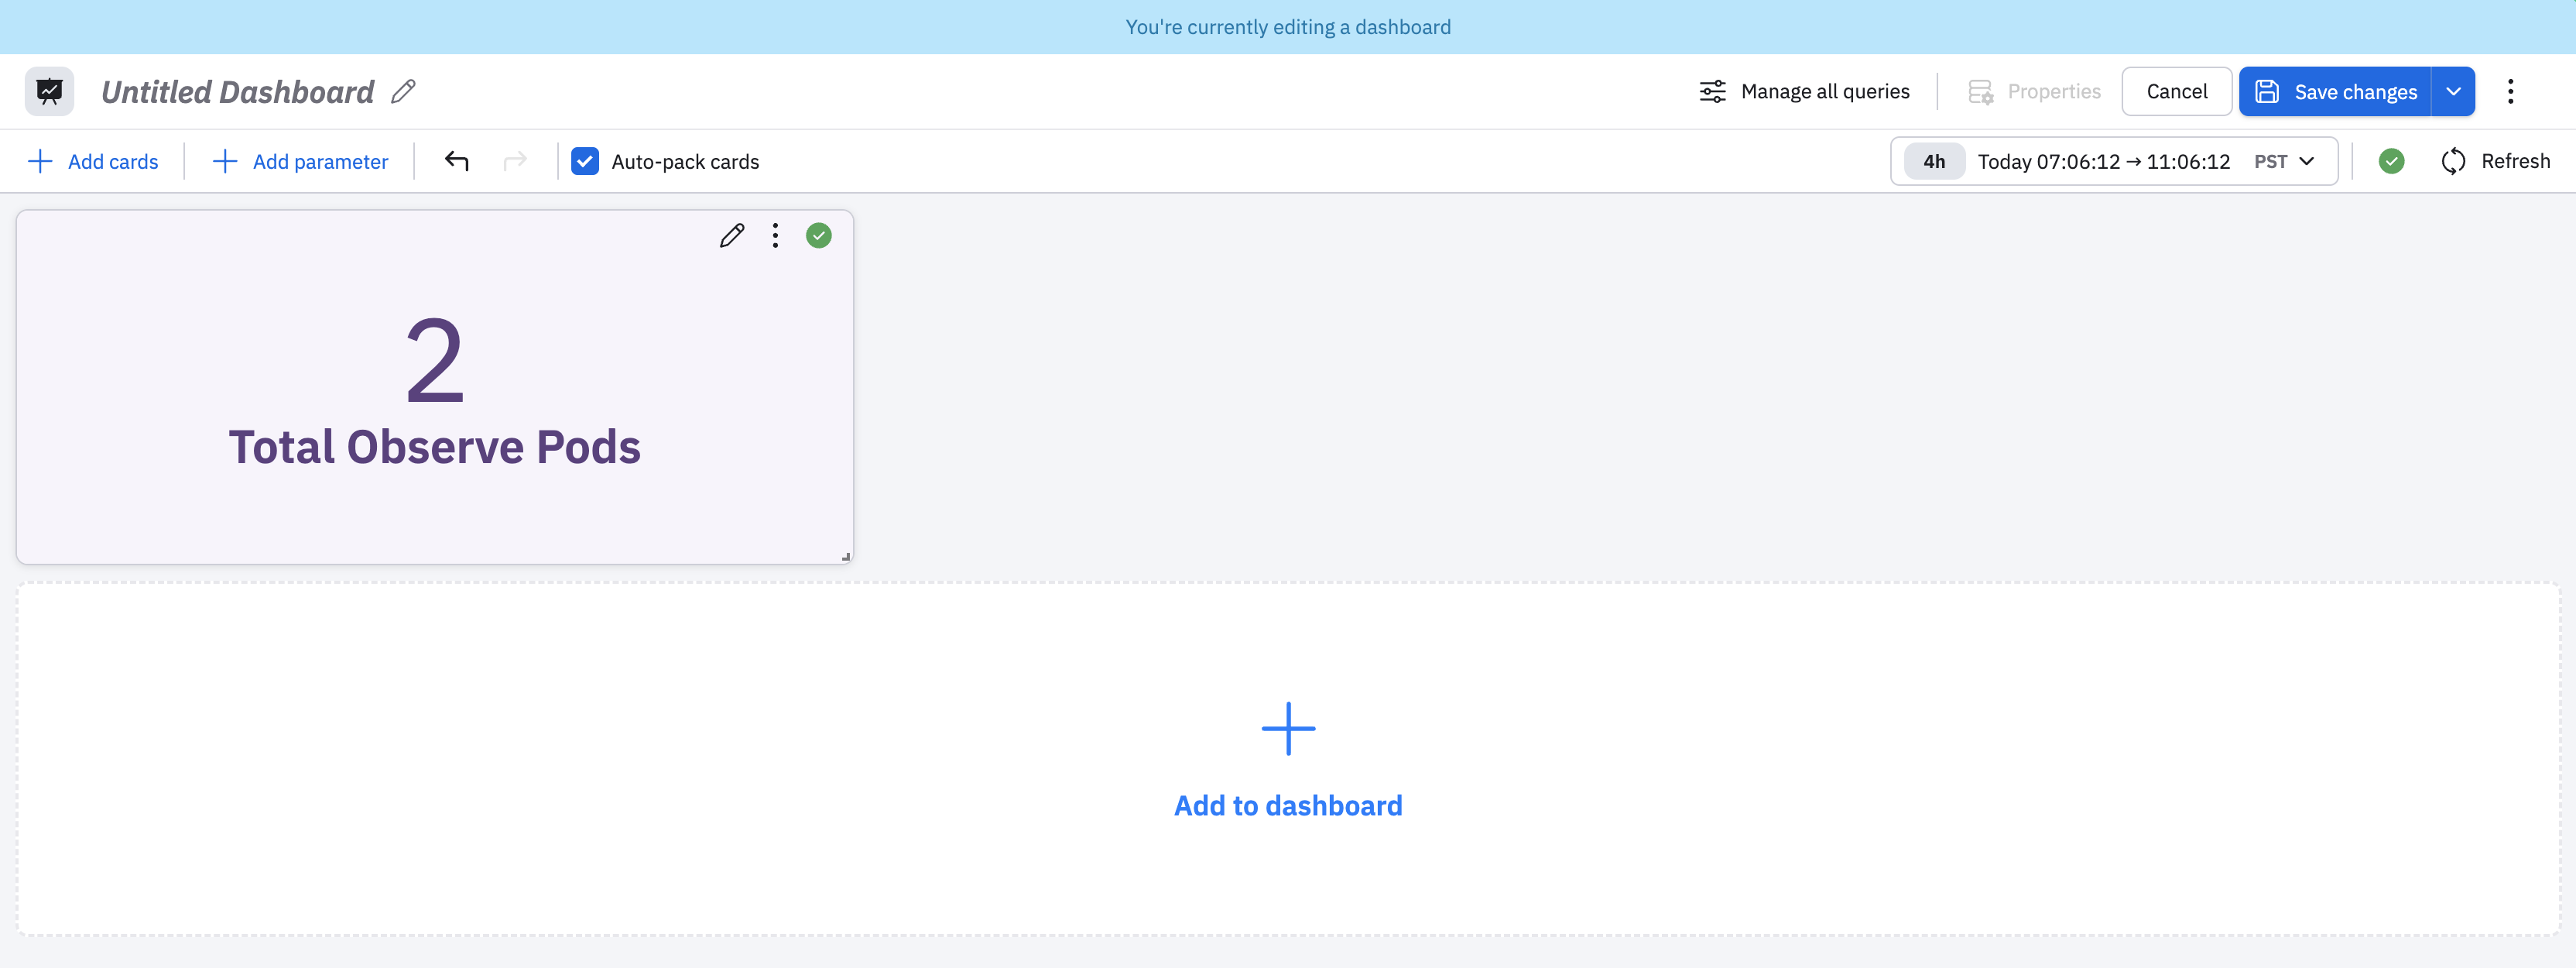
Lastly, give your dashboard a name and click Save changes to create and save this dashboard.
You can edit the card at any time by clicking the edit () icon on the card.
Updated about 1 month ago