Anomaly Monitor example: High number of APM service exceptions
Learn how to build an anomaly Monitor to look for high numbers of service exceptions.
Anomaly monitors automatically learn what “normal” looks like for a metric over time and alert you when recent behavior deviates from that baseline in a sustained way.
They’re best for signals that have evolving behavior, such as slow trends or evolutions, where static thresholds are either too noisy or must be constantly adapted. Consider the following uses cases where anomaly monitors are effective:
- Traffic patterns, such as RPS or throughput.
- Error rates or failure ratios.
- Latency or resource utilization.
In each of these use cases, you can further group by team‑owned units, such as service or cluster, or environments, such as production or staging.
Avoid using anomaly monitors for raw IDs or anything that creates thousands of tiny groups; you’ll get sparse data, poor baselines, and high cost.
One use case for anomaly monitors is monitoring the number of concurrent database connections. There is no straightforward static numeric threshold to set, as this number could vary over time or steadily increase while the services scale up. In this case, an anomaly monitor could help identifying an unusually high (or low) amount of connections, given the recent past.
How the Observe platform looks for anomalies
The Observe platform looks for anomalies based on the following criteria:
| Criteria | Description |
|---|---|
| Value column | The numeric time series you’re monitoring, such as requests_per_second, error_rate, or p95_latency. |
| Groups | Optional dimensions you group by, such as service_name or region. The algorithm runs independently per group, meaning that data points are flagged as anomalous within the group and values across groups are uncorrelated. |
| Evaluation window | The window of time you care about for alerting, such as the last 15 minutes. |
| Time resolution | The granularity of the time series, such as one value every 1 minute or every 5 minutes. This granularity is bound. The minimum and maximum values are chosen based on the width of the evaluation window. |
| Computation window | This is the training history:
|
| Dynamic bounds | Upper and lower bounds are computed as follows:
|
Create an anomaly monitor from the monitors list
In this example we create an anomaly Monitor called Service Exception Count Spike that does the following:
- Monitors the apm_service_exception_count metric from the Error Tracking Metrics Dataset. This metrics tells you the number of service errors for each service.
- Counts the number of exceptions over a 5-minute rolling window, summed per service.
- Fires a Warning-level alert when any service's exception count is 25% higher than normal, and fires an Error-level alert when any service's exception count is 50% higher than normal during that time window.
Create the Service Exception Count Spike Monitor
Perform the following steps to get started with creating this anomaly Monitor:
- Click Monitoring on the left navigation rail.
- Click New monitor.
- Click Anomaly.
- Give the Monitor a name: Service Exception Count Spike.
- In the Monitor query section, click the Select a metric drop-down, then find and select the apm_service_exception_count metric.
- Let's do some additional filtering, and select Sum as the function, and group by
tags."service.name".
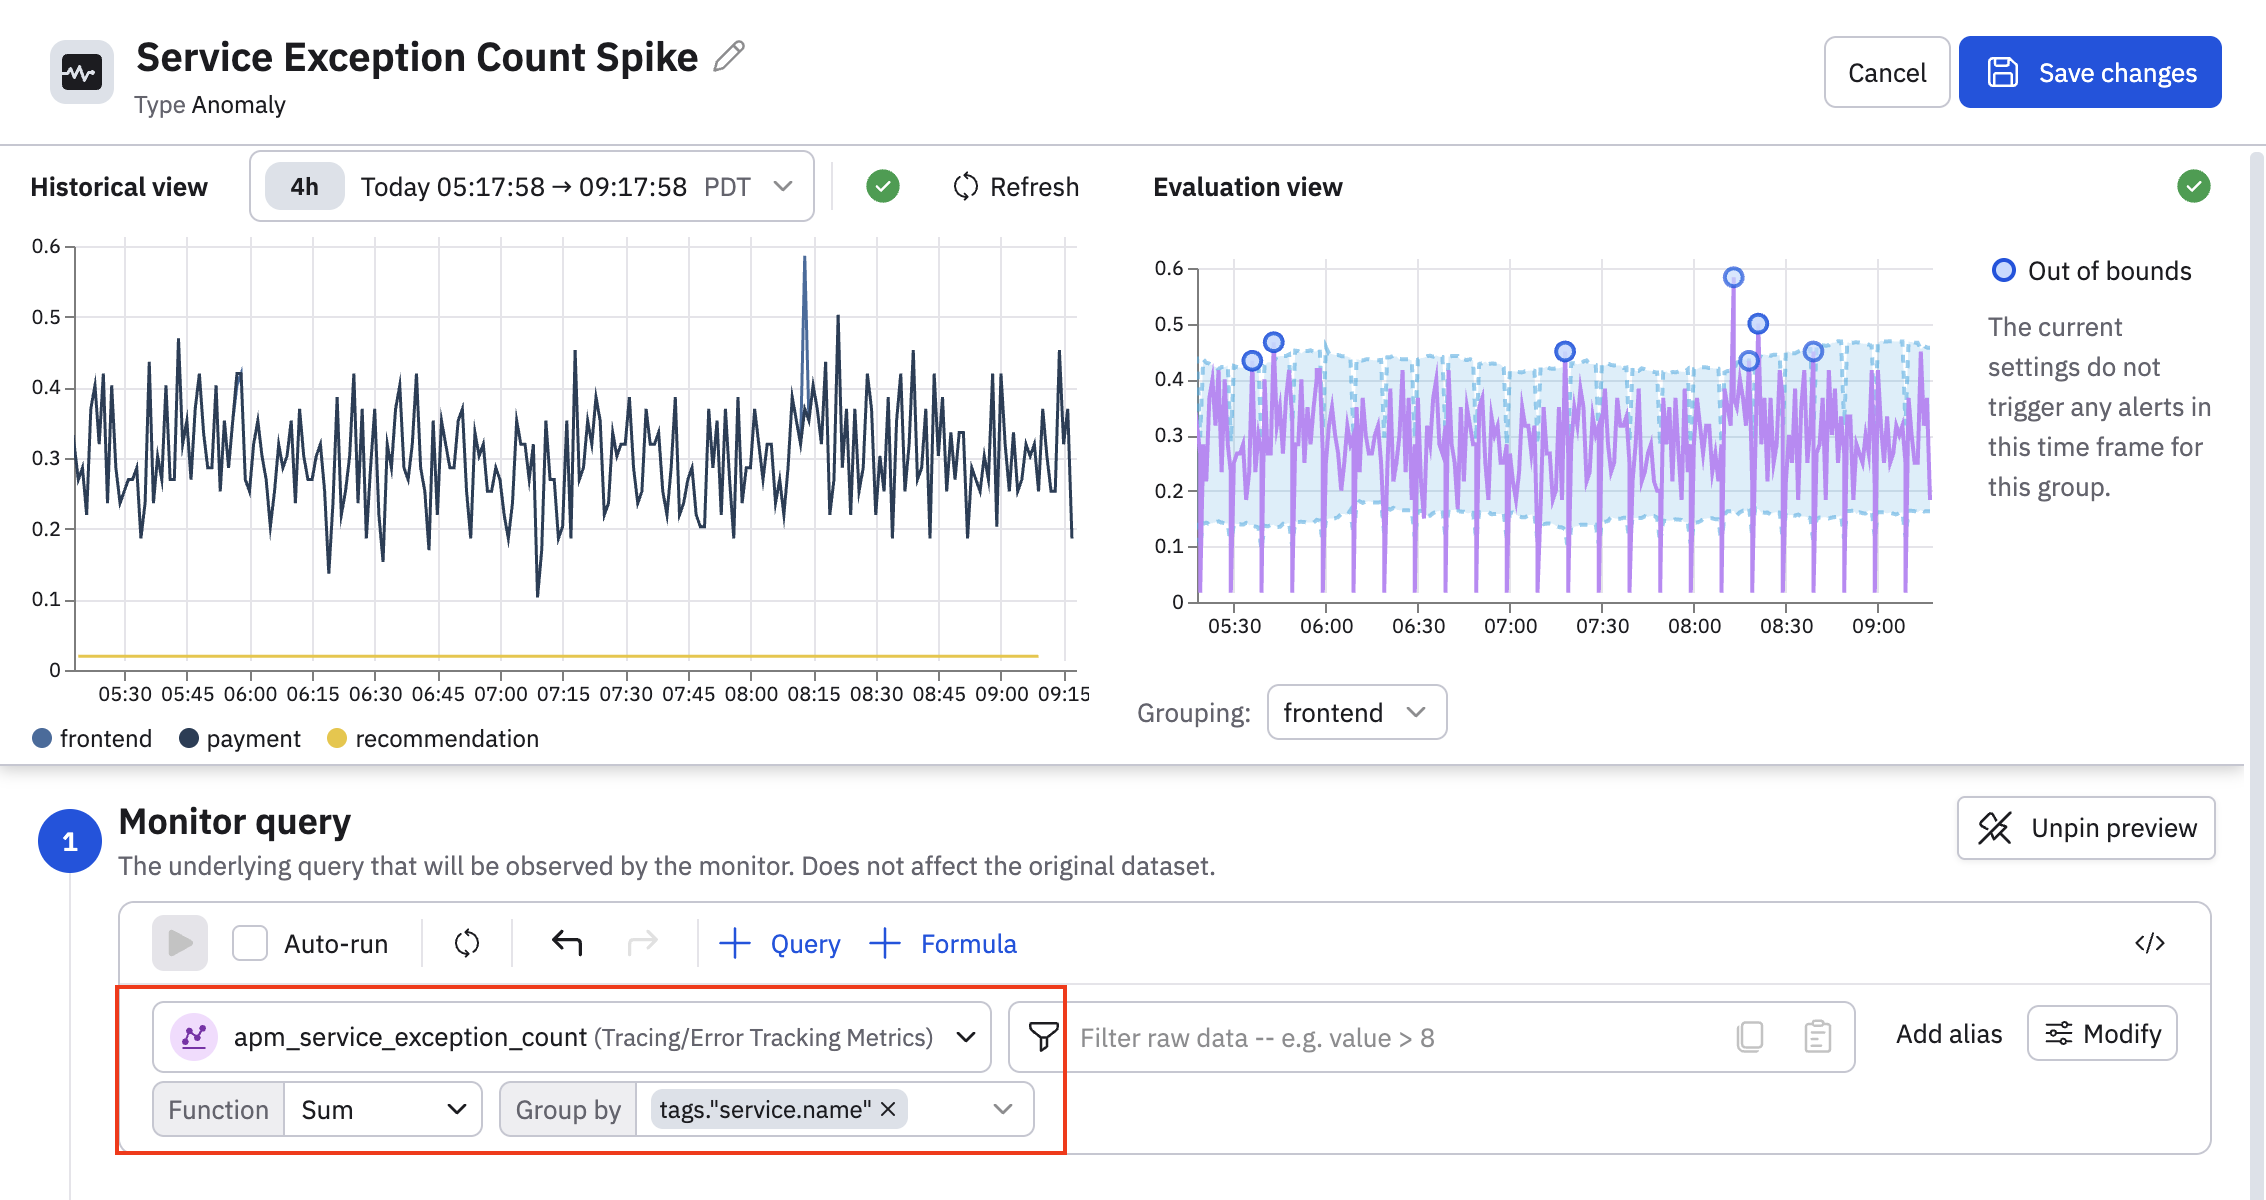
You can see the Out of bounds message indicating the current settings do not generate any alerts. We will adjust the thresholds of this Monitor in a bit so that some alerts are generated.
Configure how the monitor is evaluated
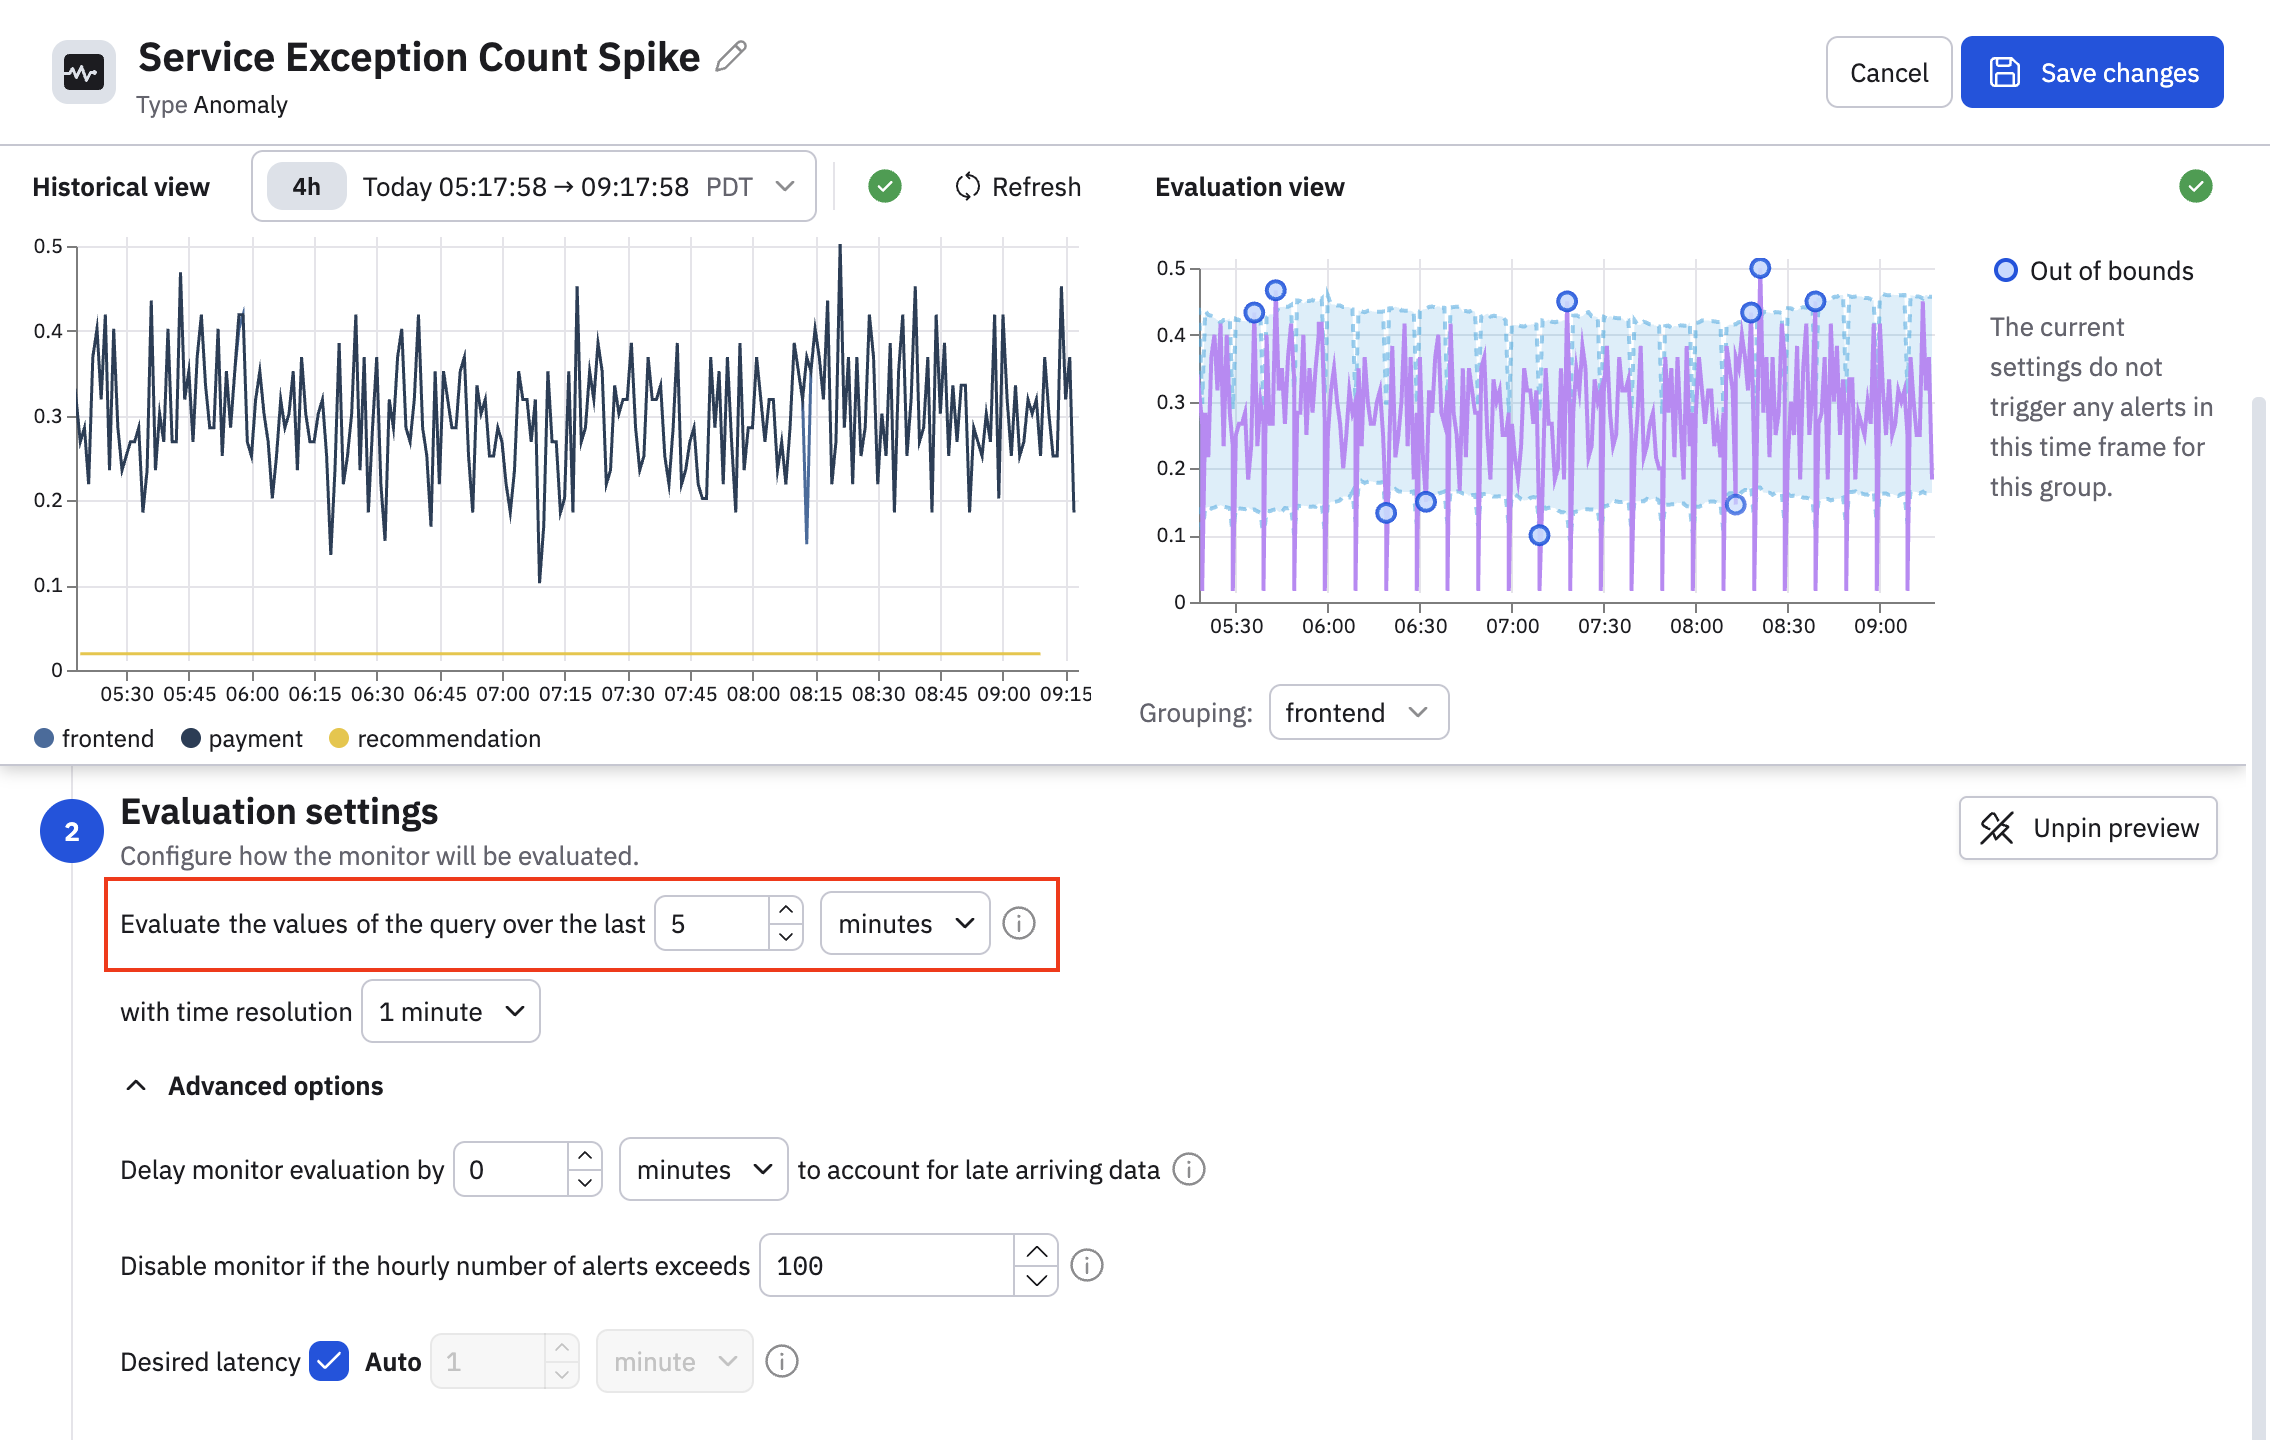
Define the evaluation window and time resolution.
Evaluation window
Evaluation window is the period of time you care about for alerting. For example, “In this window of time, what percentage of points look anomalous?”
How to choose your evaluation window:
- Short window, such as 5–15 minutes
- Great for fast‑moving metrics where you want quick detection.
- Combine with moderately fine resolution, such as 1-2 minutes.
- Medium windows, such as 30–60 minutes
- Good for noisy or bursty metrics, because the percentage of anomalous points is more stable.
- Long windows, such as hours
- Good for slow trends like daily volume patterns.
- Fewer evaluations (longer latency to alert).
Remember: the system also maintains a longer history window behind the scenes to learn the baseline; you don’t need to manage that manually in the UI.
Time resolution
Time resolution is the granularity of the time series. A finer resolution like 20 seconds can mean more detail, more noise, and more cost. A coarser resolution such as 4 minutes can help reduce cost, but you may miss narrow spikes in your data.
Expand the Advanced options to configure additional settings. See
- Late arriving data - how long to wait for all the data to arrive before evaluating the monitor.
- Disable the monitor if the hourly number of alerts exceeds a specified number.
- Desired latency - how quickly the monitor responds to new data. The default is auto, where an efficient latency is selected for you, based on your query.
In our example, we will set the time window to 5 minutes, and leave all the other default values as is.
Define the alerting rules
Define the conditions for when an alert is raised. An anomaly monitor must have at least one alerting rule.
- Select the standard deviations from the drop-down list. Selecting 1 makes the rule very sensitive. Many points will be outside the bounds. You should select a low value like 1 only in combination with a high percentage threshold or very stable metrics. Selecting 2 is recommended for most cases, as this catches clear deviations without being too noisy. Selecting 3 or higher makes the rule more conservative, and is good for very noisy metrics where you only care about large spikes or drops.
- Select the bounds you care about. For example, select above if you only want values higher than the upper bound to count as anomalies, or below if you only want the values below the lower bound to count as anomalies, or above or below if you want both.
- Slide the Missing data toggle to the on position to trigger a no data alert if data is missing for
the minimum of the query over the time window defined in the evaluation settings. Enabling the missing data toggle also makes the No data severity available, which you can select when you configure your notification actions. - Configure an alerting rule, specifying the alert severity and alert threshold. To help tune the volume of alerts you receive, click Add grouping conditions and configure additional logic, such as:
- Warning for internal environments. For example:
env == "testing". - Error for staging environments: For example:
env == "staging". - Critical for production environments. For example
env == "prod".
- Warning for internal environments. For example:
You can further refine the amounts of alerts by restricting to critical services, high-value regions, or just the subset of groups you actively care about.
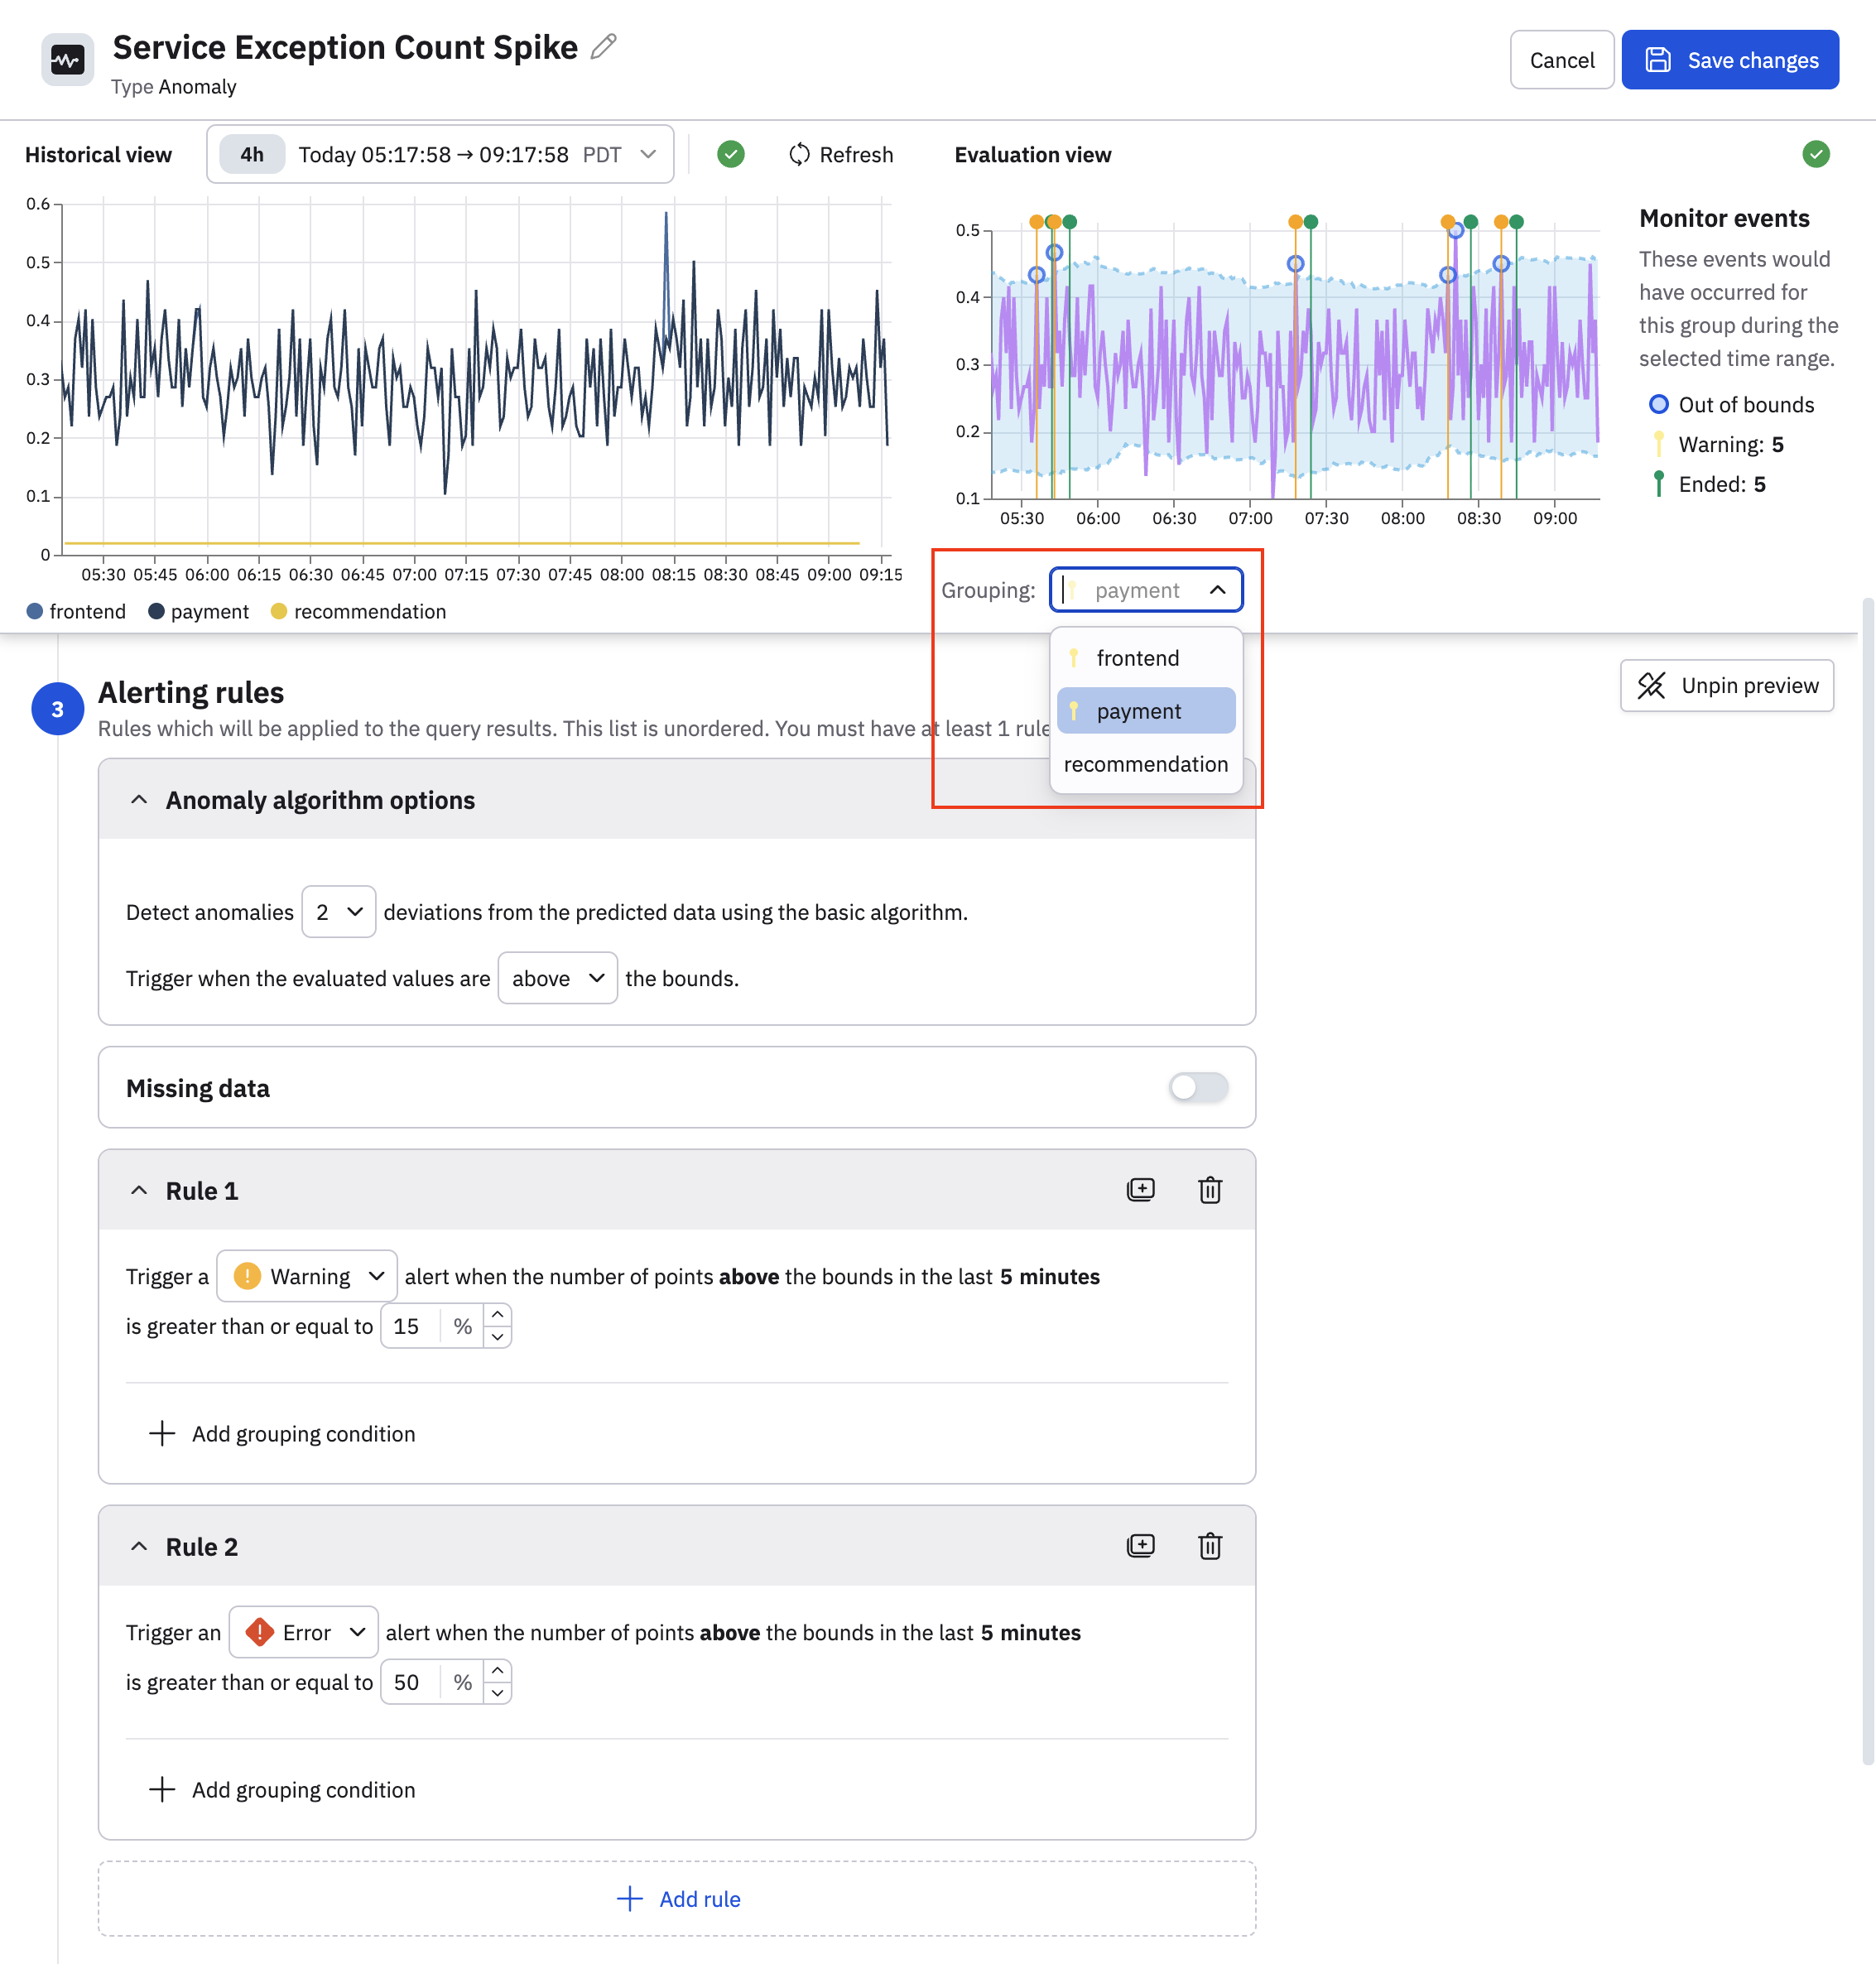
In our example, we configure the following alerting rules:
- We only care about when the number of service exceptions exceeds a normal threshold, so we select above the bounds.
- Trigger a warning when the number of exception alerts for any service exceeds the normal bounds by more than 15%. Since there are multiple services, the anomaly Monitor calculates the threshold for each service automatically, so you don't need to configure thresholds per service.
- Trigger an error when the number of exception alerts for any service exceeds the normal bounds by more than 50%.
In the Evaluation view, you can see now that these rule parameters do generate some alerts. There are 5 warnings generated for the frontend service, you can click the dropdown in the Grouping field and select another service to see if there are alerts for those services as well.
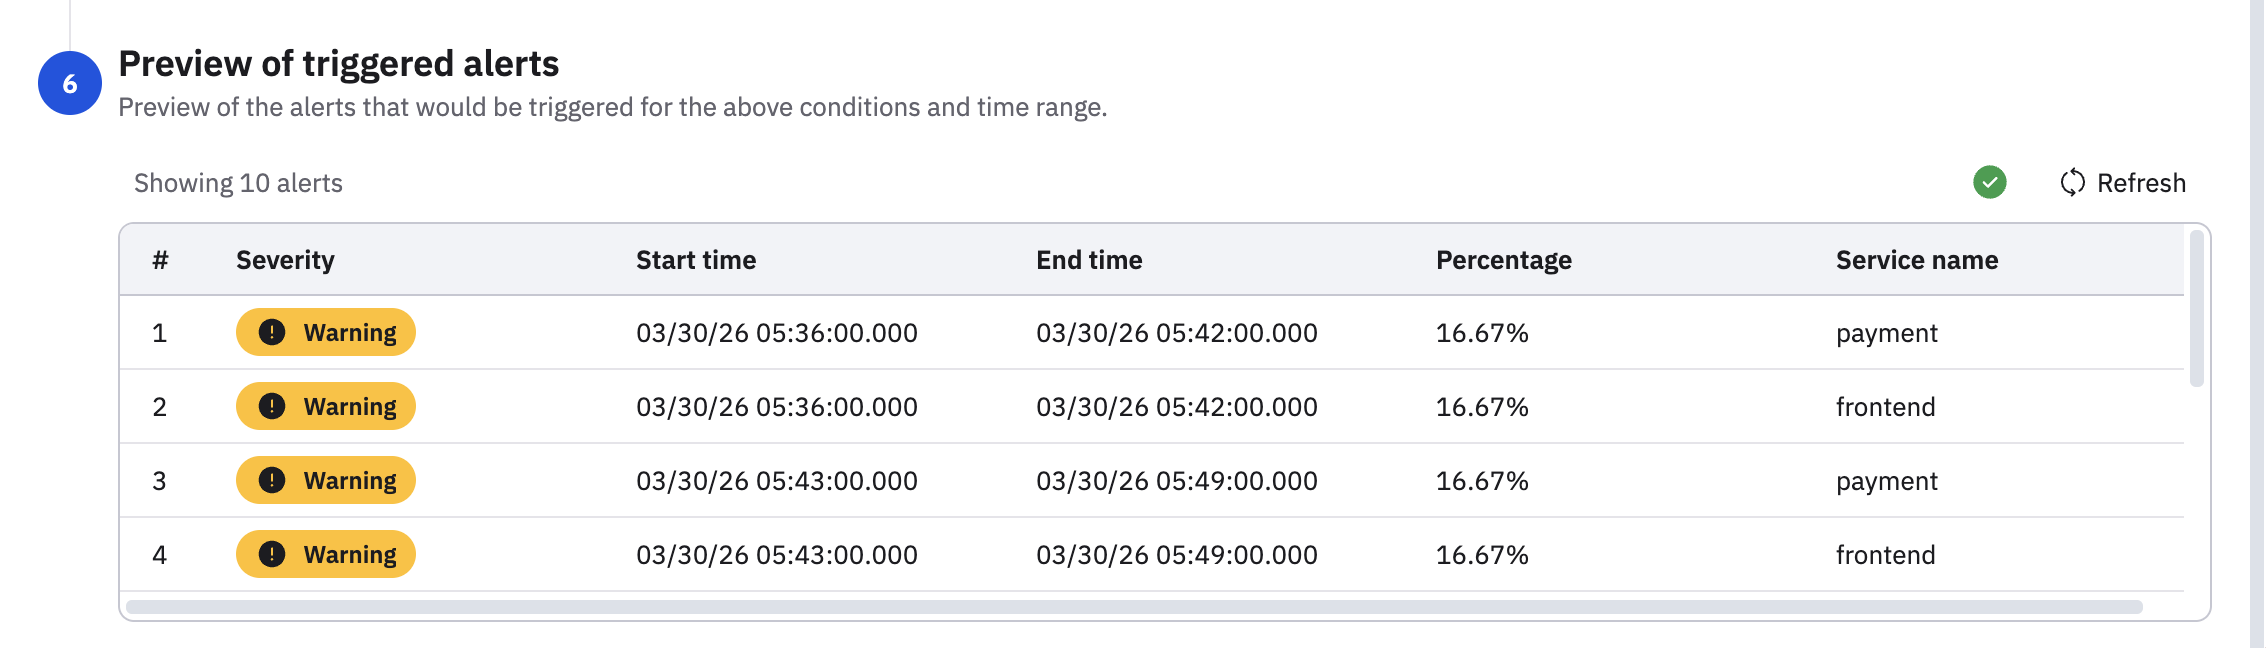
Scroll to the bottom of the Monitor configuration to get a preview of the alerts as they would appear in the Alert Explorer.
Provide a description
Provide a description for this anomaly monitor explaining what this monitor does and how it works. You can't use variables in the description.
Configure the notification actions
Configure the notification actions you want to launch when a rule is met. You can configure notifications actions using email, webhook, Slack, or PagerDuty.
In our case, we want to send an email when a Warning is triggered, but send a notification in Slack for Errors.
- Begin by configuring a title and message. These fields are important because their values can be referenced using Mustache. You can use
{{monitor.variables.title}}for the title, and{{monitor.variables.message}}for the message. See the Mustache template reference. - Configure the email to send a message any time a warning is generated.
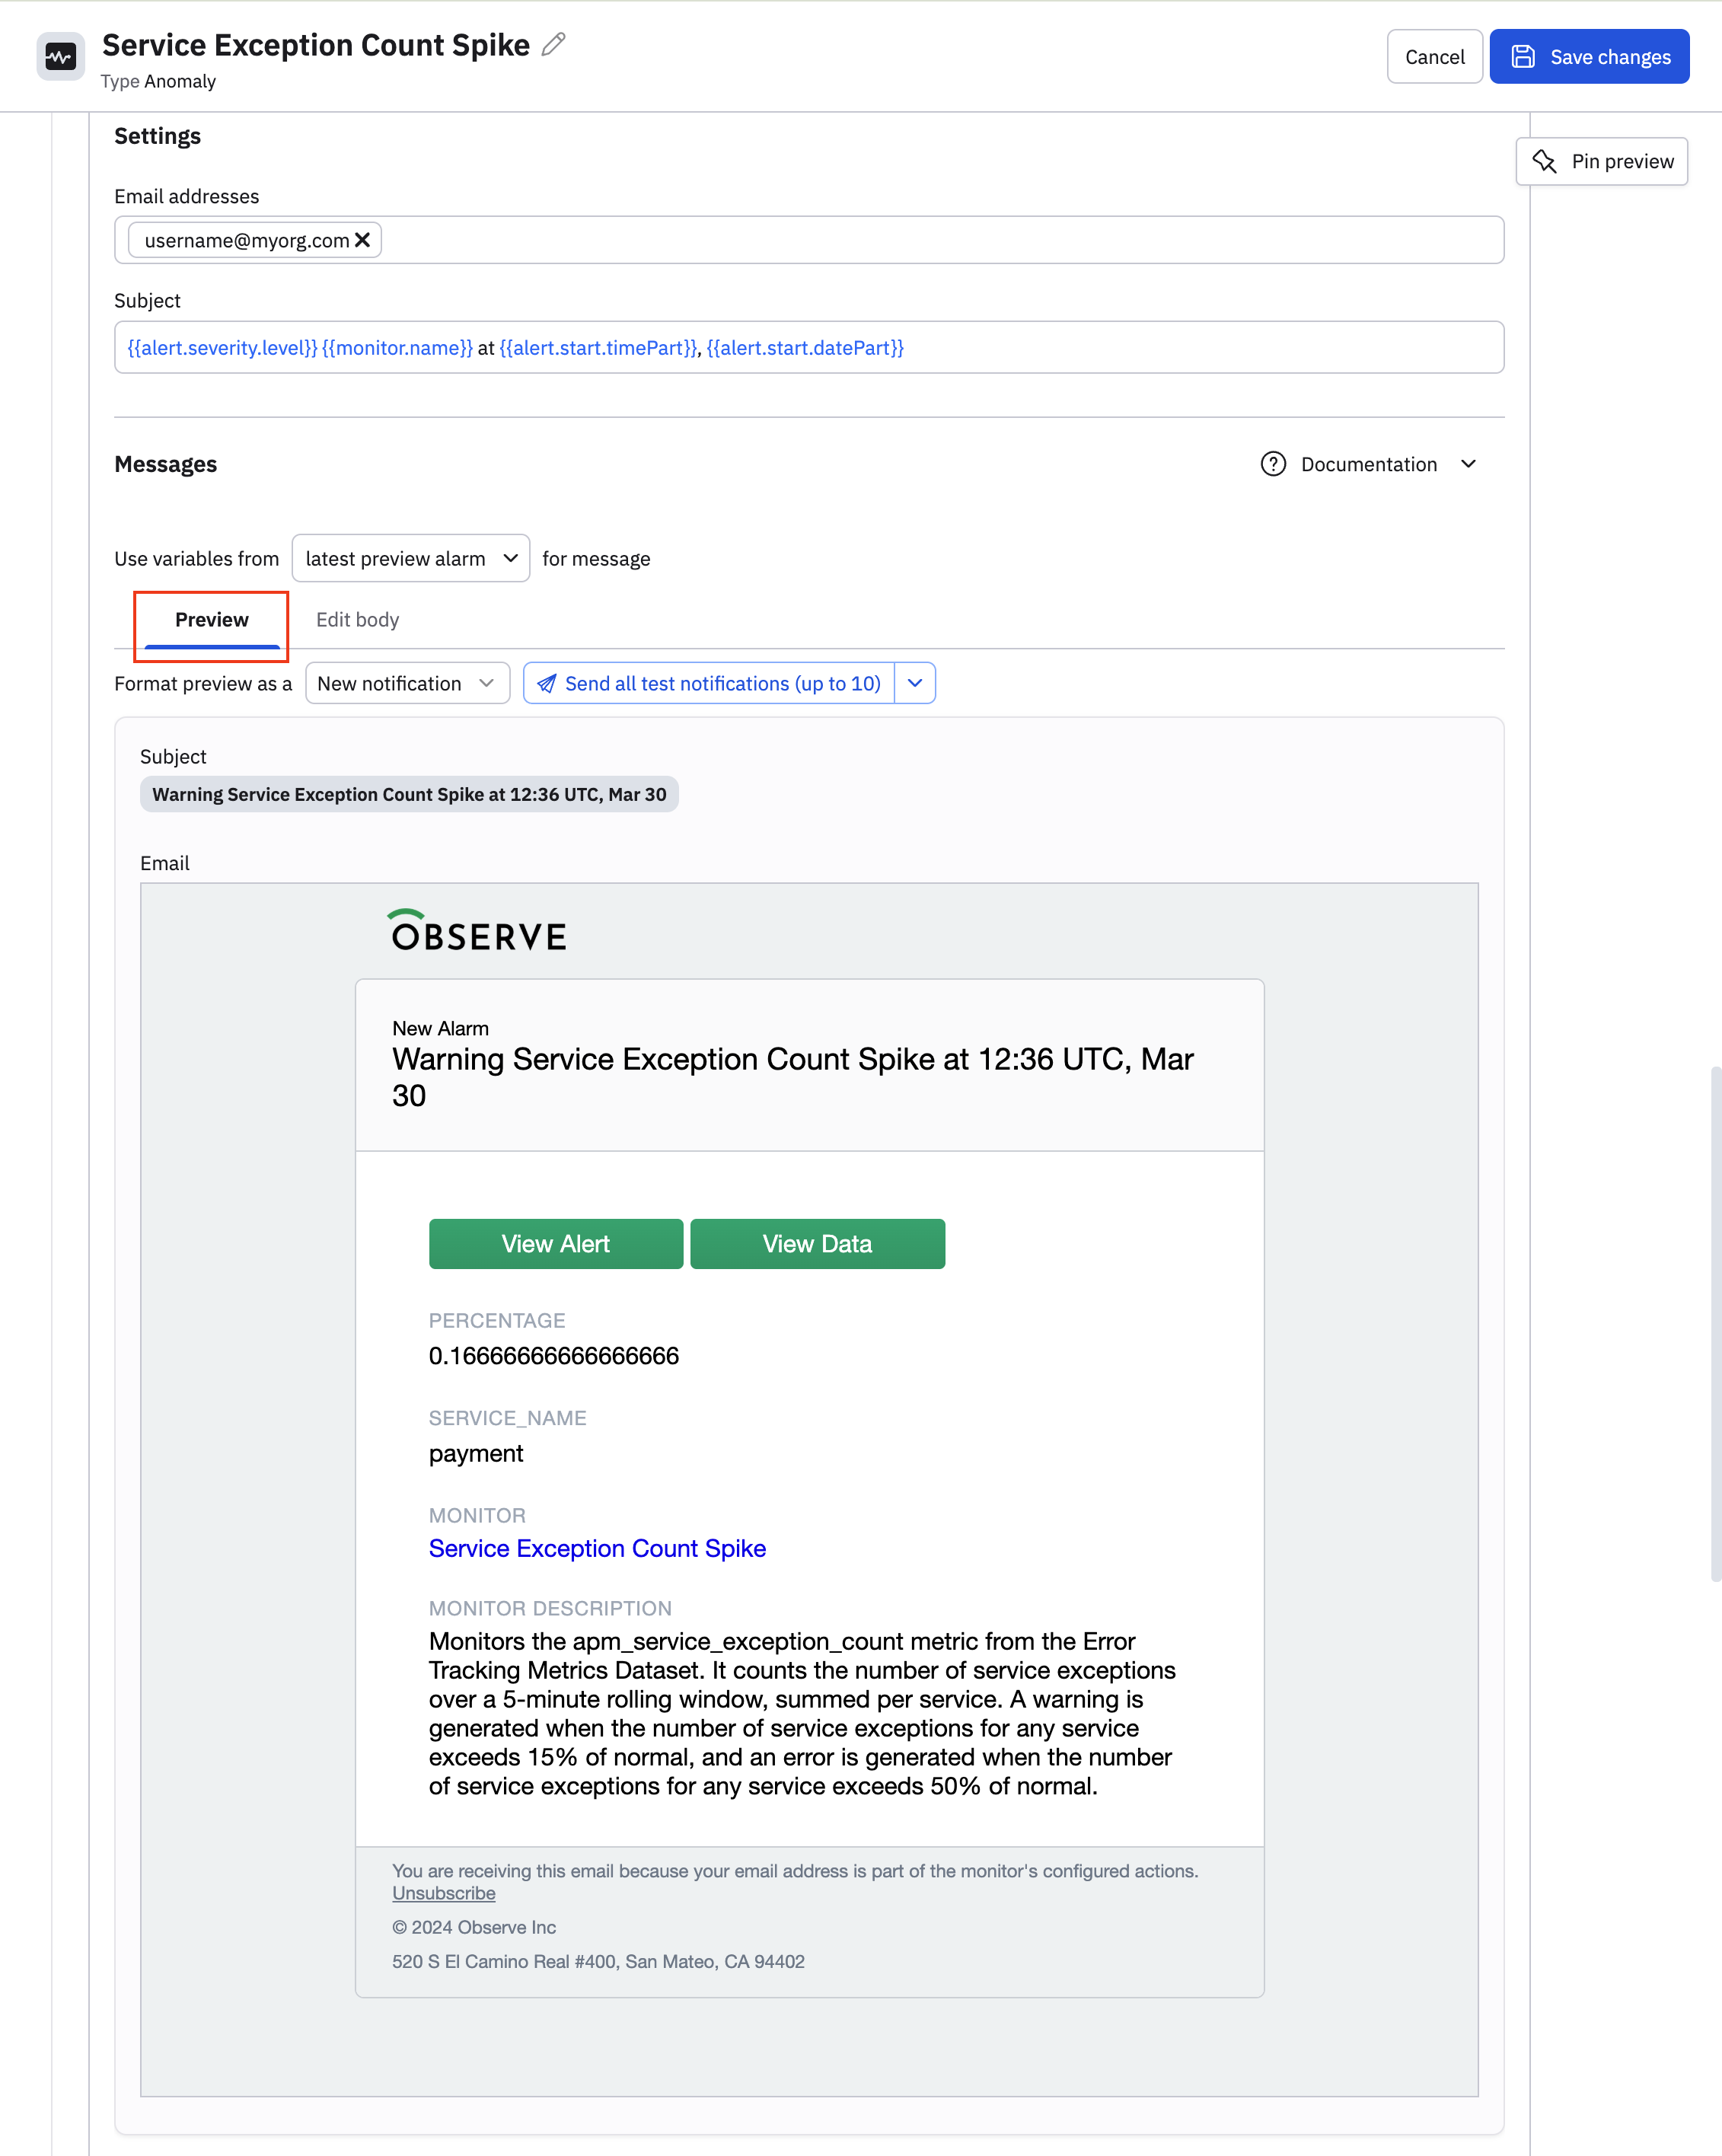
- Provide a destination email address and a subject. You can click on Show variables panel to view the variables available to you for generating the body of your email. Click Edit body to view the raw source for the email.
- See what your email will look like in the Preview tab.
- Click Add action to configure a second action to send a Slack message anytime an error is generated.
- See Get started with incoming webhooks to configure a webhook so that you can post messages from this Monitor into Slack.
Save and publish the Monitor
Click Save changes to create the anomaly Monitor.
Updated 3 months ago