Customize time ranges
Learn how to configure custom time ranges in your dashboard cards.
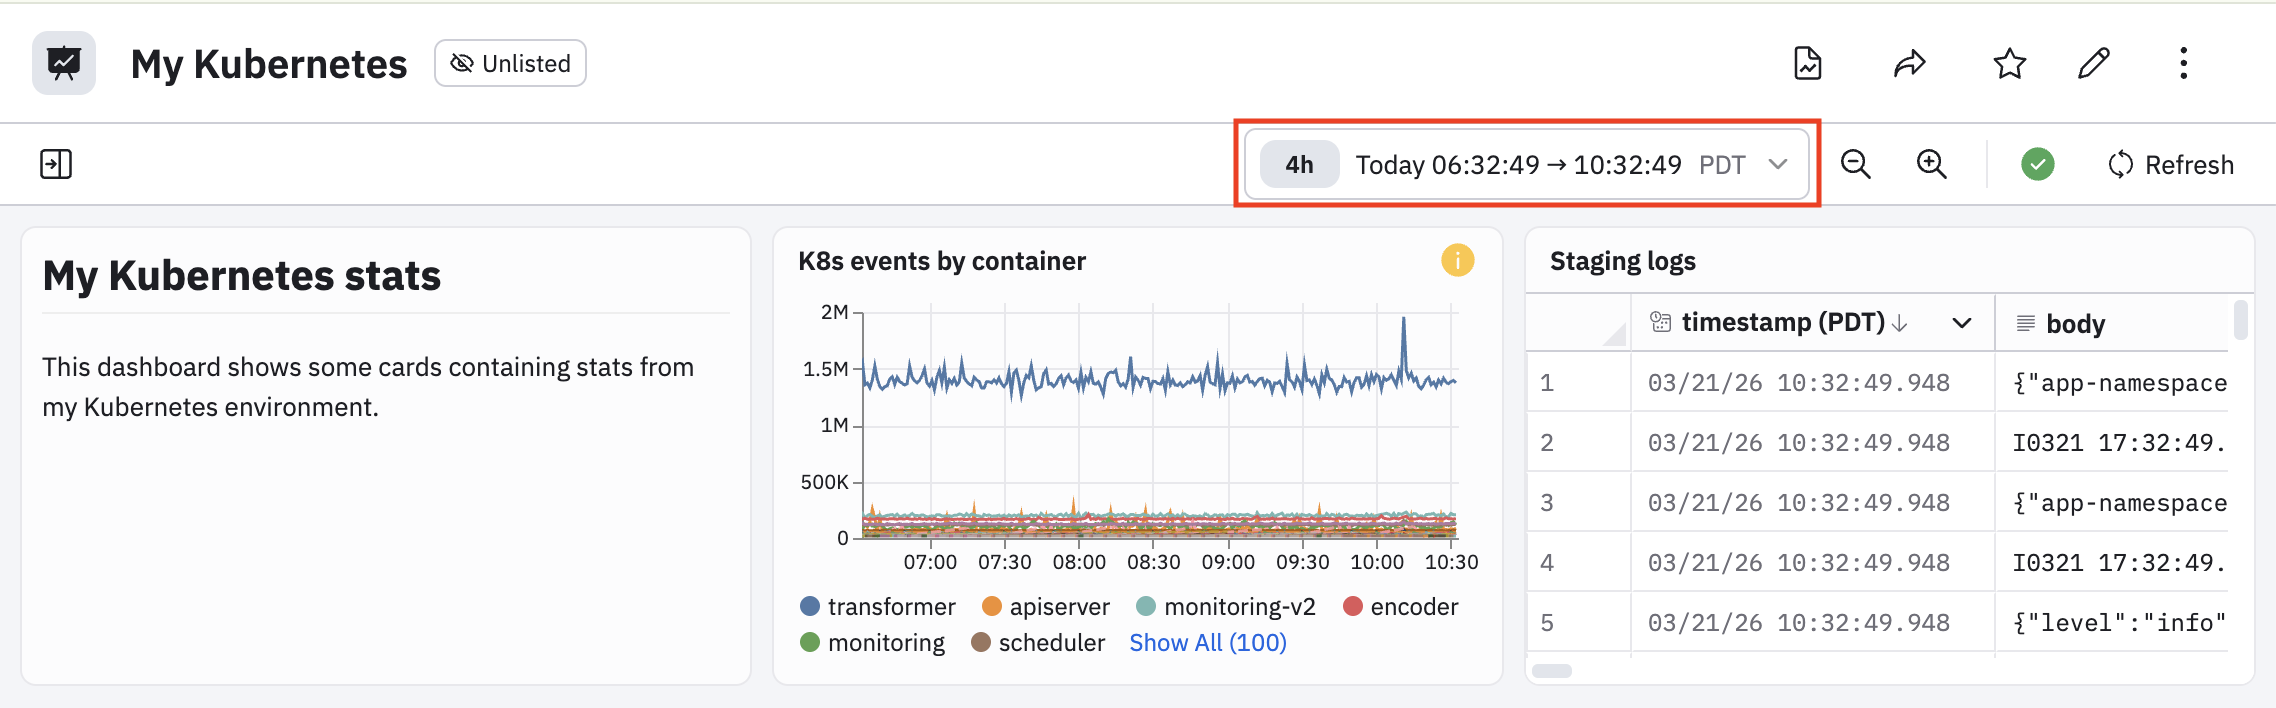
The time range on a dashboard applies to all cards on the dashboard. In this example, we see that a 4 hour window is selected as the time range, which applies to both cards in the dashboard.
Custom time ranges per card
You can configure a time range for each card that is different from the time range on the dashboard. This is useful when you have a situation where you want to easily compare the same data across different time ranges.
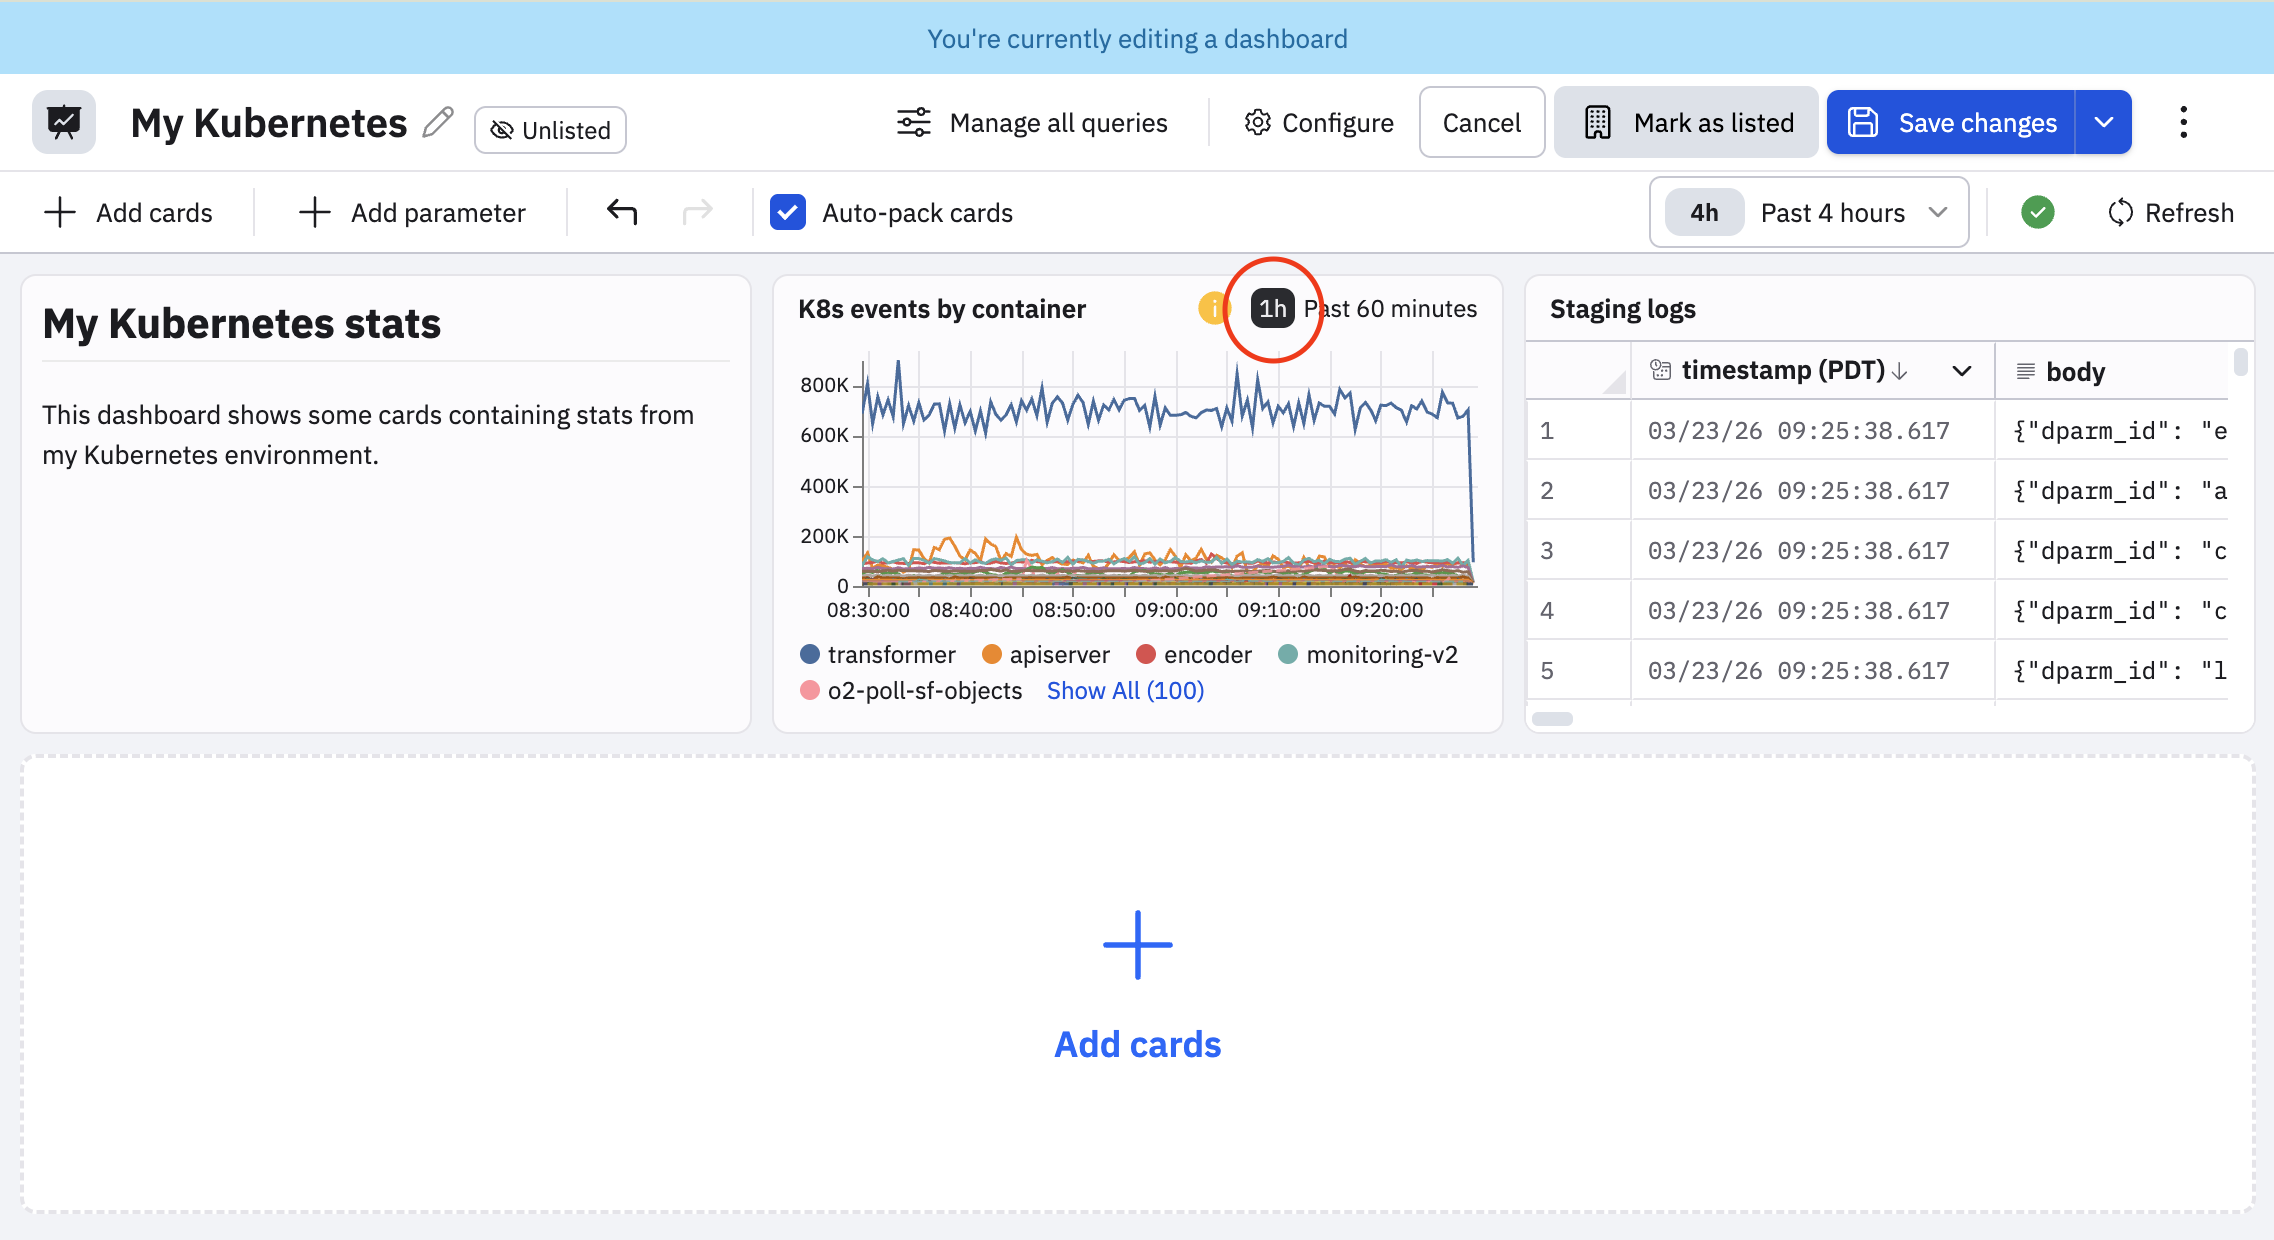
In this example, let's sat we want the k8s events by container card to use a different time window than the 4 hour windows being used by the dashboard. Perform the following steps to configure a custom time window for this card:
- Edit the card.
- Click the Use custom time checkbox.
- In the time picker, select the time window you want this card to use, such as 1 hour.
- Click Apply.
The card now shows the custom time window you configured:
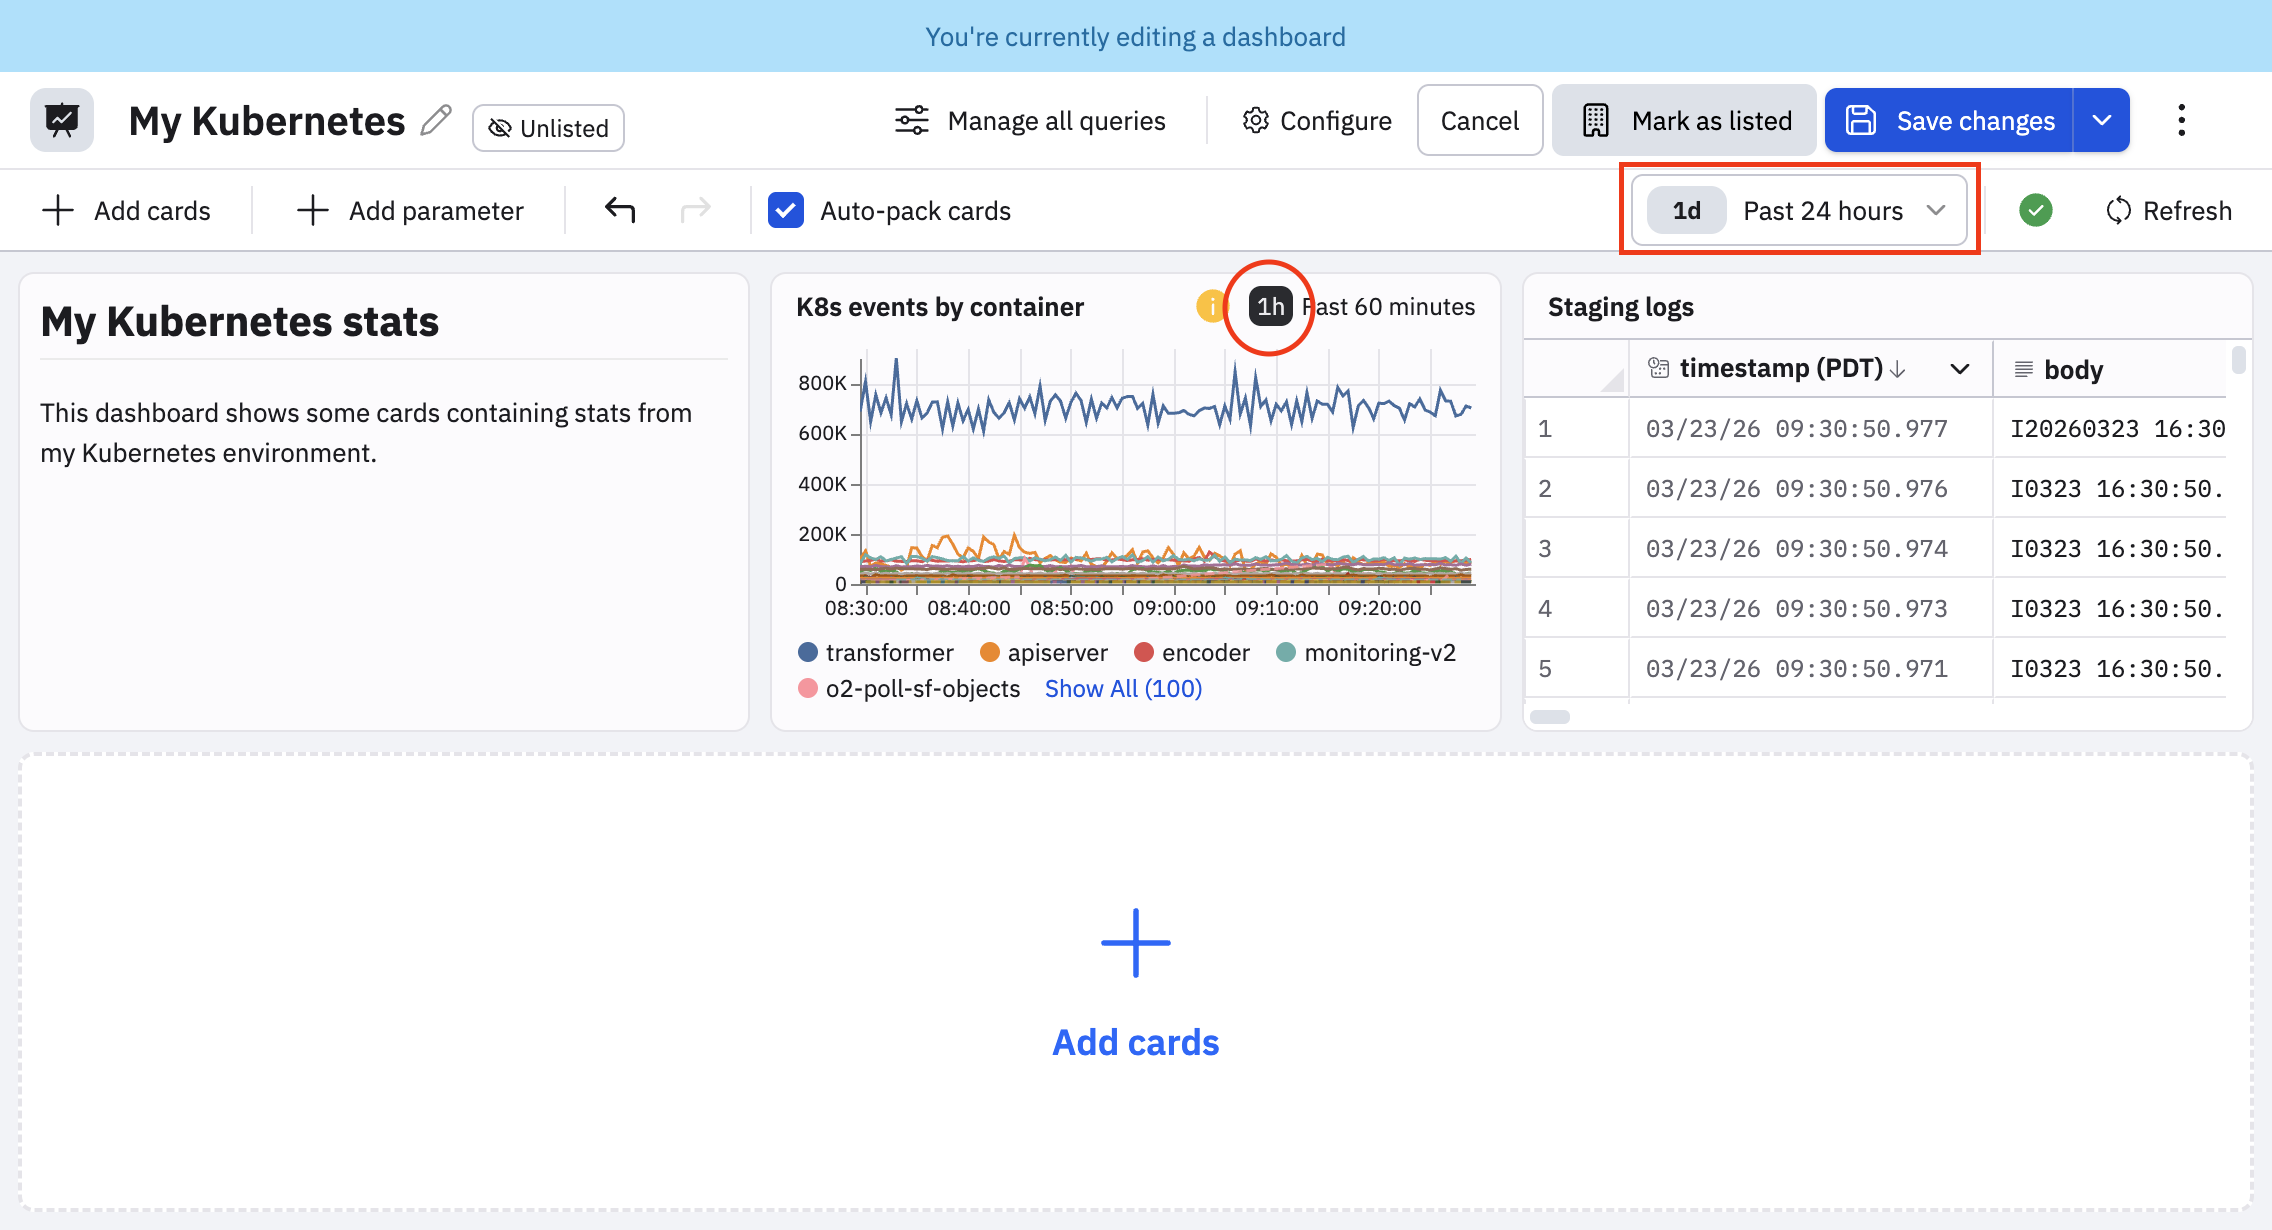
Custom time ranges remain fixed even if you change the time window on the dashboard. For example, suppose we change the dashboard time window from 4 hours to the past day (24 hours). The custom time window for the card remains 1 hour.
To remove a custom time window, perform the following steps:
- Edit the card.
- Deselect the Use custom time checkbox.
- Click Apply to save.
Use timeshift to view historical data
You can configure timeshift on a card to view historical data for your query by overlaying a second visualization of a time window that is shifted by seconds, minutes, days, hours, or weeks.
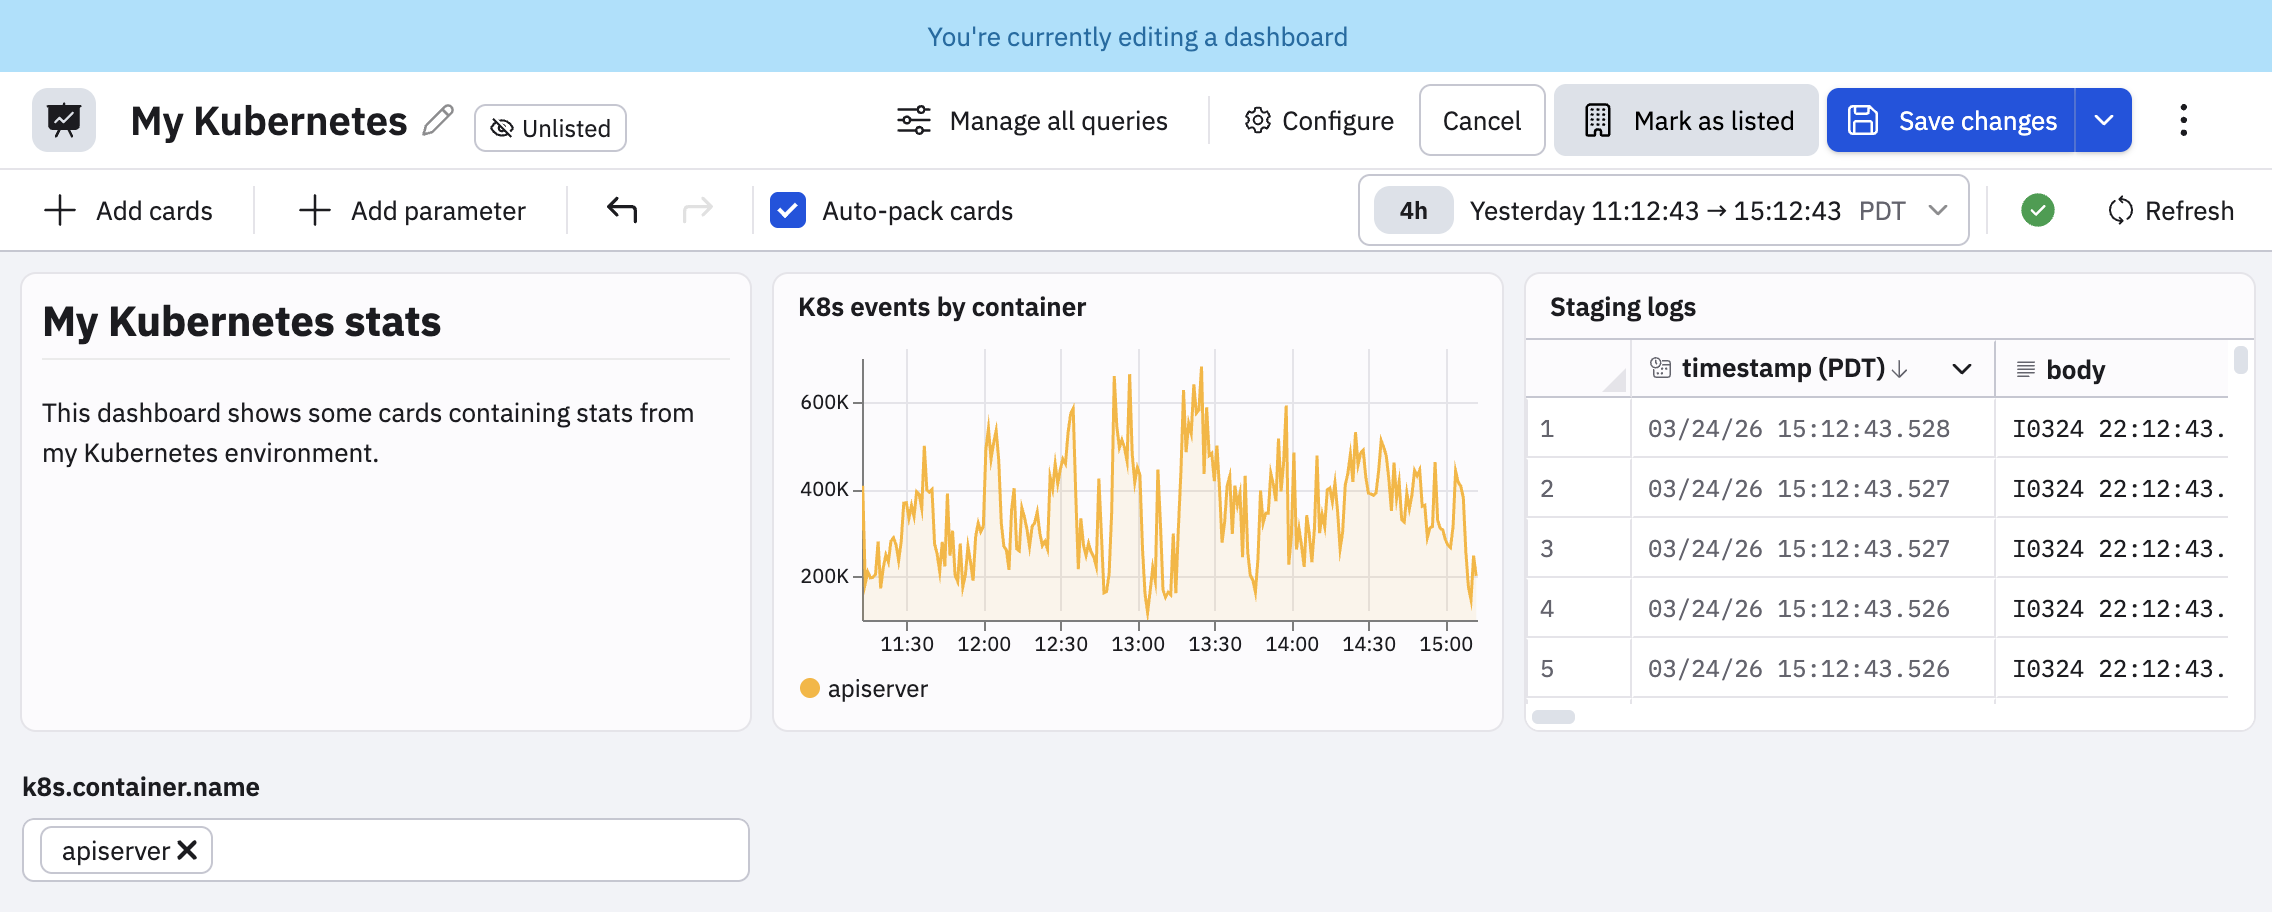
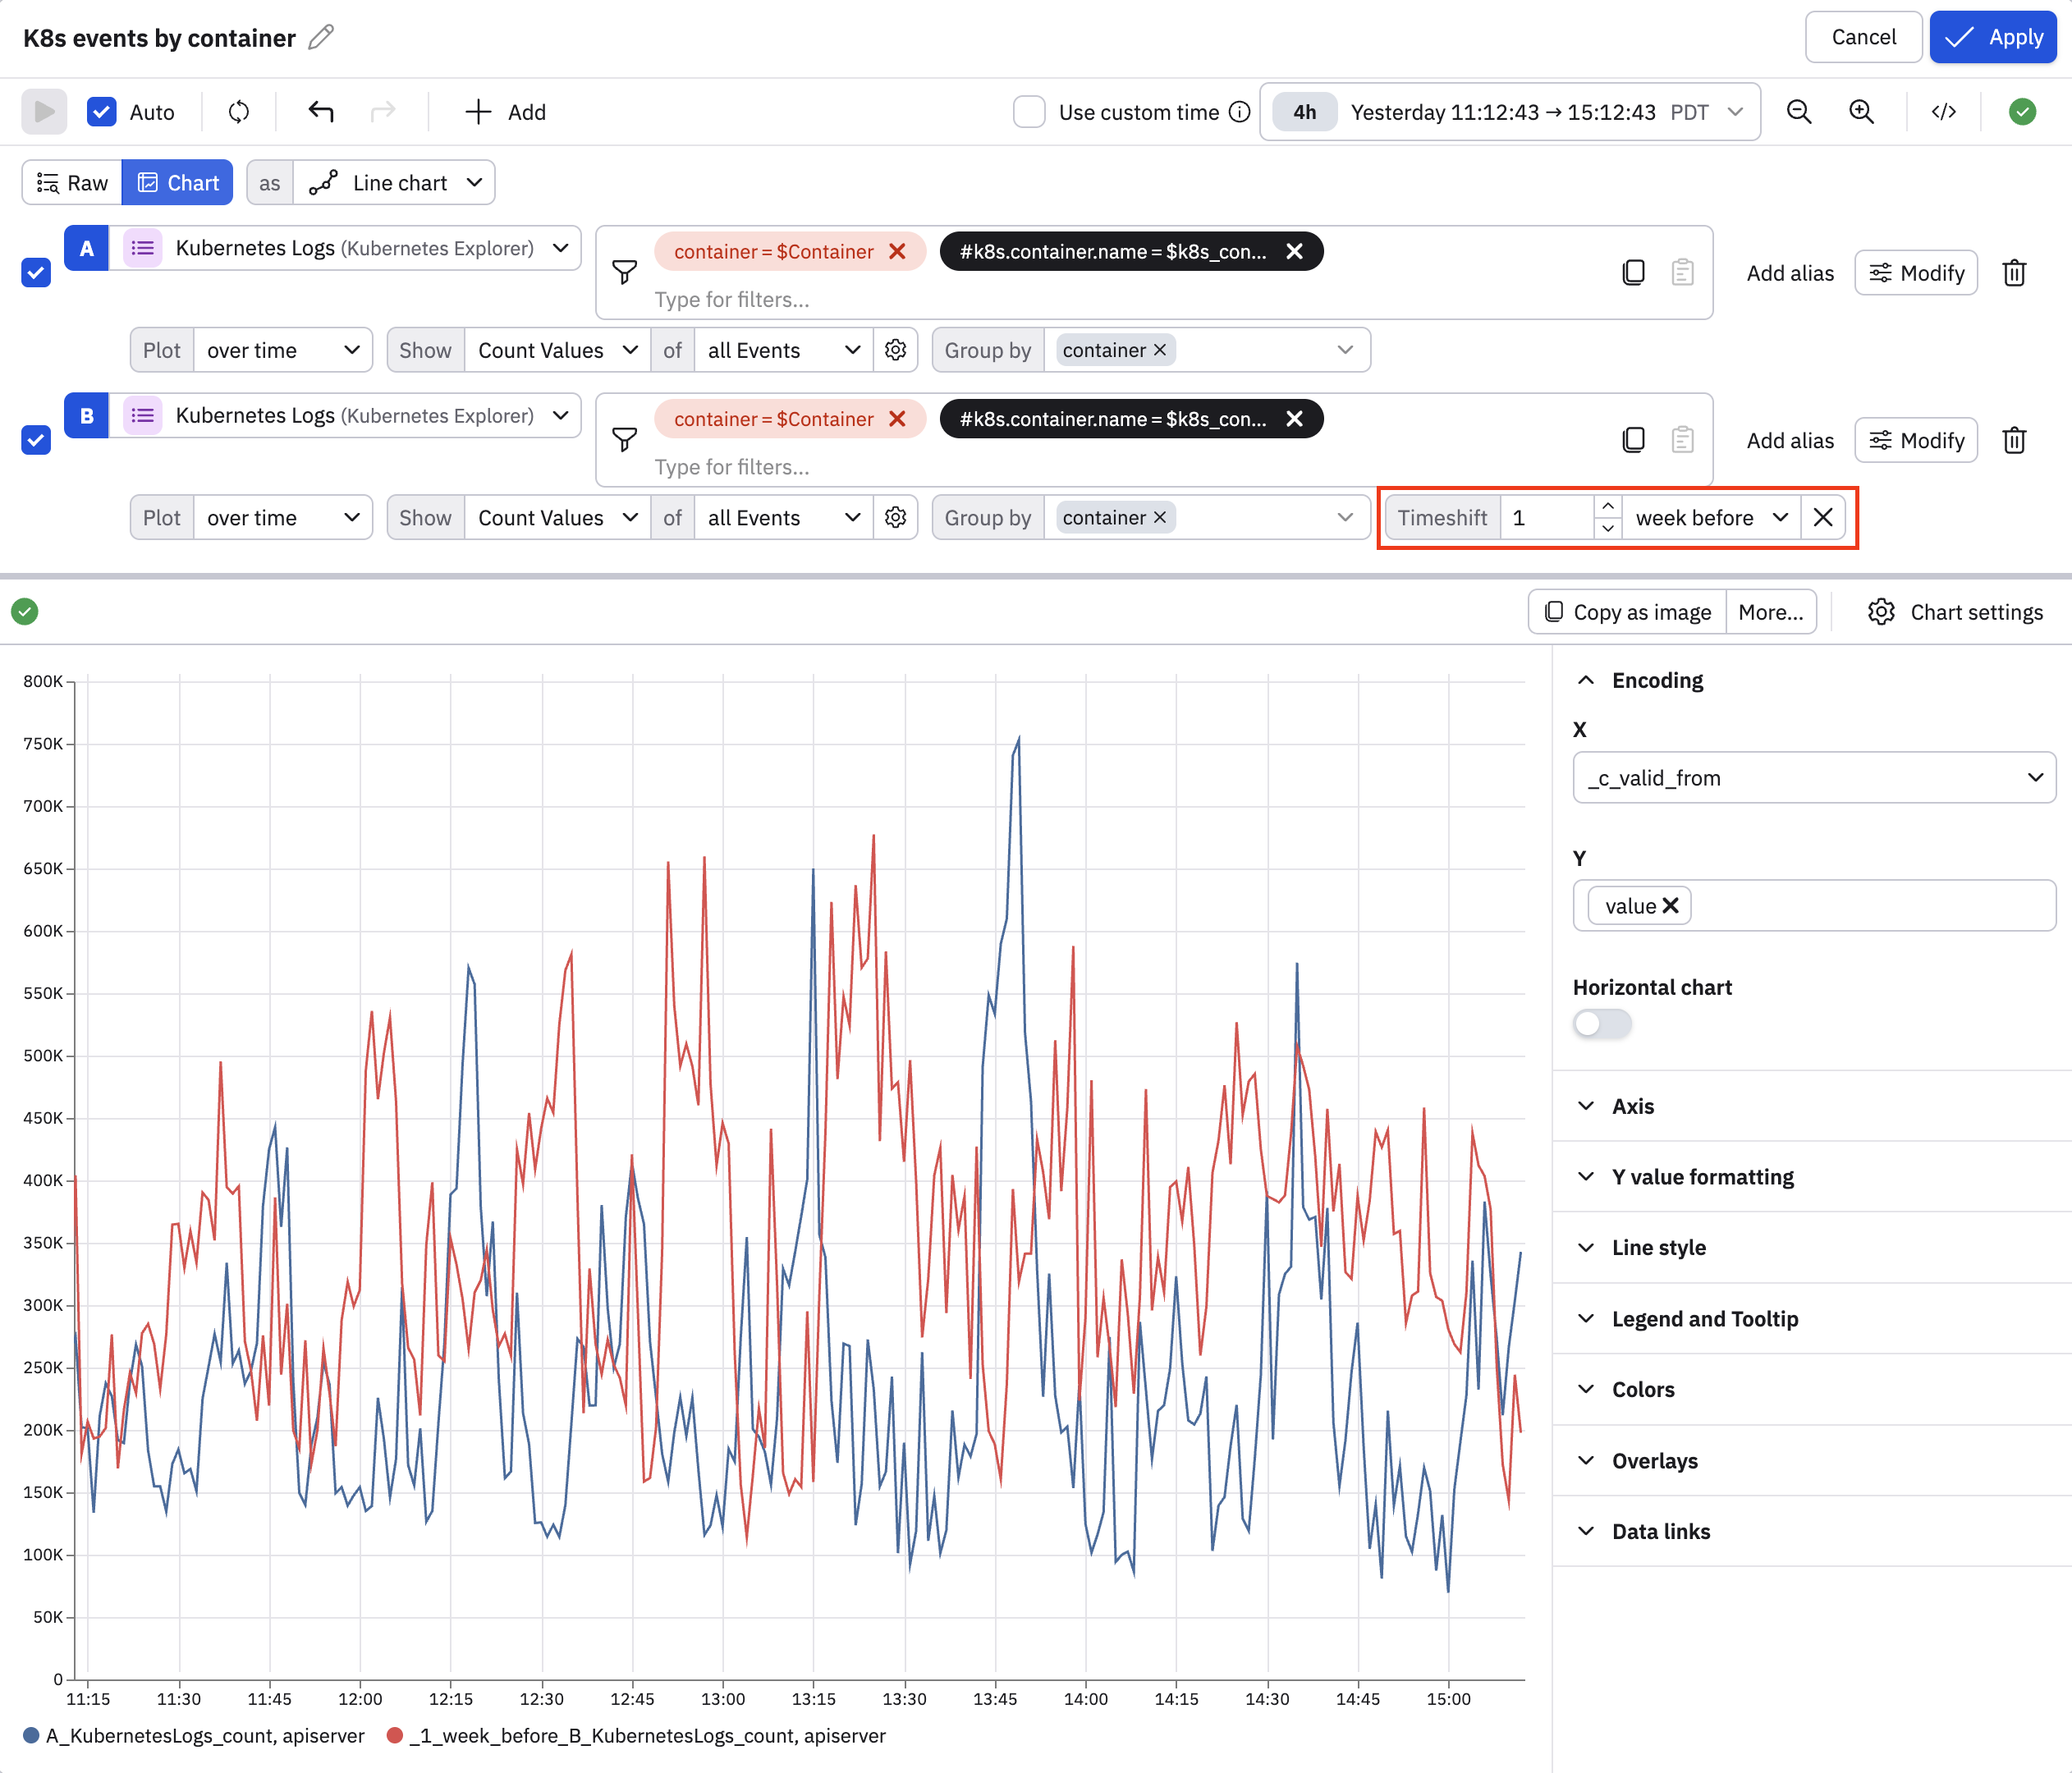
In this example, we are using a dashboard parameter to should only apiserver events in the K8s events by container card. Let's edit the card so that we can compare the data from the current 4 hour window so the same data one week earlier.
Perform the following steps to configure timeshift:
- Edit a card with a visualization.
- In the query/filter bar, select Modify > Compare to time before to make a copy of the existing query.
- Configure the timeshift window in the Timeshift field. In this case, we select 1 week before.
The chart now shows two lines, one for the current 4 hour window, and a second for 1 week earlier:
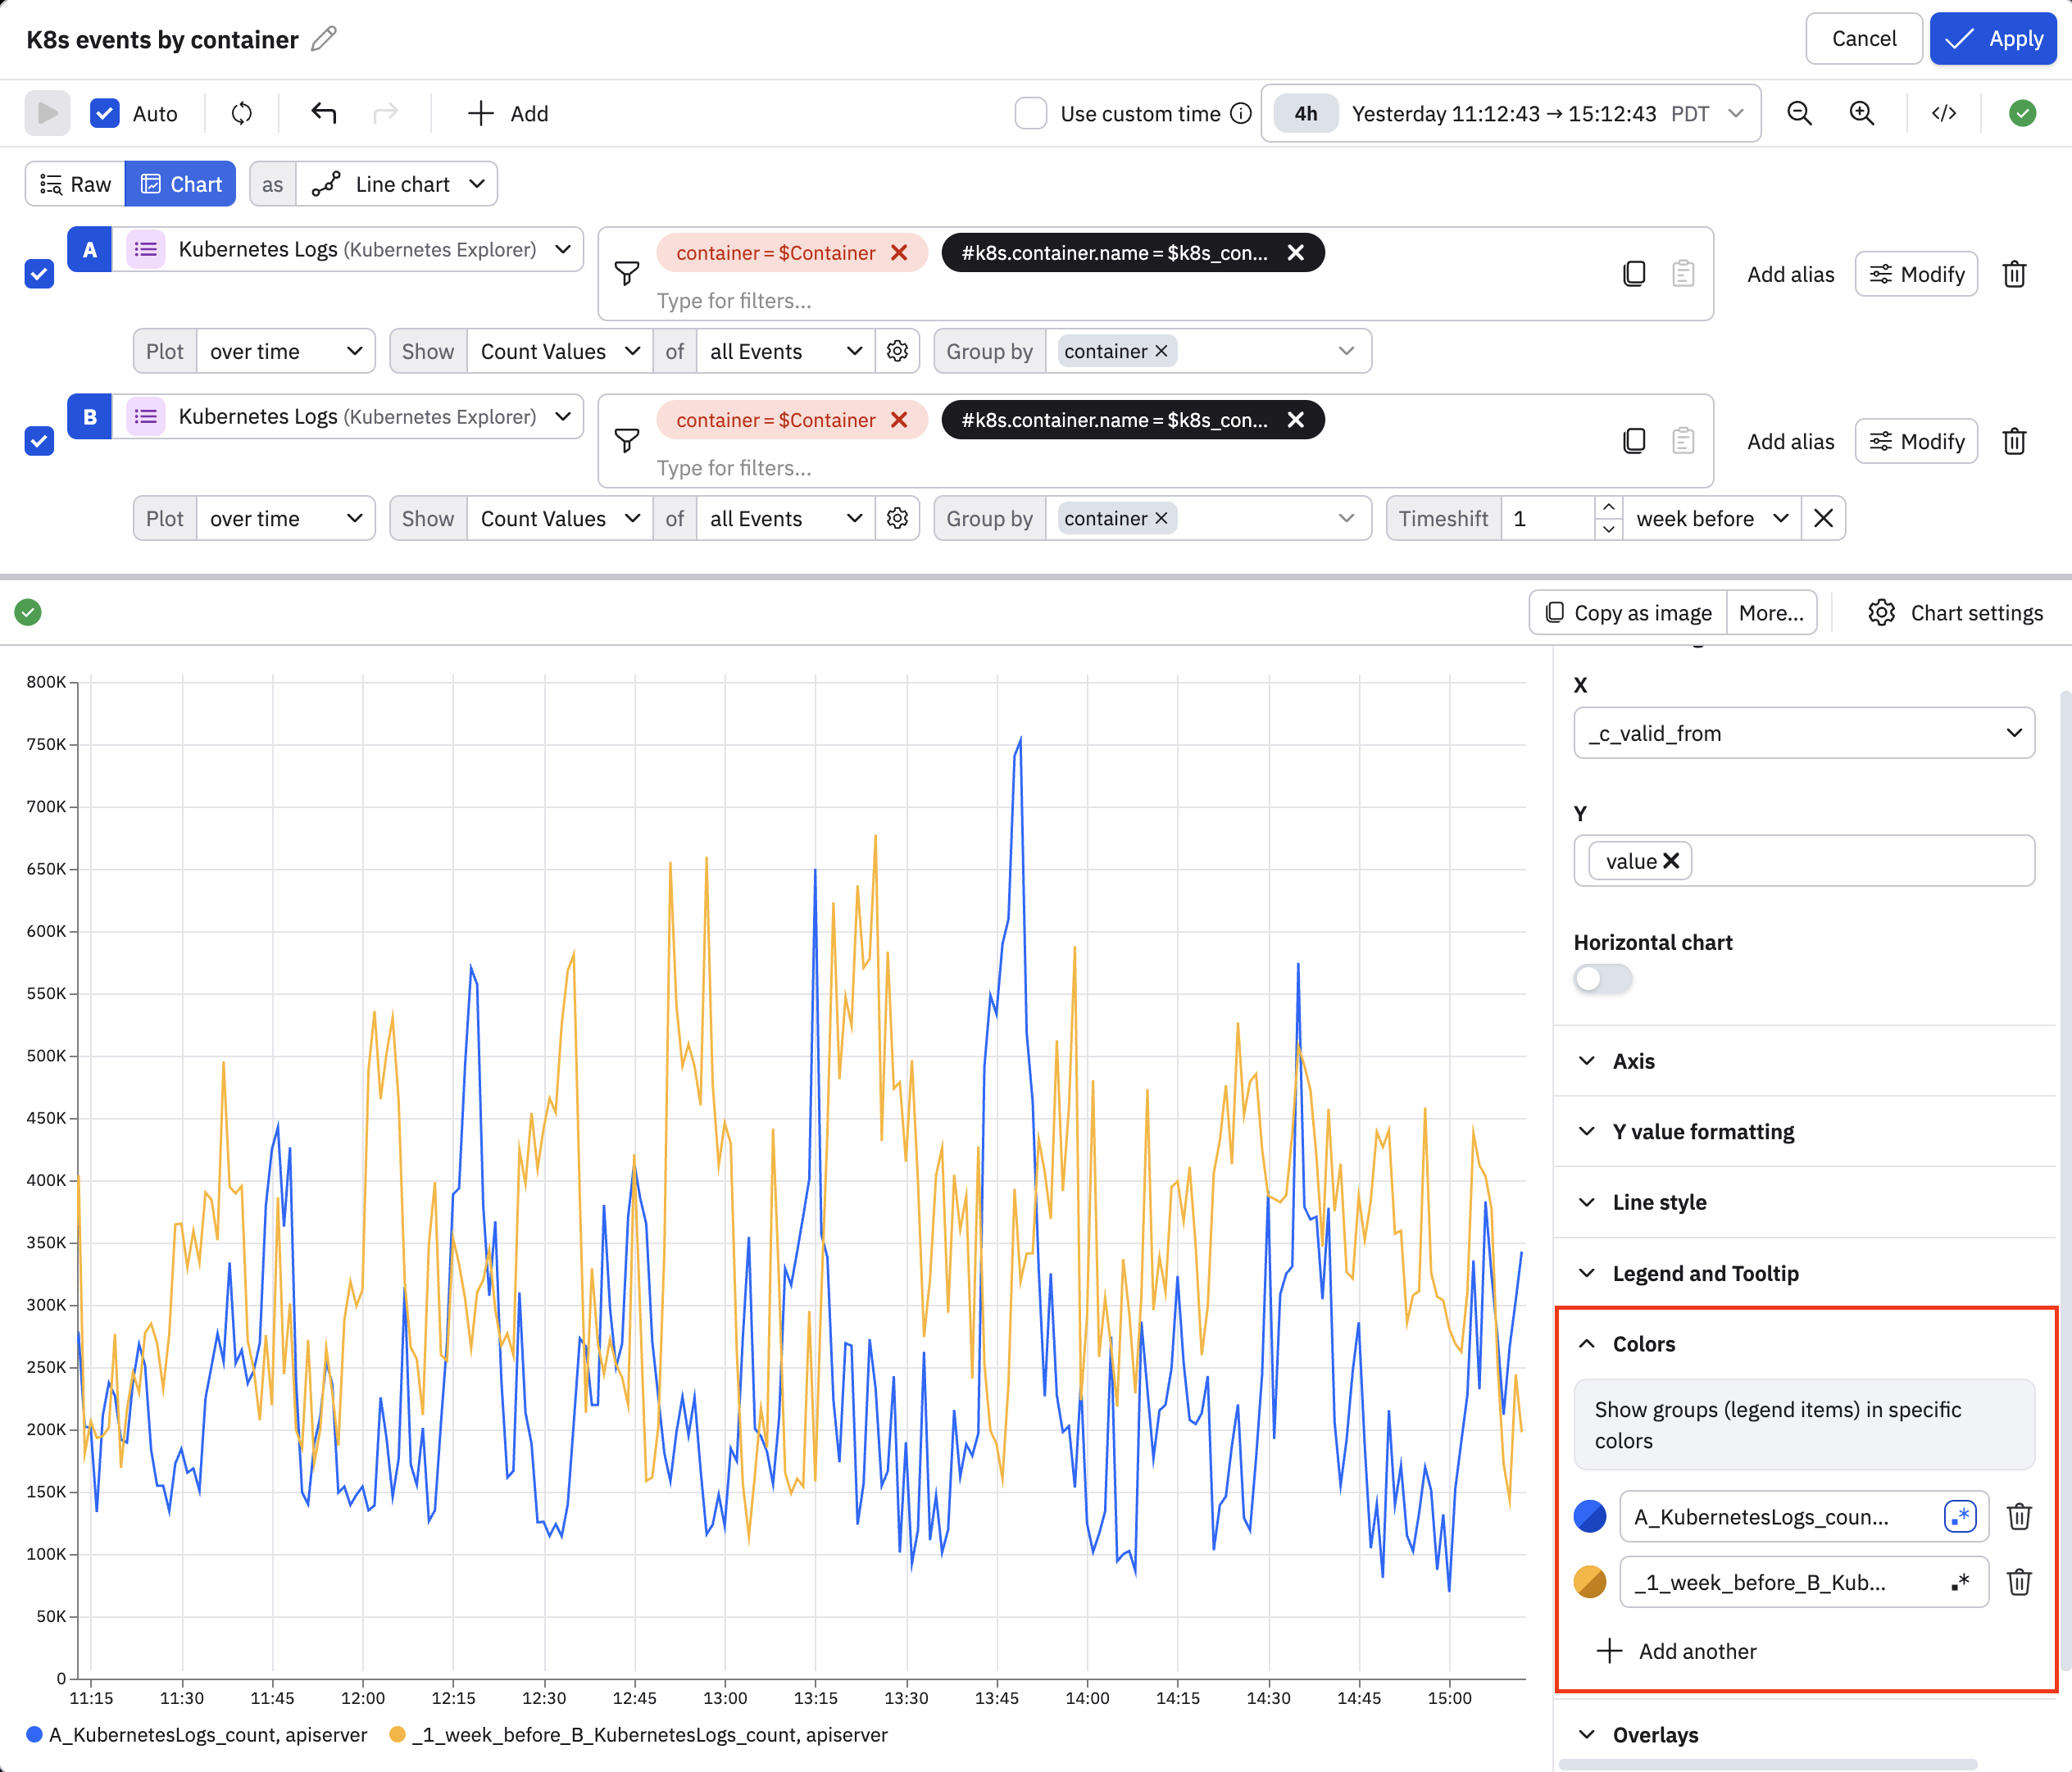
You can open the Color section inside the chart settings to customize the visualization.
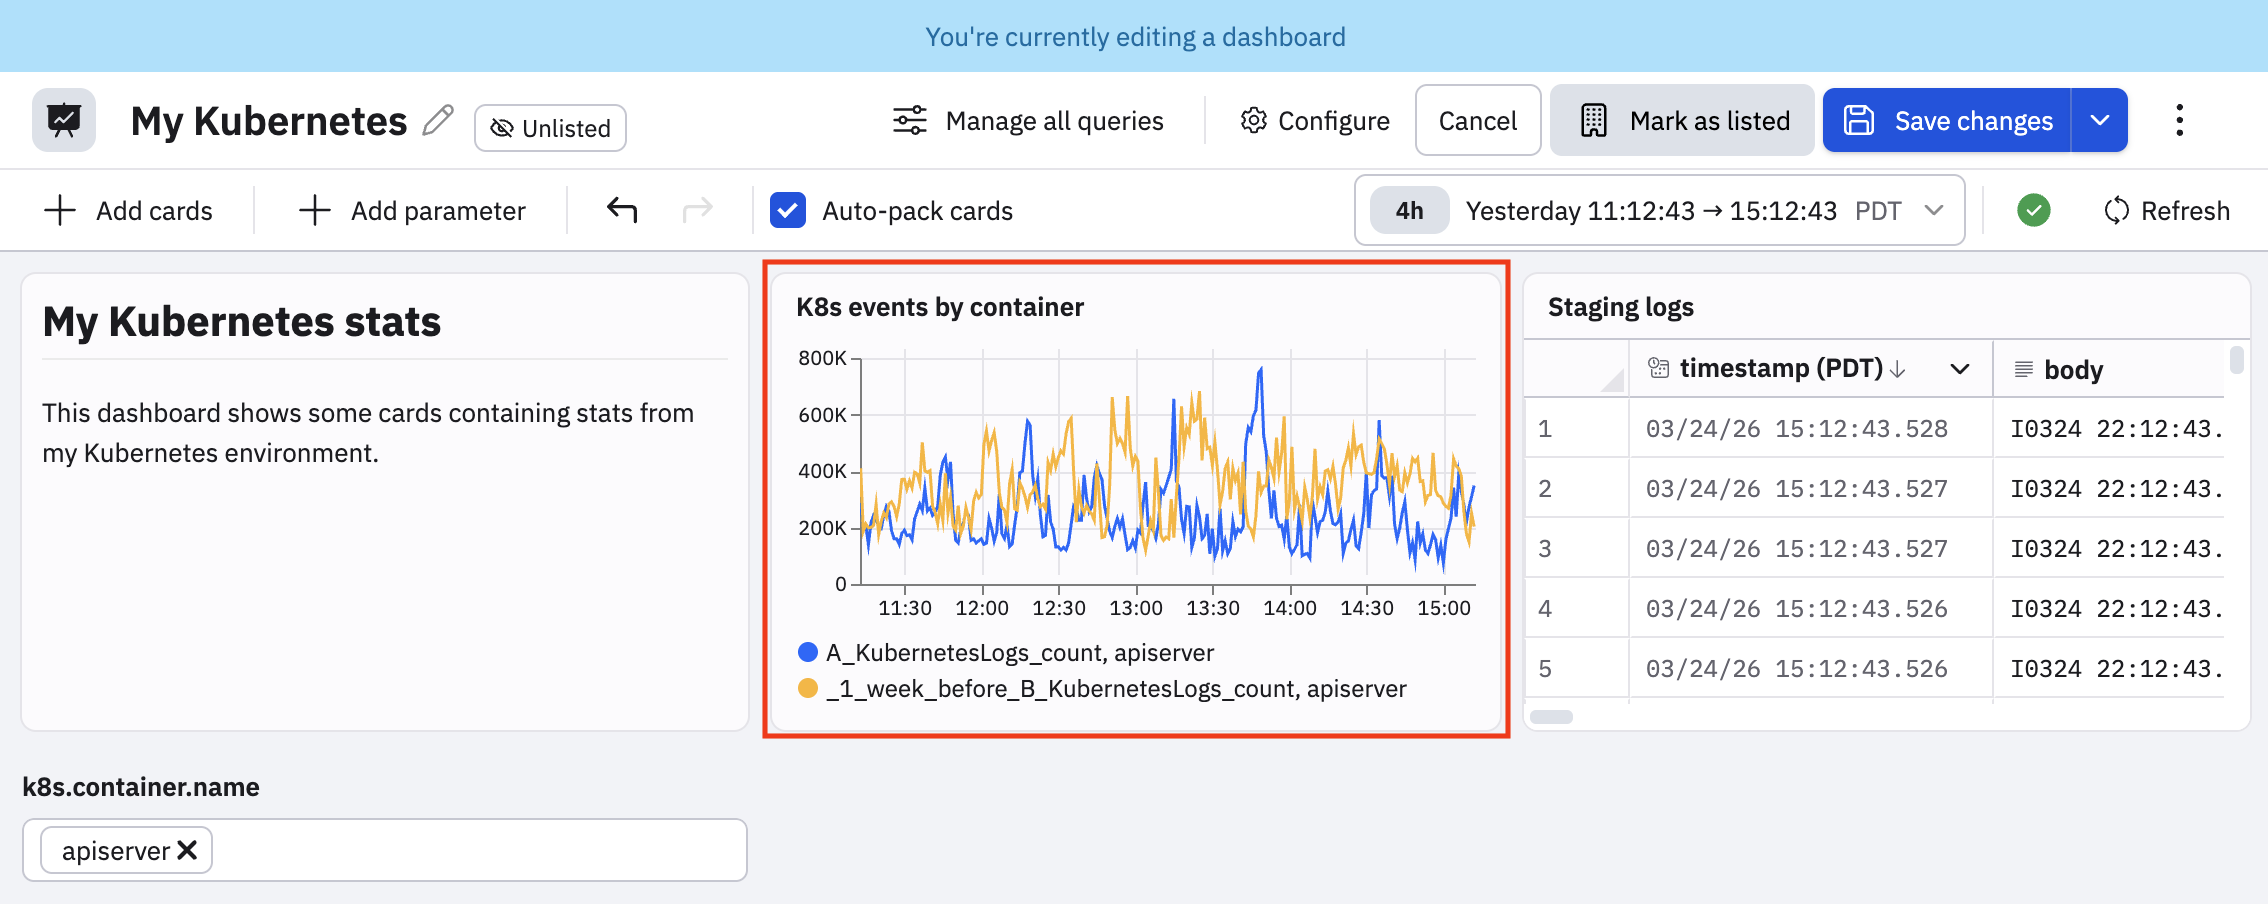
Click Apply to save your changes, then view your updated card on the dashboard:
Updated about 2 months ago