Create dashboard links
Learn how to create dashboard links to pivot from your dashboard cards to other destinations.
You can link dashboards together using custom dashboard drilldowns to support troubleshooting workflows where you need to view multiple dashboards or traverse from dashboards to external URLs.
Types of dashboard links
You can create the following types of links in your dashboards.
| Link type | Description |
|---|---|
| Card links | Allow you to pivot from a dashboard card to another destination. You can create card links when editing a dashboard, and the links are available only when viewing the card in a dashboard. See Create card links. |
| Data links | Allow you to pivot from data to another destination, while passing the chart context and the parameter or filtered Dataset filters from the source page. You can create data links from the visualization settings when editing a dashboard card. See Create data links. |
| Text links | Allow you to create text links on a text card on a dashboard. |
You can create dashboard links to any of the following destinations:
| Destination type | What it opens |
|---|---|
| Dashboard | Another Observe dashboard (with parameter mappings into the destination dashboard’s parameters). |
| Link | An arbitrary URL (external or internal), with optional query parameters from mappings. |
| Log Explorer | Log Explorer for a target Dataset, with mappings into explorer filters / context. |
| Trace Explorer | Trace Explorer for a target Dataset, with mappings into explorer filters / context. |
| Metrics Explorer | Metrics Explorer for a metric/Dataset context. |
| Service Explorer | Service explorer (APM-style navigation). |
Create card links
Perform the following tasks to create a card link:
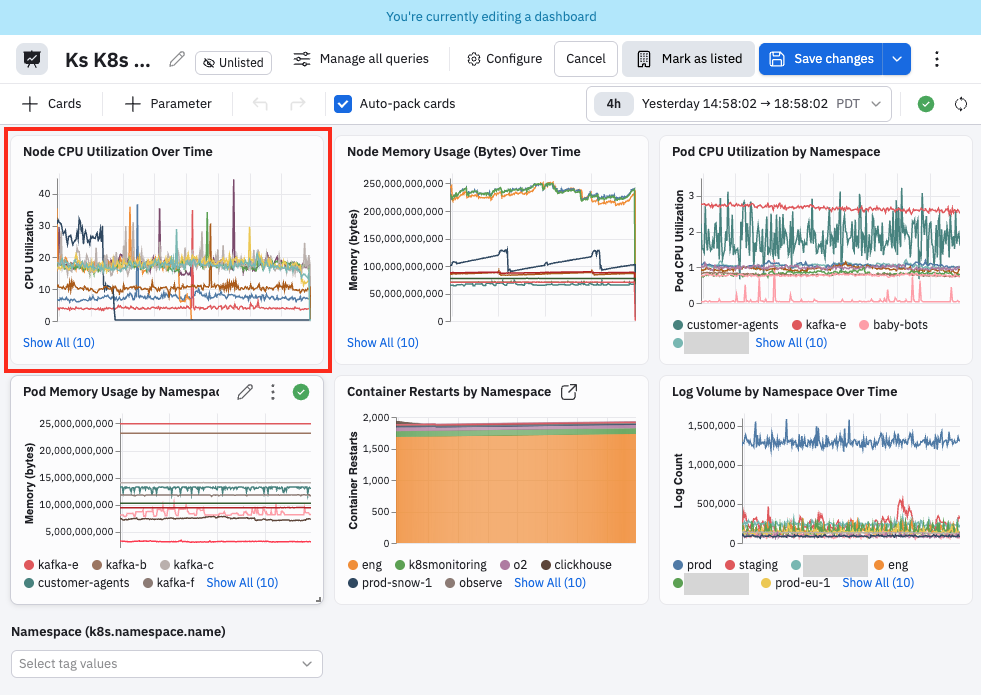
- Edit any dashboard.
- On any dashboard card (not a text card), click the vertical ellipsis icon (), then select Add card link.
- Select the destination, then specify a label for the link. By default the label is the name of the target component, so if you are linking to a dashboard, the label is the name of the destination dashboard. In case you create multiple links, the label helps you easily identify the destination for each link.
- Provide additional configuration context for the link. These options differ depending on the type of link you are creating. For example, if you are linking to another dashboard, you can include your dashboard parameters. If you are linking to Log Explorer, specify the tags that the linked logs must contain.
- Click Add.
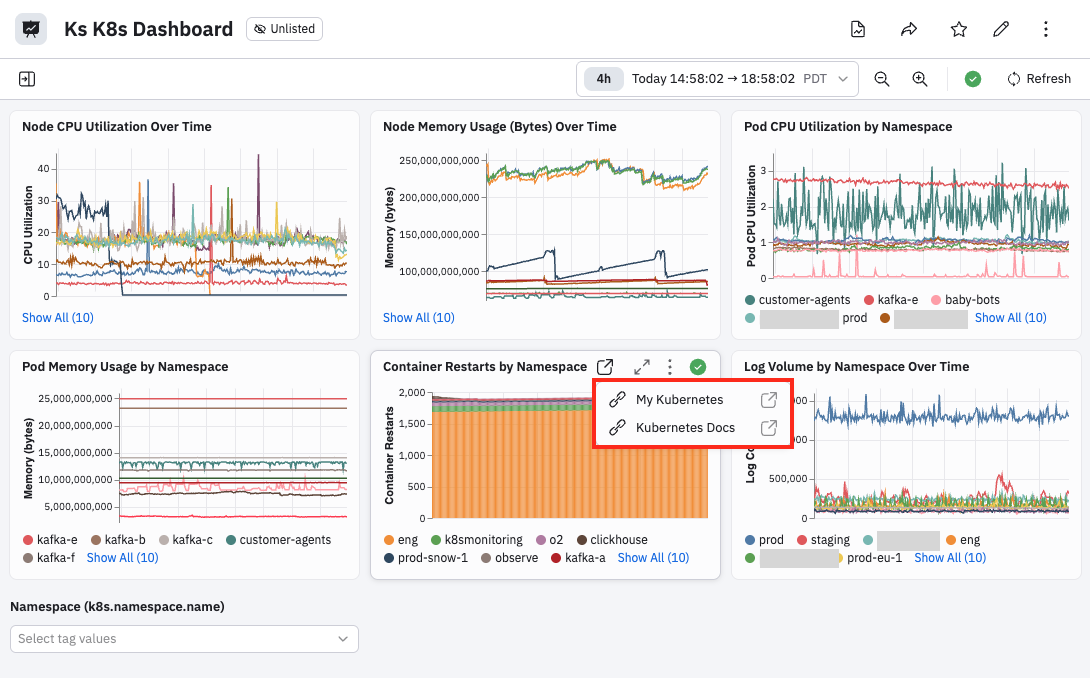
Card links appear as a link icon () at the top of the card. Here is an example of a card with multiple links, one to a dashboard called My Kubernetes, and a second link to the Kubernetes documentation:
Create data links
Data links allow you to pivot from data, such as a table row or cell, to another destination, while passing the chart context and the parameter or filtered Dataset filters from the source page.
You can create data links from the visualization settings when editing a dashboard card. In this example, we will pivot from the Node CPU Utilization Over Time card to the Kubernetes logs:
Perform the following steps to create a data link:
-
Edit the dashboard card.
-
Click Chart settings to expand the chart settings sidebar.
-
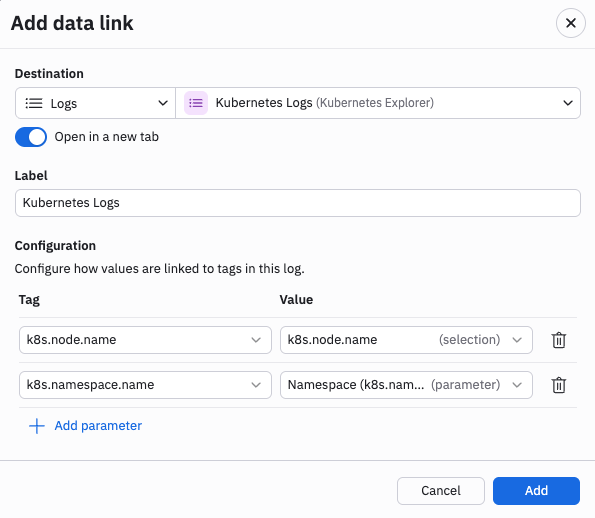
Click Data links > Add link.
-
Select Logs as the destination, then select Kubernetes Logs as the specific log set.
-
Configure the tags and values you want to carry over in the pivot. The Tag column shows you the tags that are available in the destination, in this case, the Kubernetes Logs. The Value column is where you choose the corresponding tag value from your dashboard card. In this example, the destination Kubernetes Logs includes the correlation tags k8s.node.name and k8s.namespace.name, and this dashboard also has the correlation tag dashboard parameter k8s.namespace.name along with a selection data point with the correlation tag k8s.node.name, so Observe is able to link them together. You can see the k8s.node.name is labeled as a selection, and Namespace (k8s.namespace.name) is labeled as a dashboard parameter, from Create a correlation tag dashboard parameter.
-
Click Add.
-
Click Apply in the dashboard card.
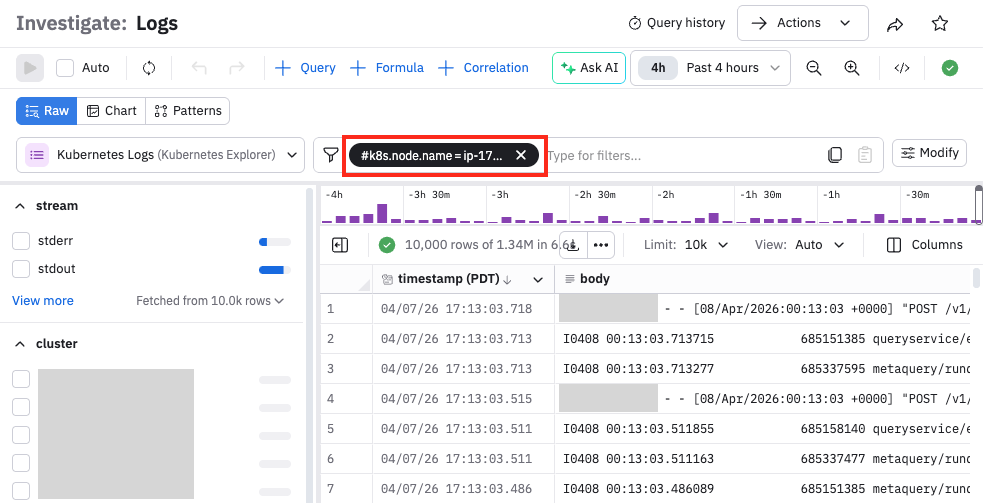
From the dashboard card, we can now examine the chart and pivot directly from the chart to the Kubernetes Logs. Here, we see a spike in this node's CPU utilization, so we can click on the spike and then select Kubernetes Logs in the Data Links section.
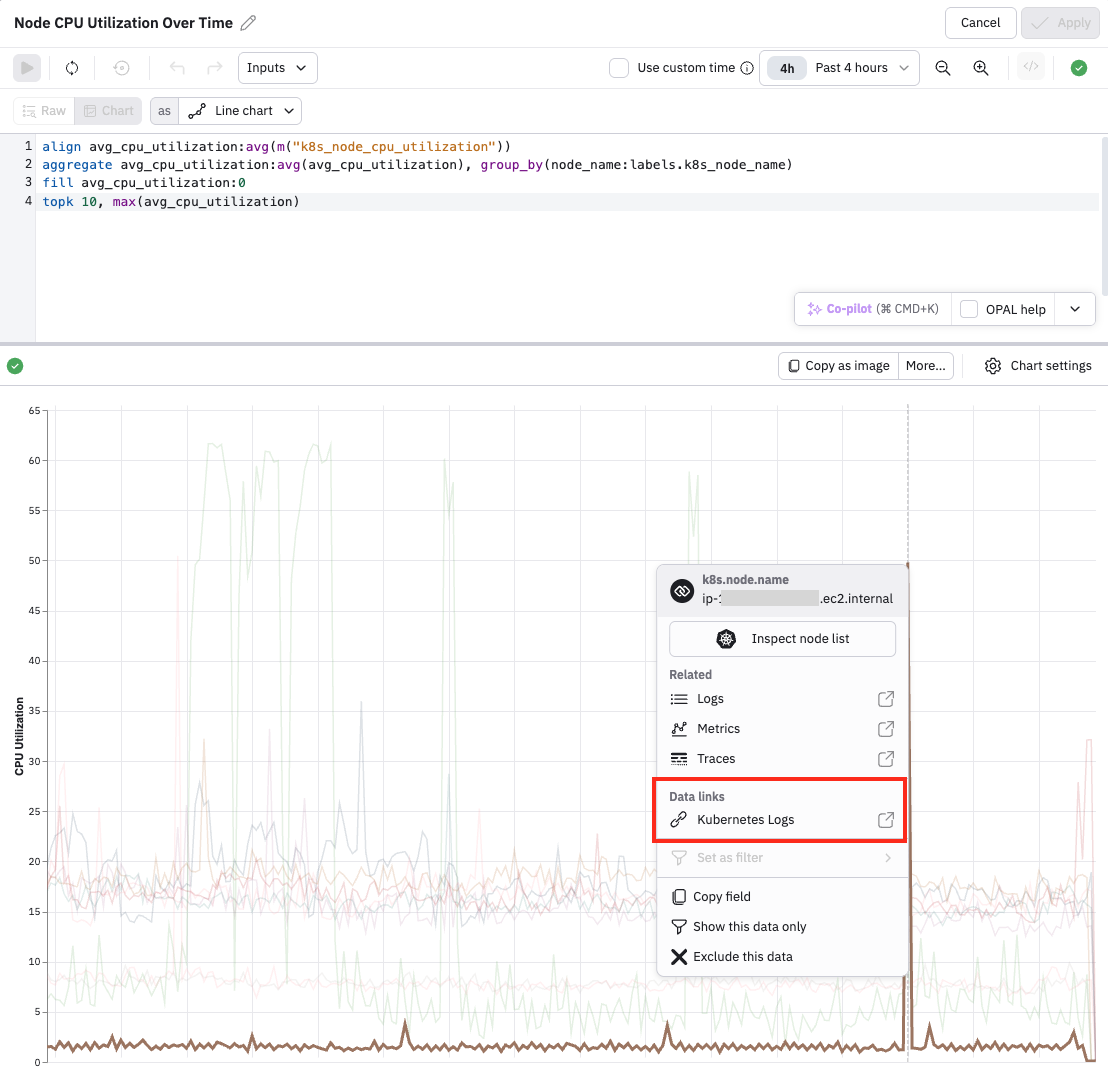
If we click on the data link and pivot to the Log Explorer, we see the k8s.node.name selection is passed with the name of the node whose graph we selected in the dashboard card. The k8s.namespace.name correlation tag dashboard parameter is not passed because we didn't select a correlation tag dashboard parameter in this example.
Updated 3 months ago