Dashboard Explorer
Learn how to view and find dashboards in Observe.
Click Dashboards in the left navigation rail to access the Dashboard Explorer, where you can view a list of all available dashboards on your Observe instance.
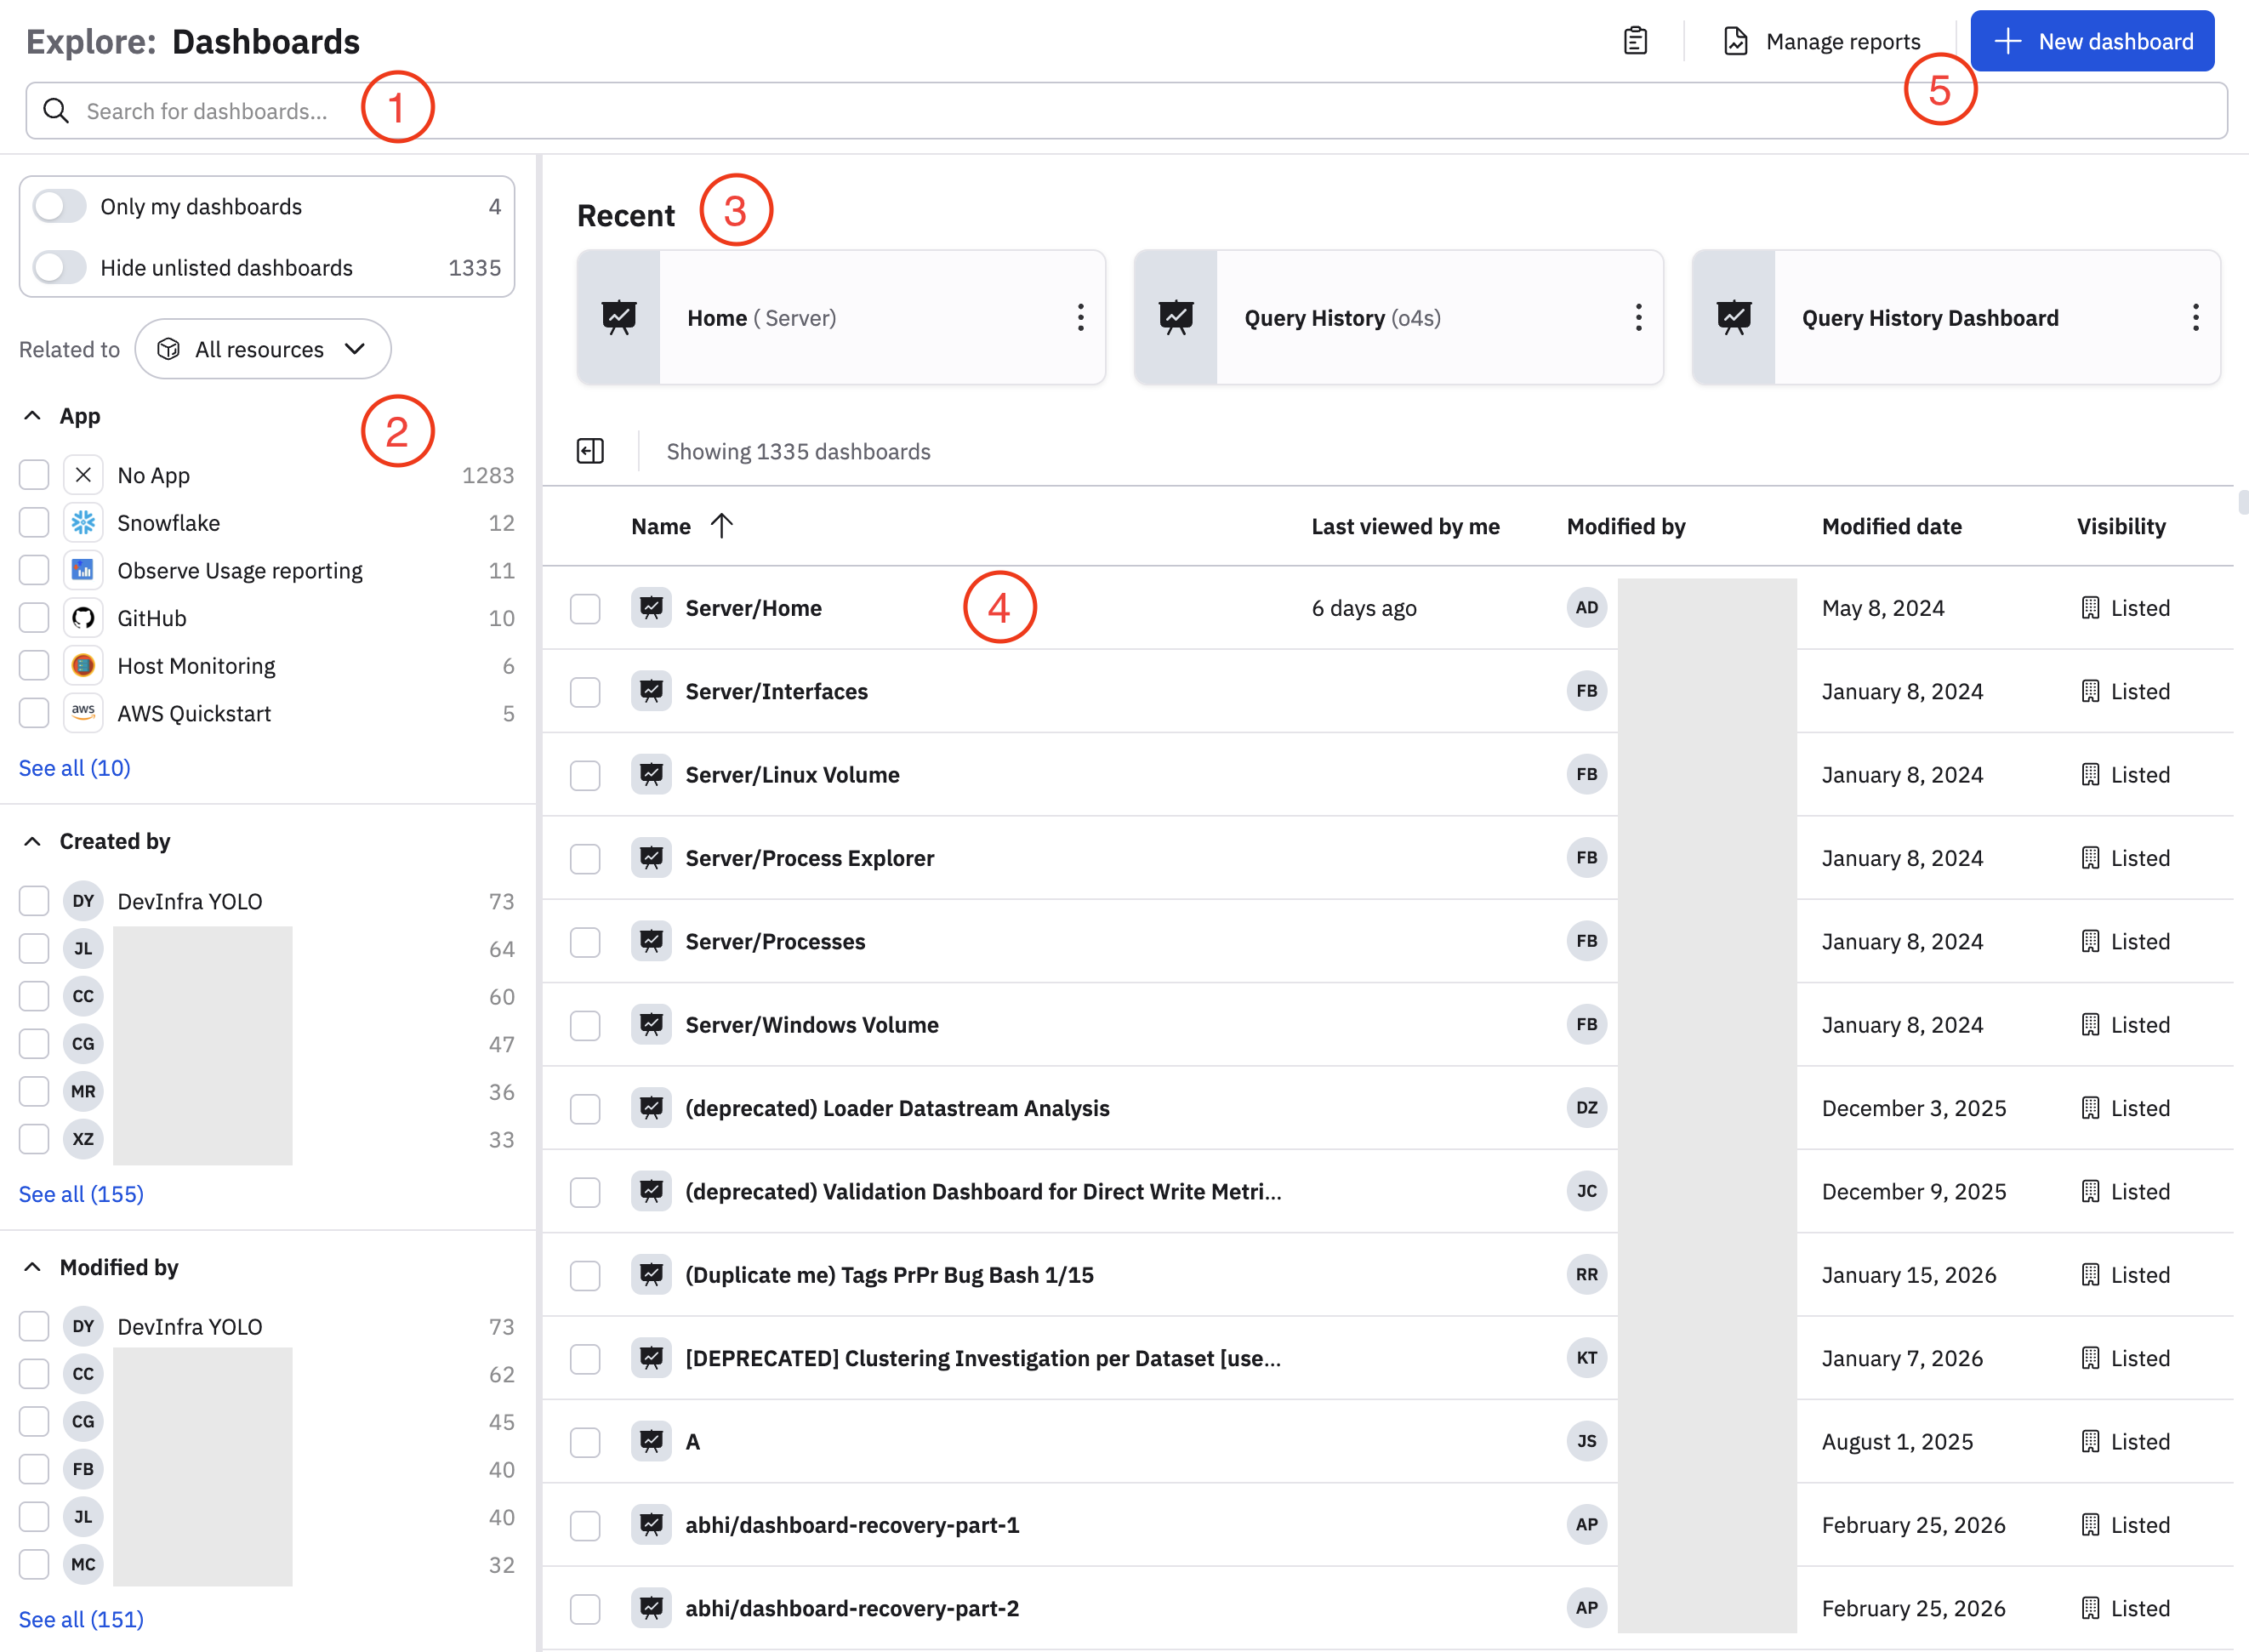
The major components of the Dashboard Explorer are described below.
| Component | Description |
|---|---|
| (1) Filter bar | Use the filter bar to find specific dashboards. To populate the filter bar, you can do any of the following:
|
| (2) Filter panel | The filter panel uses a single Dataset to populate the panel in the left rail of a dashboard. The columns of that Dataset are used to generate filters that can apply to the dashboard cards that use the filtering Dataset. For example, a dashboard displaying container logs can use a filter panel to automatically filter by container log relevant columns such as Cluster, Image, Namespace, and Reason. A card on that dashboard which does not source container logs, such as Git Commit History, is not affected by the filter panel. Select any item in the filter panel to narrow down the dashboards that are listed on the page. Anything you select is also entered into the search bar.
|
| (3) Recent | The dashboards you most recently viewed are listed in this area. If you haven't viewed any dashboards yet, there won't be anything here. |
| (4) Dashboard list | The list of dashboards based on your filter and search criteria.
|
| (5) Reports and new dashboards |
|
Updated 3 months ago