Negative Monitor example: Monitor the health of your front-end proxy ingest spans
Learn how to build a negative monitor for the health of your front-end proxy ingest spans.
In this example, we monitor the ingress span of the frontend-proxy service to generate alerts when there is an absence or lack of activity. Looking for the absence or lack of data or activity is called negative monitoring.
See Negative monitoring for more information.
Create the Monitor from the Trace Explorer
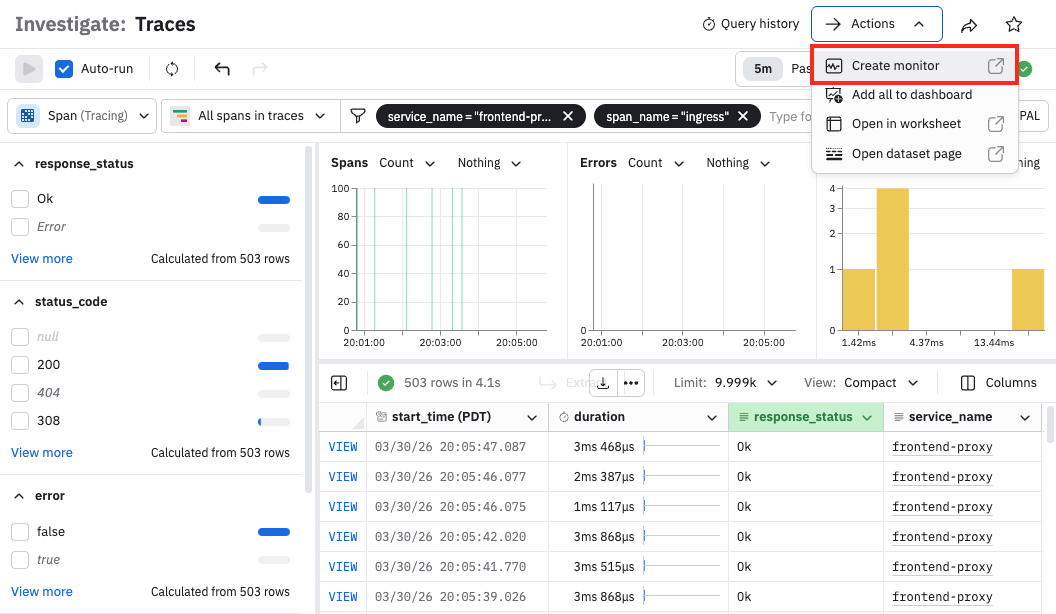
Beginning in the Trace Explorer, we can filter by frontend-proxy as the service name and ingress as the span name. From here, select Actions > Create monitor:
Name and configure the Monitor query
Give the Monitor a name, such as frontend-proxy ingress activity.
In this example, we don't need to make any changes to the query, so we'll leave it alone.
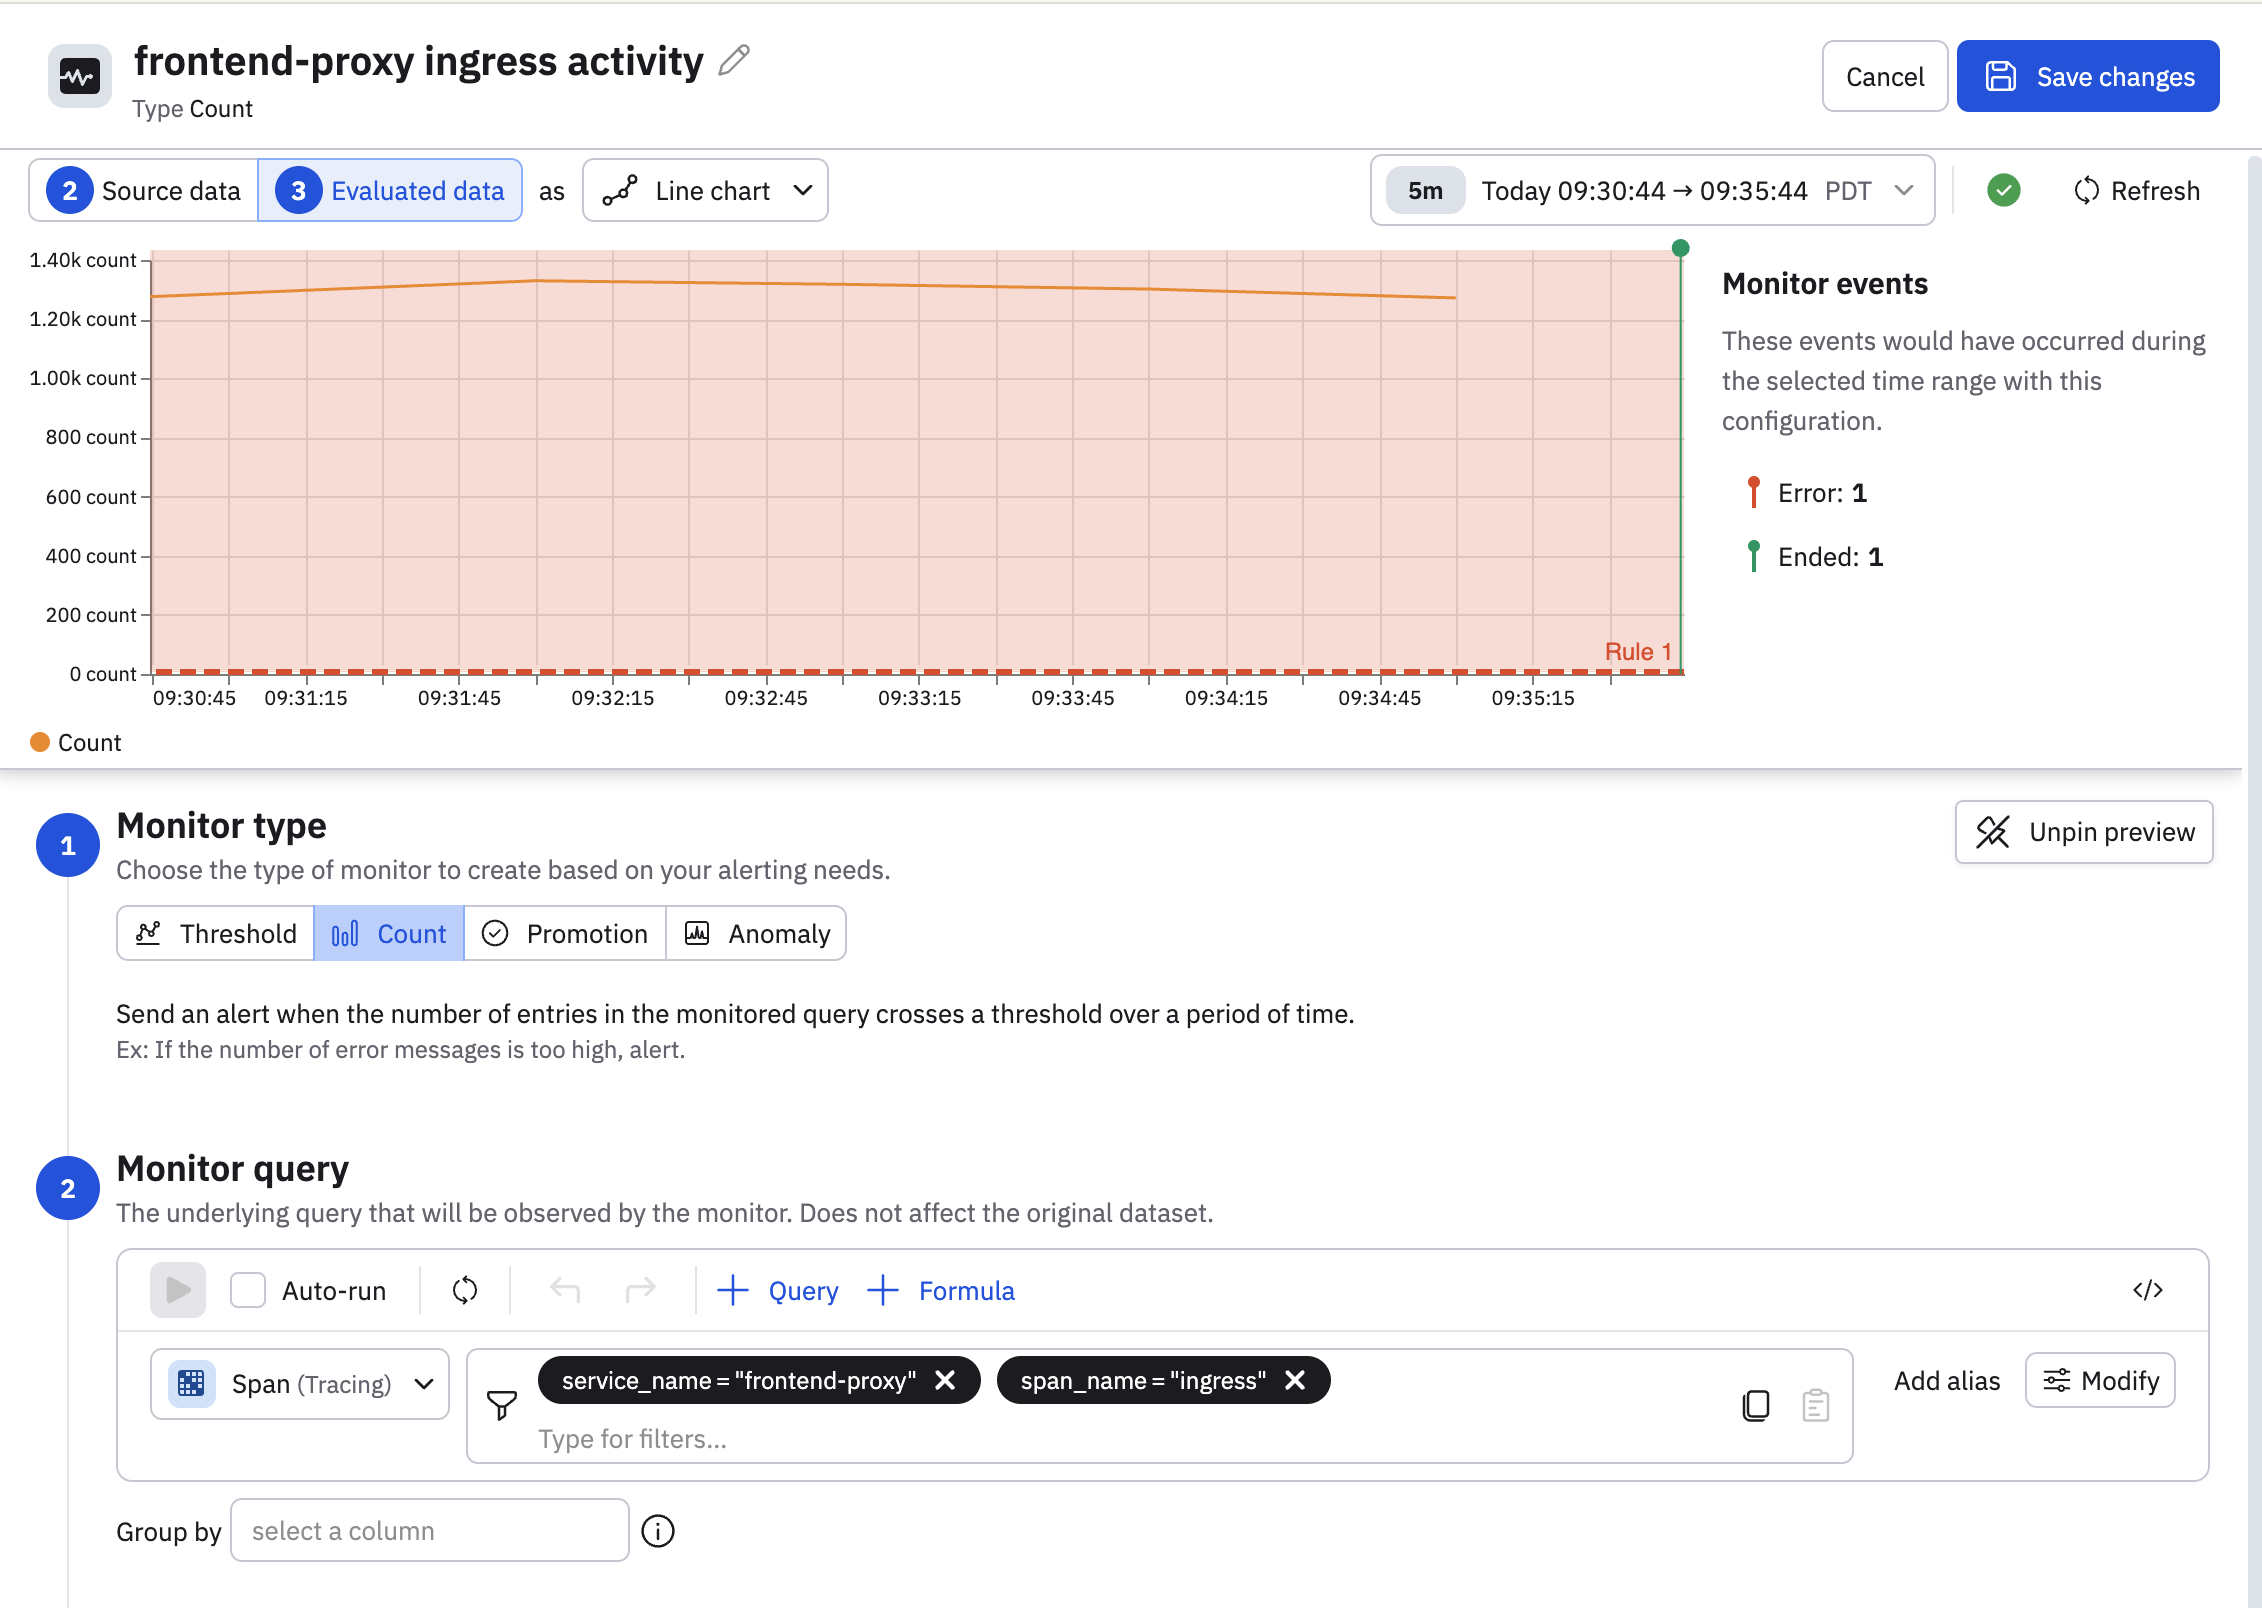
We can progress to defining the evaluation criteria and rules.
Define the evaluation criteria
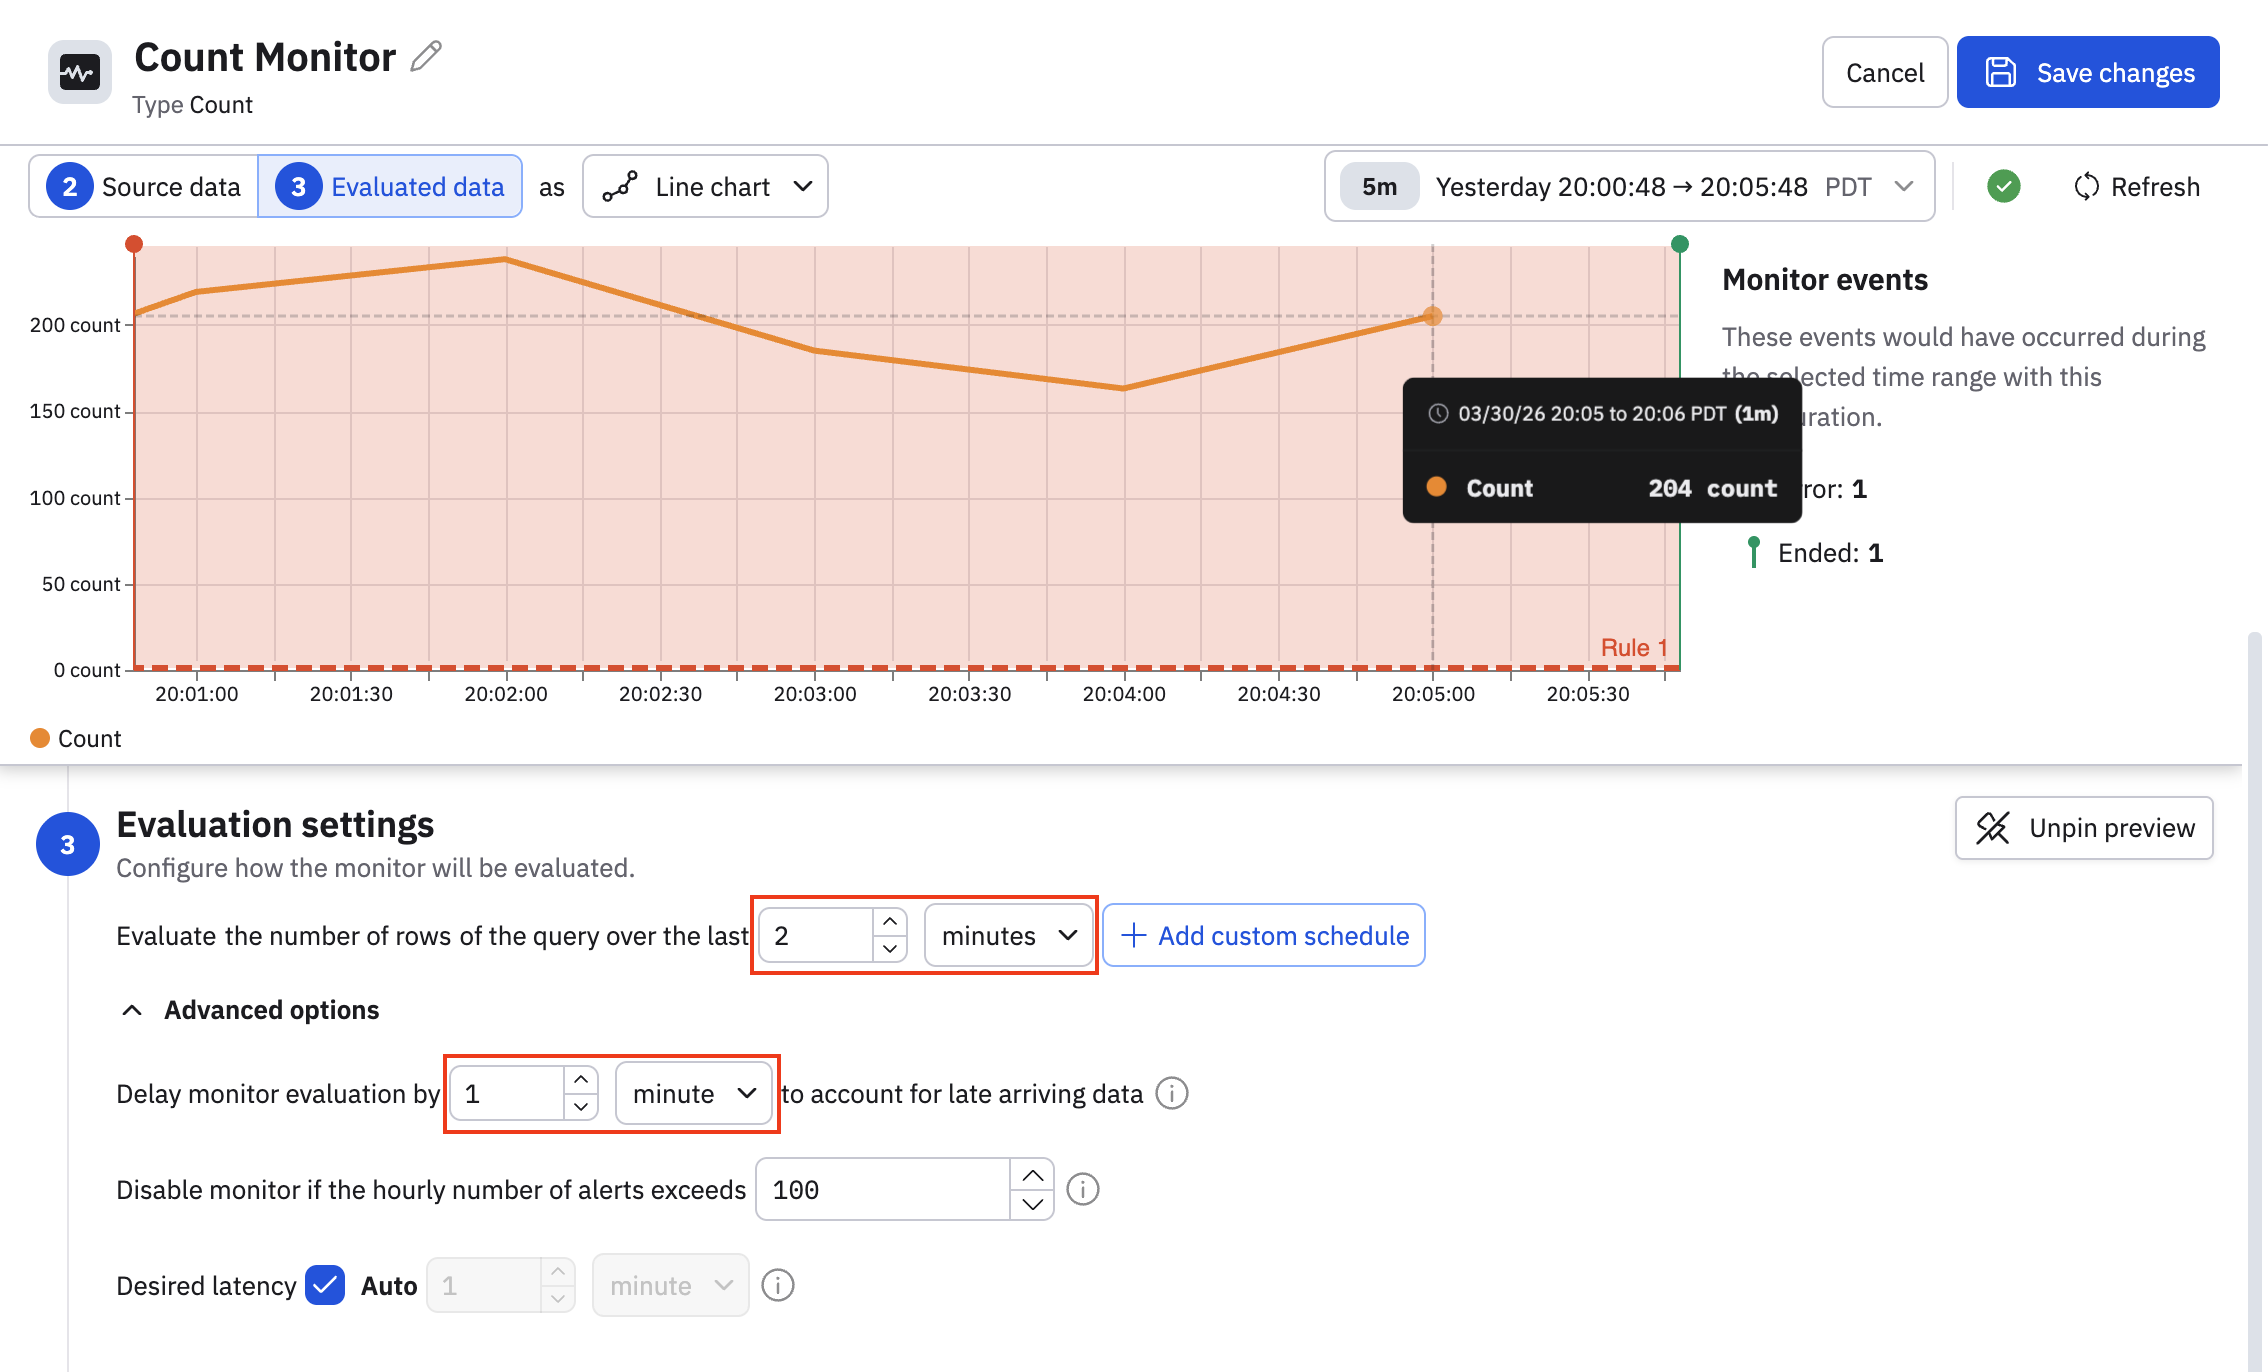
It's important for the frontend-proxy ingress to be consistently available, so we want to change the evaluation window to be smaller than the default 10 minutes:
- Set the evaluation window to 2 minutes.
- Configure a stabilization delay of 1 minute to account for late-arriving data.
To summarize, wait 1 minute before evaluating the data, and generate an alert when there is no data for two minutes.
Configure the rules
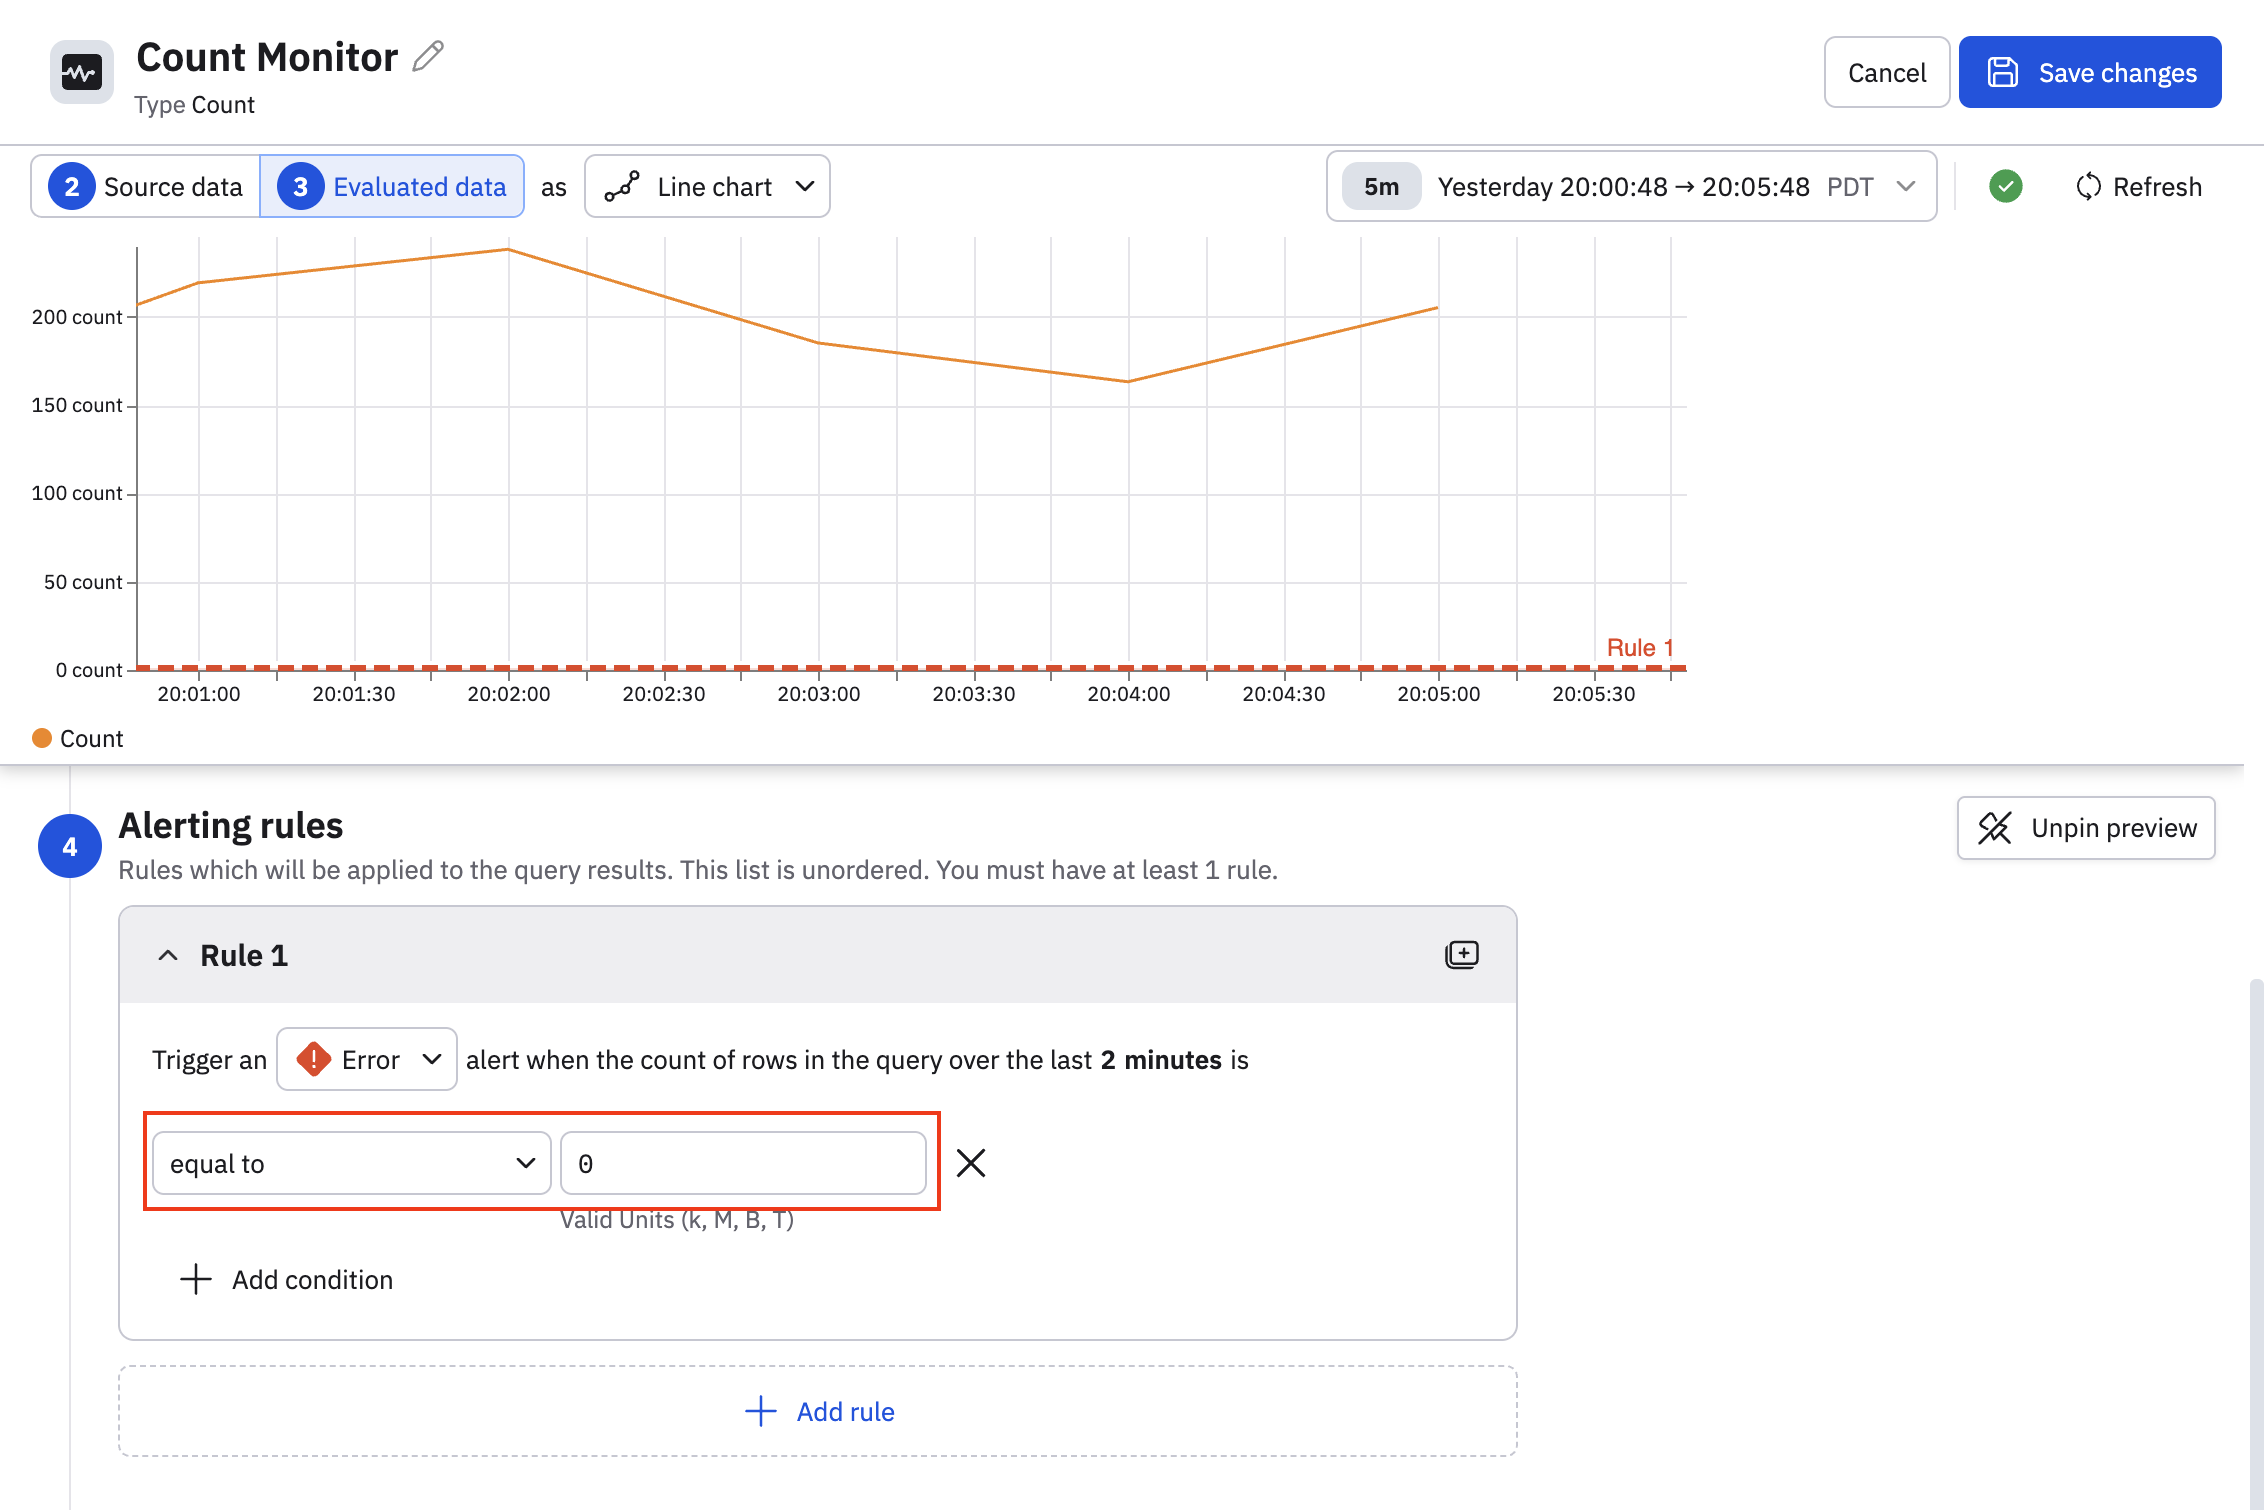
Count Monitors use fill by zero behavior by default, meaning that zeroes are used to fill in the absence of data. This is important to know when we configure the alerting rules in this count Monitor.
In this example, we configure the rule to generate an error if the count is equal to zero over the last 2 minute window, as zeroes here indicate the absence of data.
Complete and save the Monitor
Once you are done with defining the rules, configure the remainder of the Monitor as needed. Give it a description, and define any notification actions you want, then click Save changes to save the Monitor.
Updated 2 months ago