Create Monitors workflow
This page describes how to create Monitors.
How do I create a Monitor?
You can create new Monitors in Observe from the Monitors list, from Explorers and Worksheets, from AI SRE, or using Terraform.
Create a new Monitor from the Monitors list
To create a new Monitor from the Monitors list, perform the following steps:
-
Log into Observe and click Monitoring in the left navigation rail.
-
In the Monitors list page, click New Monitor.
-
Select a Monitor type. See Monitor types.
-
Give your Monitor a name, then complete the configuration in the Monitor creation workflow and important concepts.
Each Monitor must have a unique name within the instance. For v1 Monitors only, you can prepend a name with an App name and a slash for organizational purposes, such as infra/CPU above 75.
See High number of APM service exceptions for an example of how to create a Monitor from the Monitors list.
Create Monitors from Explorers and Worksheets
Monitors can also be created from data browsing, such as Explorers or Worksheets.
- In Log Explorer , click the Action menu at top right and select Create a monitor.
- If the Explorer visualization is raw data, a new Count Monitor creation form will open using this data.
- If the Explorer visualization is a chart, a new Threshold Monitor creation form will open using this data.
- In Metrics Explorer , click the Action menu at top right and select Create a monitor. A new Threshold Monitor creation form will open using this data.
- In Trace Explorer , click the Action menu at top right and select Create a monitor. A new Count Monitor creation form will open using this data. See Monitor the health of your front-end proxy ingest spans for an example of how to create a Monitor from the Trace Explorer.
- On a Worksheet , click the context ellipses menu for a stage and select Create a monitor. Choose the type of Monitor and proceed as above.
Create Monitors from AI SRE
You can ask AI SRE directly to create any type of Monitor for you for any use case, or you can pivot from a chart in AI SRE to create a Monitor.
See Check for CrashLoopBackOff for an example of how to create a Monitor from AI SRE.
Create Monitors using Terraform
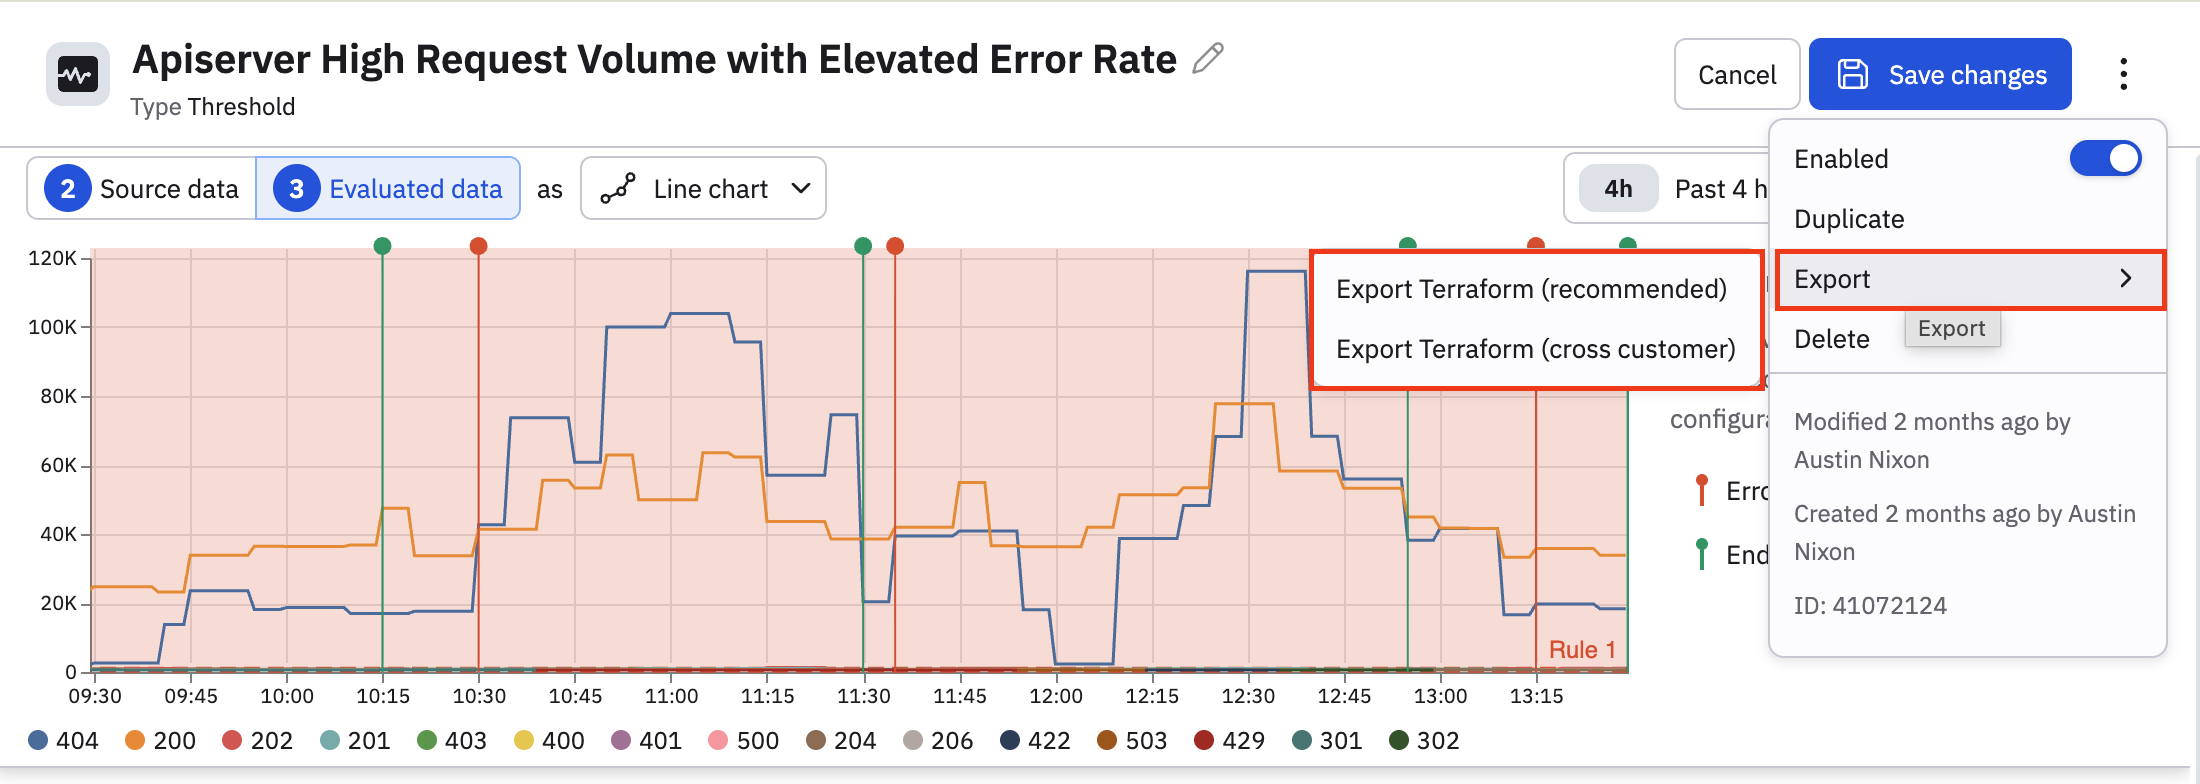
See observe_monitor_v2 in the Observe Terraform Registry to learn how you can create Monitors using Terraform. You can also export and import to Terraform from the Observe UI when you are editing any Monitor:
- Click the vertical ellipsis icon (), then select Export > Export Terraform.
- After the export is done, click Copy script to clipboard, then paste the contents in your editor of choice. The Terraform is not downloaded as a file to your system.
Monitor creation workflow and important concepts
When you create a Monitor, you have the option of configuring the following:
- Monitor type
- Monitor query
- Evaluation settings, including scheduled monitoring and stabilization delay, and latency.
- Alerting rules, including how to enable negative monitoring.
- Description
- Notification actions, such as email, Slack, PagerDuty, and webhook actions
- Get a preview of triggered alerts
While some options vary slightly depending on the type of Monitor you are configuring, they are mostly the same. Each Monitor type contains all of the listed configuration categories.
Monitor type
In the Monitor creator, the Monitor type should already be selected for you:
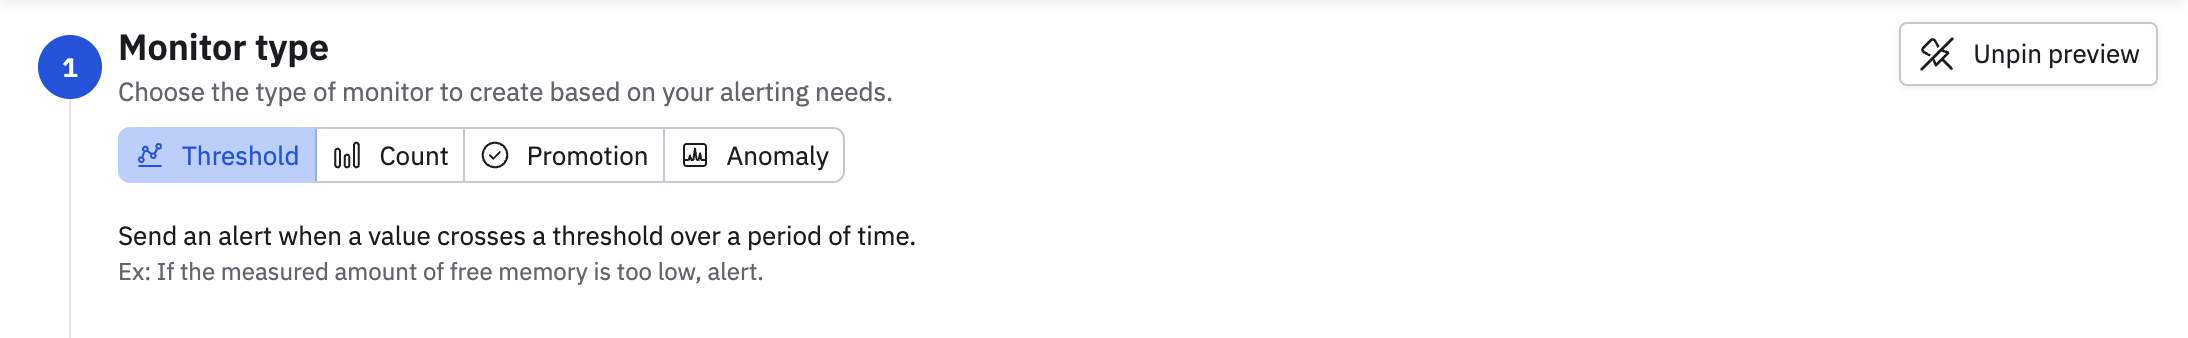
If this is not the type of Monitor you want to create, select the correct type before you continue.
Monitor query
Select a metric and define the Monitor query. You can use the expression builder, filters, and key grouping to isolate a time-series. You can also click the code () icon to write the query in OPAL.
As you build your query, you can see a preview of your data at the top:
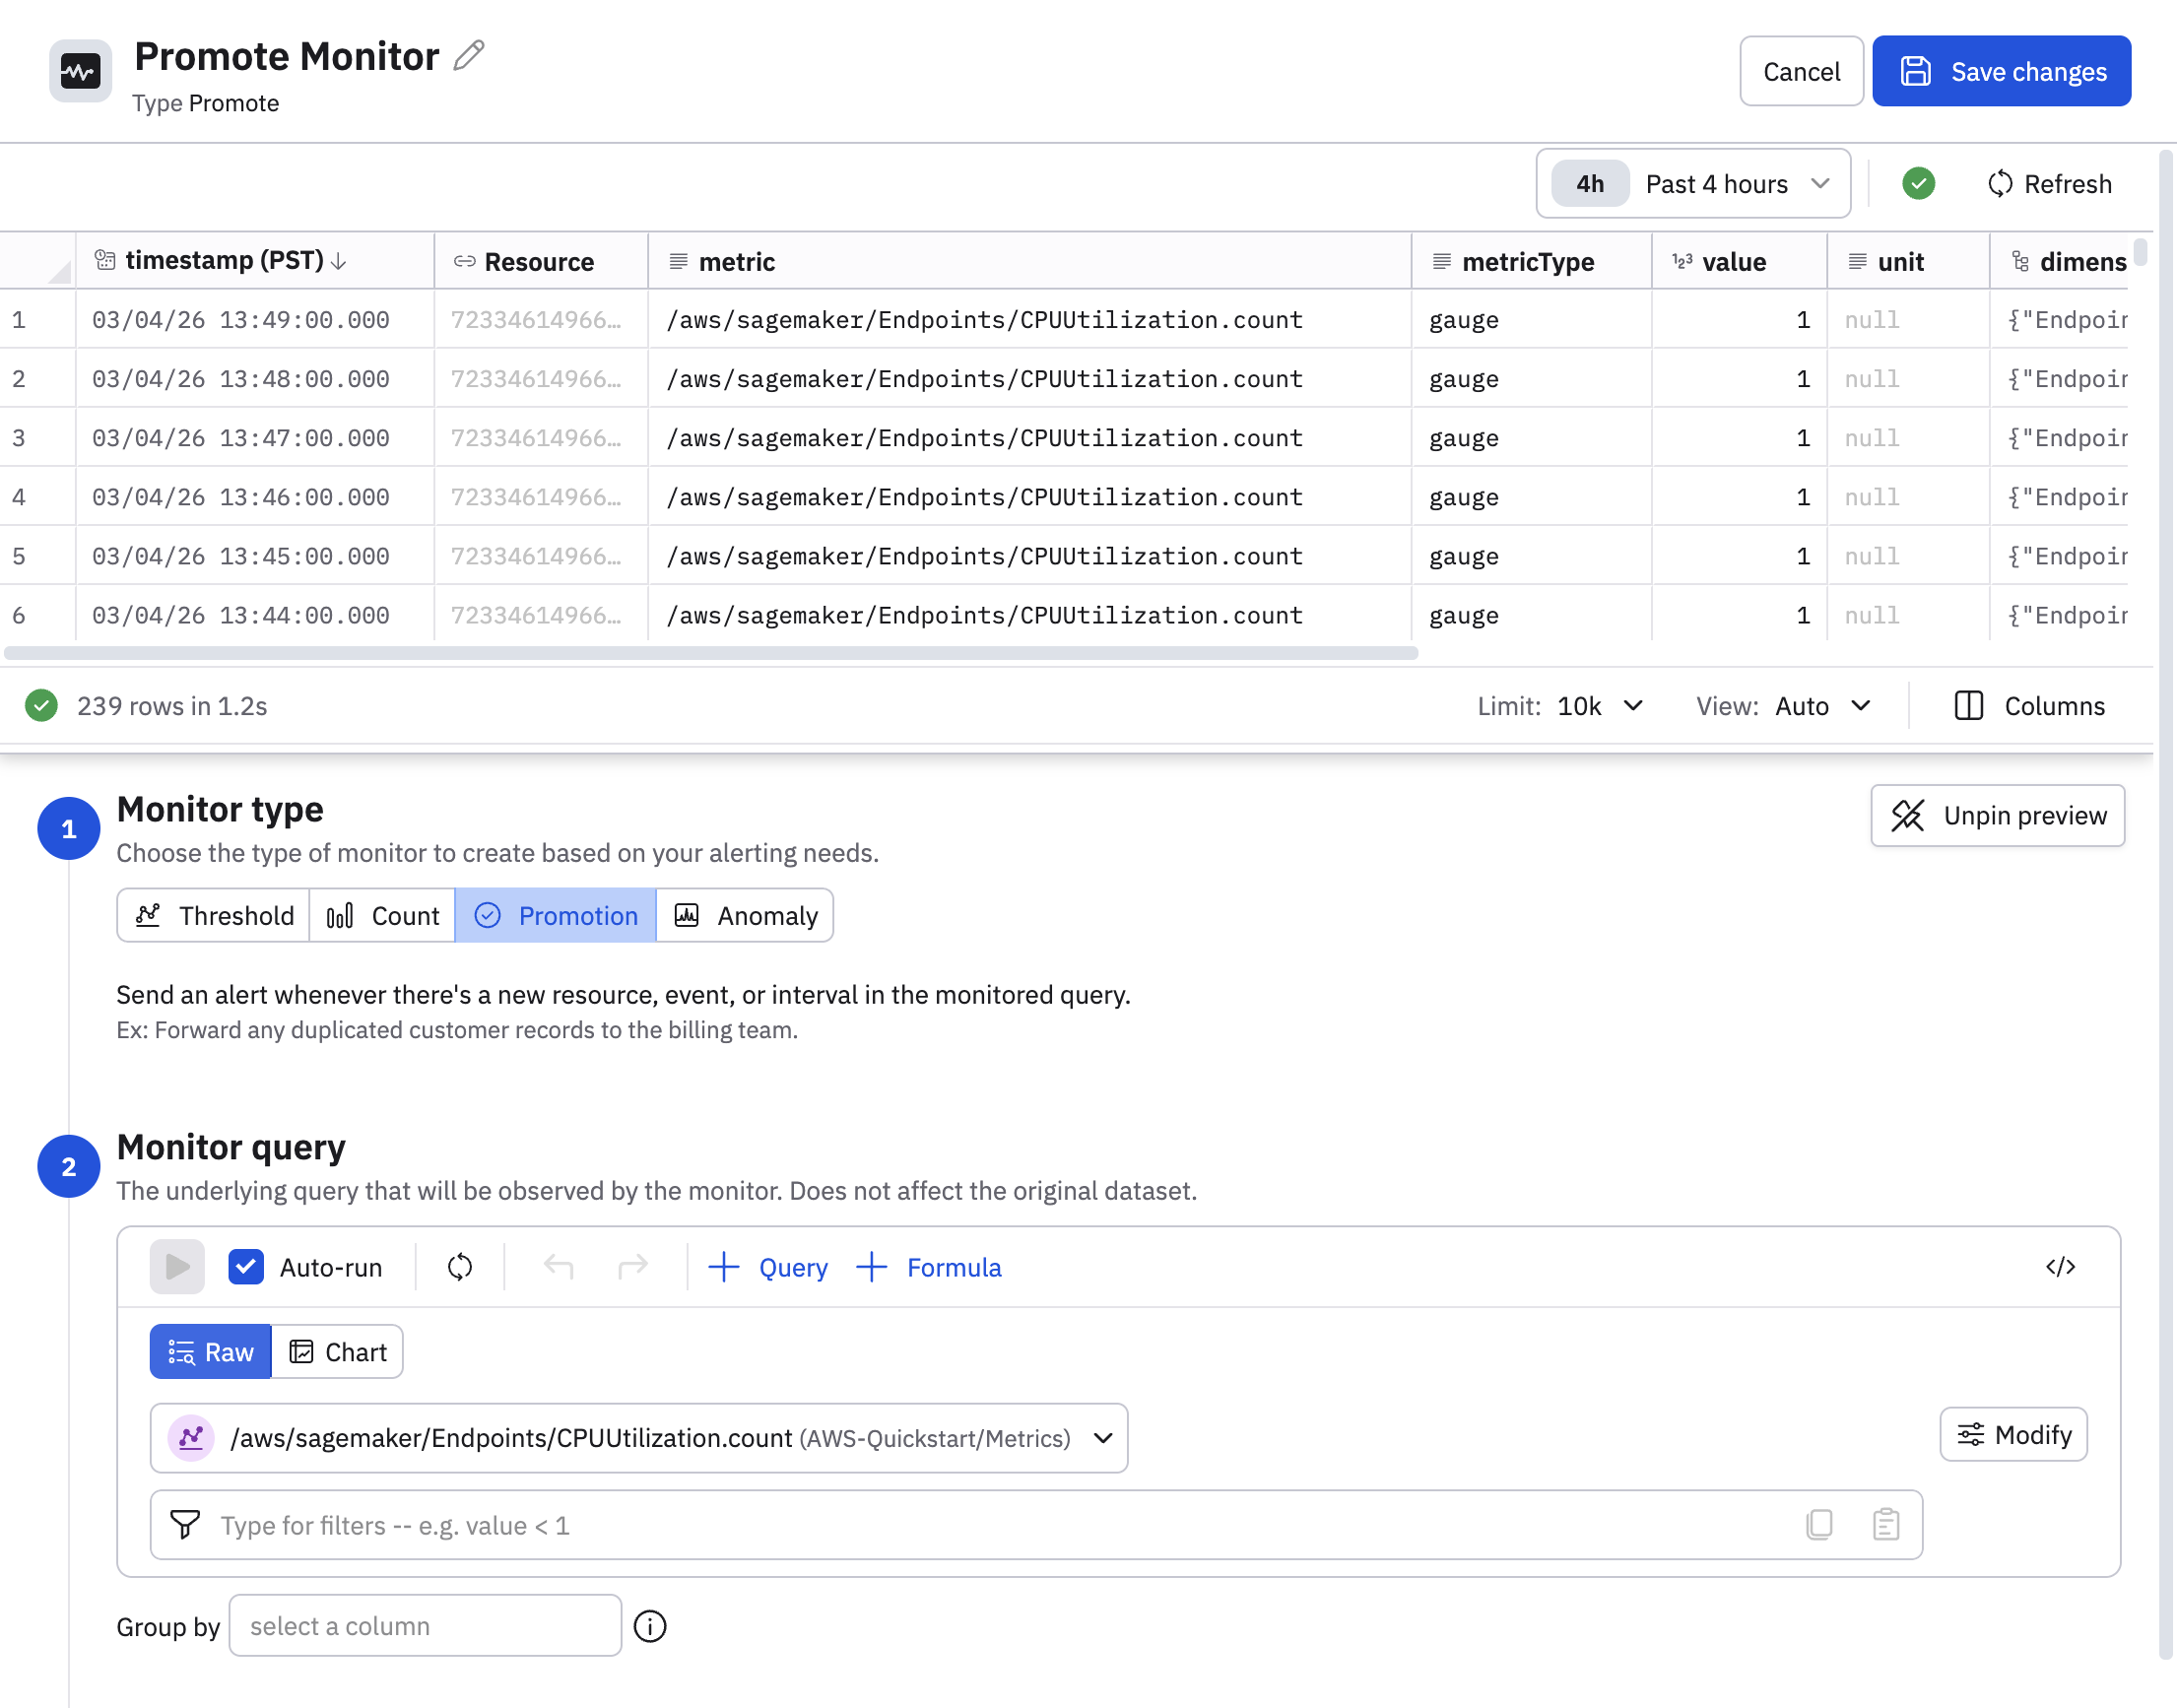
Some of the options here differ slightly depending on the type of Monitor you are creating. For example, in this example you can see the option to preview the raw data, or view the data as a chart, which is only available for promote Monitors.
Evaluation settings
Configure how the Monitor is evaluated. The options here differ slightly depending on the Monitor type.
| Monitor type | Evaluation options |
|---|---|
| Threshold | Evaluate the min/max/avg/sum of the query over a time window. |
| Count | Evaluate the number of rows of the query over a time window. |
| Promote | N/A |
| Anomaly | Evaluate the values of the query or a time window. You can also configure the granularity of the time-series. |
All Monitor types besides anomaly Monitors also have scheduling and advanced options. By default, Observe Monitors use continuous monitoring.
Continuous monitoring
By default, Observe Monitors execute as soon as data is available. Incoming data is ingested, shaped into a Dataset , and then made ready for use.
Some data sources cannot produce data in a timely and ordered fashion. If your monitor relies on data that is not complete for a few minutes, there are some approaches to solving this problem:
- In the Monitor Query section of the monitor, under Advanced options, you can introduce a delay before evaluation.
- Freshness goal adjustment: Use Acceleration Manager to reduce the Monitor's freshness goal.
- OPAL editing: Use OPAL to prevent evaluation of the "ragged right edge" data. The window and frame functions can be used together to filter the evaluated data set.
Scheduled monitoring
Rather than continuously evaluating as new data arrives, a scheduled Monitor repeats its evaluation at the designated times you set. To create a scheduled Monitor, select Add custom schedule while creating a Monitor. You’ll then have the option of using a visual setup or a CRON expression to set the schedule.
Scheduled monitors are handy for monitoring time-dependent scenarios, such as verifying that a batch job completed successfully or monitoring processes that run at specific intervals.
You can also enable Combine consecutive alerts to have repeated separate alerts for the same condition to be combined into a single alert, thus reducing alert volume.
This section also shows you the Observe credits billed against this Monitor since the last time it was updated.
Advanced options
Open the advanced options to configure a stabilization delay, latency settings, or disable the monitor under certain conditions.
Stabilization delay
Data in observability pipelines doesn't arrive instantly. Logs, metrics, and traces from different sources can have varying ingestion latencies — some data arrives in seconds, while other data may take minutes to appear. At any given moment, the most recent window of data is likely incomplete because some of it is still in transit. This incomplete zone is known as the ragged right edge.
If a monitor evaluates data in this zone, it can produce unreliable results:
- False positives — alerting because a metric appears anomalous when in reality the data just hasn't fully arrived yet.
- False negatives — missing a real problem because the data that would reveal it hasn't been ingested yet.
- Flapping alerts — alerts that rapidly fire and resolve as late-arriving data changes previously evaluated results.
The stabilization delay (sometimes called "evaluation delay") controls how long a monitor waits before evaluating data, giving late-arriving data time to be fully ingested and processed. By default, monitors use a stabilization delay of 3 minutes. You can configure this value per monitor, including setting it to 0 if your data sources have very low and predictable latency.
As a rule of thumb, set the stabilization delay to be 1.5 times longer than the worst-case ingestion latency of your data source. A longer delay produces more accurate alerts at the cost of slightly slower detection. A shorter delay means faster detection but increases the risk of false alerts from incomplete data.
Disable the Monitor
You can disable the monitor if the hourly number of alerts exceeds a specified number.
Latency
Desired latency is how quickly the monitor responds to new data. The default is auto, where an efficient latency is selected for you, based on your query.
Alerting rules
Alerting rules define the conditions that cause a Monitor to generate an alert, along with the severity of the alert. Each Monitor must have at least one alerting rule.
The following rule severities are available:
- Informational
- Warning
- Error
- Critical
You can use the Missing data toggle to enable an additional severity called No data, used for negative monitoring where you check for the absence of data.
You can construct multiple rules in a monitor, using conditional tests from the data to set a severity level. Each rule can have its own severity level. The preview panel updates in real time so you can review where your rules are matching.
The alerting rules vary depending on the type of Monitor you are creating.
| Monitor type | Alerting rule |
|---|---|
| Threshold | Trigger an alert when the min/max/avg/sum meets a certain condition. |
| Count | Trigger an alert when the count of rows in the query meets a certain condition. |
| Promote | Trigger an alert then a column in the query result meets a certain condition. |
| Anomaly | Trigger an alert when the values of a query exceed certain bounds. |
Description
Use the Description field as a free form text entry to inform users, link runbooks, or tag Monitors. You can search Monitors or alerts by the contents of this field.
Variables are not supported in the Description field.
Notification actions
When a Monitor is triggered and alerts are generated, you can view the alerts in your monitoring logs and Alert Explorer.
You can also have notifications sent to you or other people in your organization using email, Slack, PagerDuty, and webhook actions. For each action, use the Conditions area to select the matching severities that will trigger this action. For example, below are some common ways to configure actions:
- Send all alerts of any severity to S3 for compliance storage.
- Send Informational or Warning alerts to Slack only.
- Send Error or Critical alerts to Slack and PagerDuty.
All actions can use Observe's extended Mustache formatting to refer to data. See Customize alert messages and Mustache template reference for details.
Actions can send reminders on a periodic basis; this can be useful for Slack or Email to larger teams. Click Send Reminders beneath the action to select a time frame, such as "1 day". Mustache variables can be used to control these alternate behaviors.
Actions can send end notifications, which is frequently used to close a ticket in a receiving system such as PagerDuty or OpsGenie. Slide the Send an update when the monitor has stopped triggering toggle beneath the action to the on position to enable this. Mustache variables can be used to control these alternate behaviors.
Once configured, an action can be shared with your team members as a Saved Action, by clicking Share action with team in the title row. See Configure shared actions for more information.
Link dashboards to your alert messages
You can link dashboards to your alert messages using correlation tags. For example, suppose you are using the k8s.cluster.name tag to group clusters together in your Monitor query. For example:
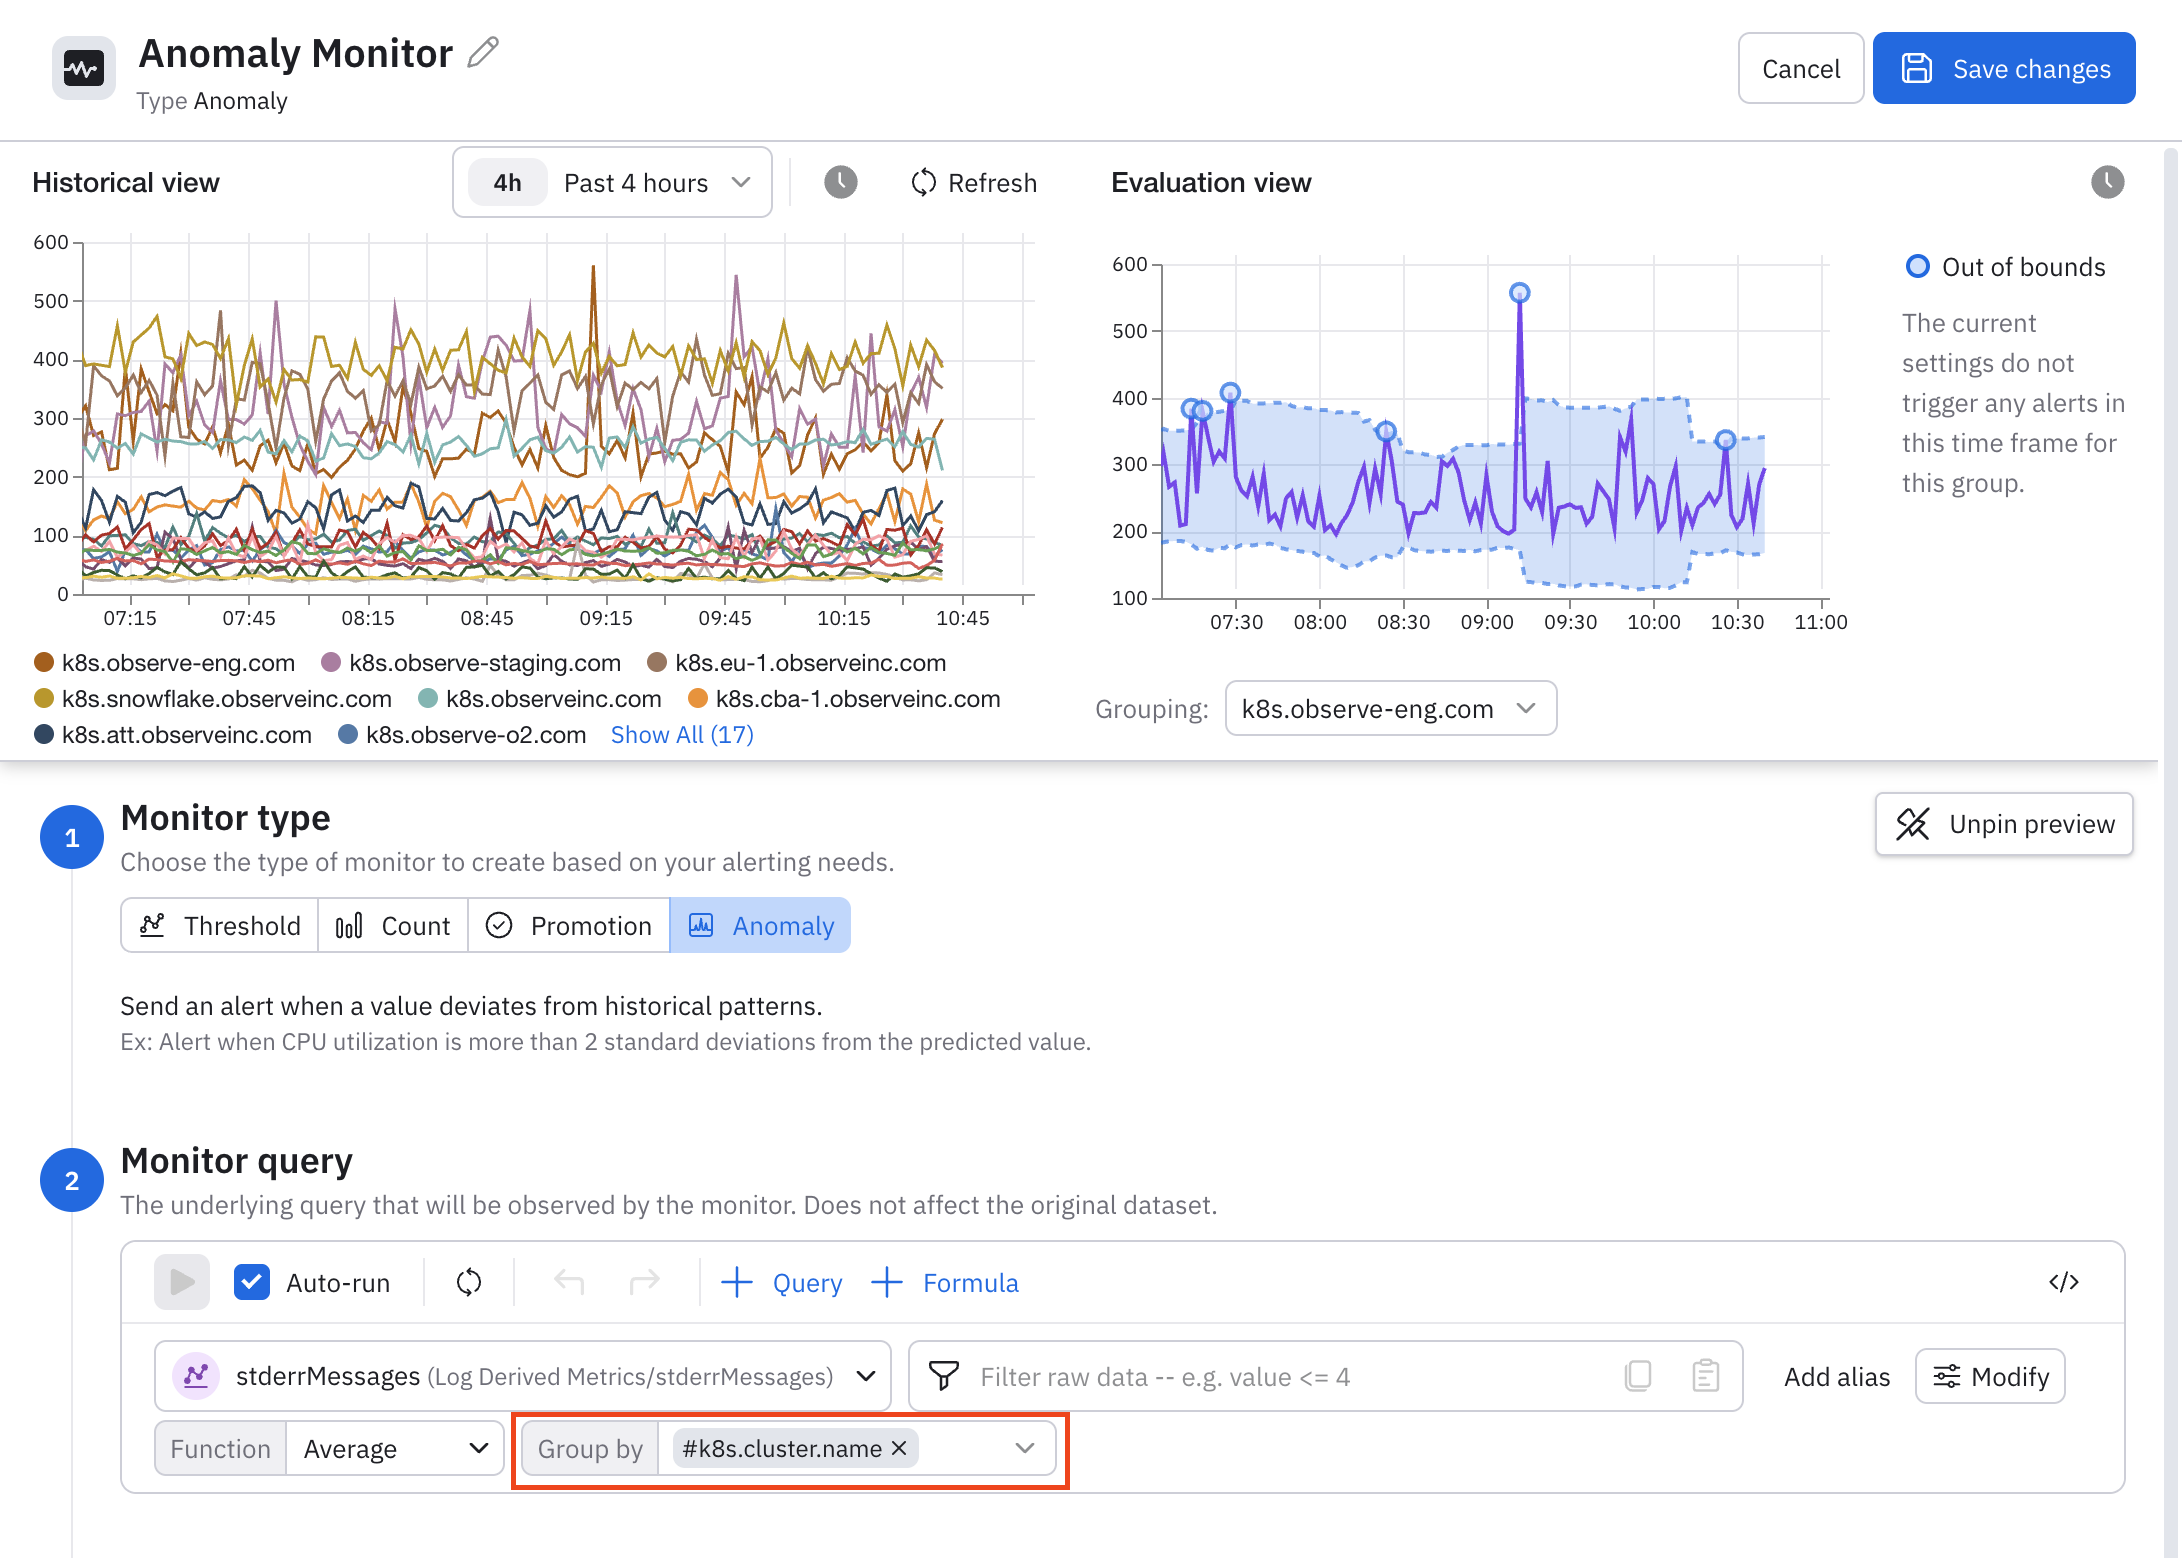
If you also have a dashboard with k8s.cluster.name as a correlation tag parameter, you can write a Mustache template for an email or Slack alert that carry over this correlation tag to the dashboard, so that the dashboard is already filtered to the alert value when you open it.
For example, this Mustache email template fetches the tag value using {{alert.valuesByTag."TAG.NAME".value}}. Note that the tag name must be fully enclosed in quotation marks if it includes a dot (.) character.
<a class="btn" href="https://102.observe-o2.com/workspace/41000009/dashboard/Tags-GA-Launch-41075520?tag-k8s.cluster.name={{alert.valuesByTag."k8s.cluster.name".value}}" style="margin-bottom: 4px">View Dashboard Test</a>Here is the same example for Slack:
,{
                        "type": "button",
                        "text": {
                            "type": "plain_text",
                            "emoji": true,
                            "text": "View Dashboard Tag Test"
                        },
                        "url": "https://102.observe-o2.com/workspace/41000009/dashboard/Tags-GA-Launch-41075520?tag-k8s.cluster.name={{alert.valuesByTag."k8s.cluster.name".value}}"
                    }
Preview of triggered alerts
Take a look at a preview of a triggered alerts as you have configured the Monitor. This is how the alerts would appear in the Alerts Explorer.
Updated 8 days ago