Review a Monitor's data lineage
You may need to review a Monitor's data sources to understand the data it relies on, the latency of that data, and the size of the queried window over time. Balancing the speed and cost of a monitor requires controlling the freshness of the data that monitor relies on.
To review metrics such as latency and queried window size, open a Monitor in read-only and click the Health metrics tab.
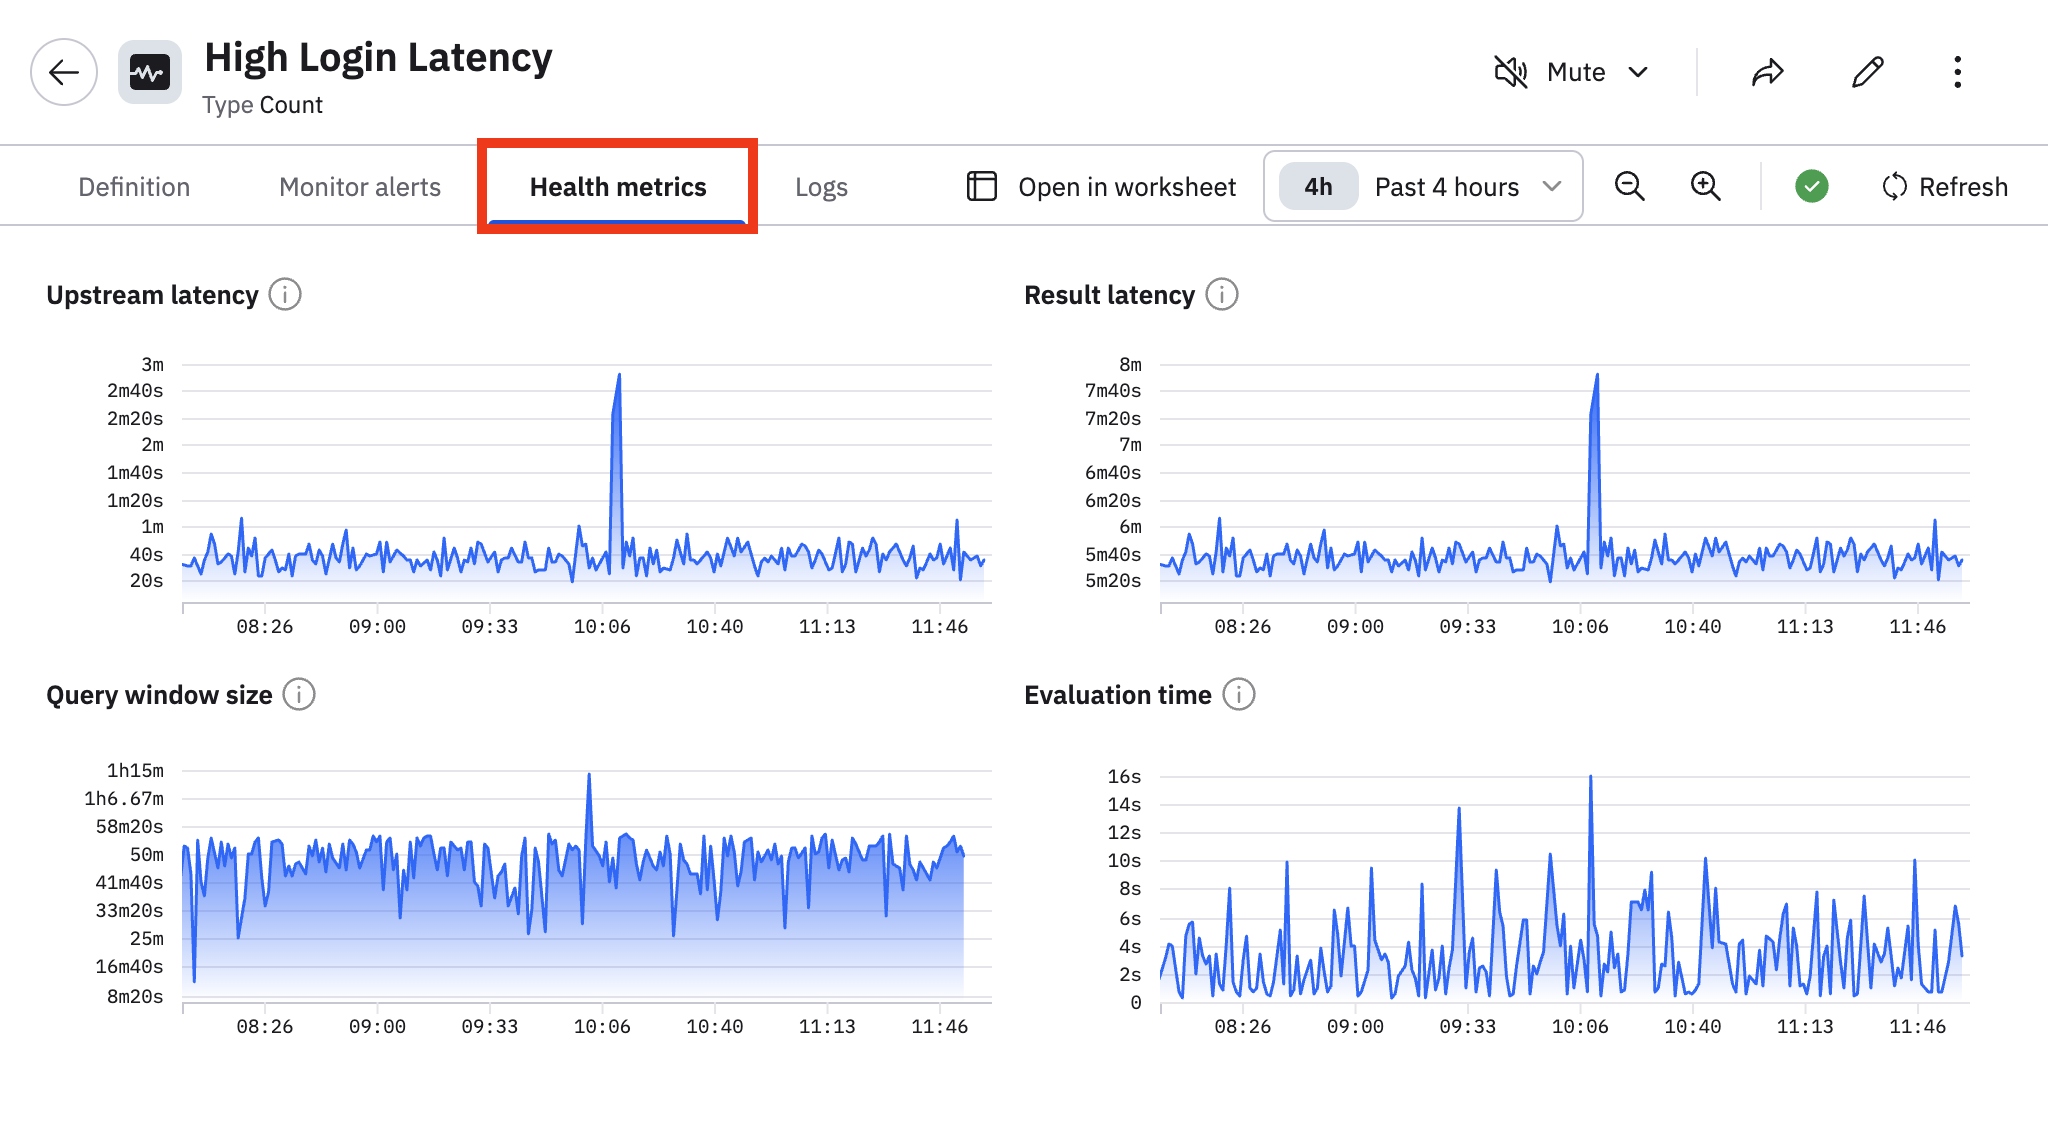
The following charts are available:
| Chart | Description |
|---|---|
| Upstream latency | Time from ingest to Monitor. |
| Result latency | Time from ingest to alarm. |
| Evaluation time | Time spent in Monitor evaluation. |
| Query window size | Time frame evaluated by the Monitor. |
To quickly assess the effective freshness of a Monitor with a complex data lineage, use the Acceleration Manager . In the left navigation rail, selectData & integrations > Acceleration manager, then click Monitors. Sort by Effective Freshness to filter the list. Monitors with an effective freshness that is worse than the freshness goal will have a warning icon and colored display. Hover over these lines to get a context menu, and click the More icon to edit the Monitor definition.
You can also access Monitor definitions from the Acceleration Manager's Monitors list page. Hover over the Monitor to access the context menu, and click the edit icon () to edit the Monitor definition. Note that v1 Monitors are on a separate page and can also be edited.
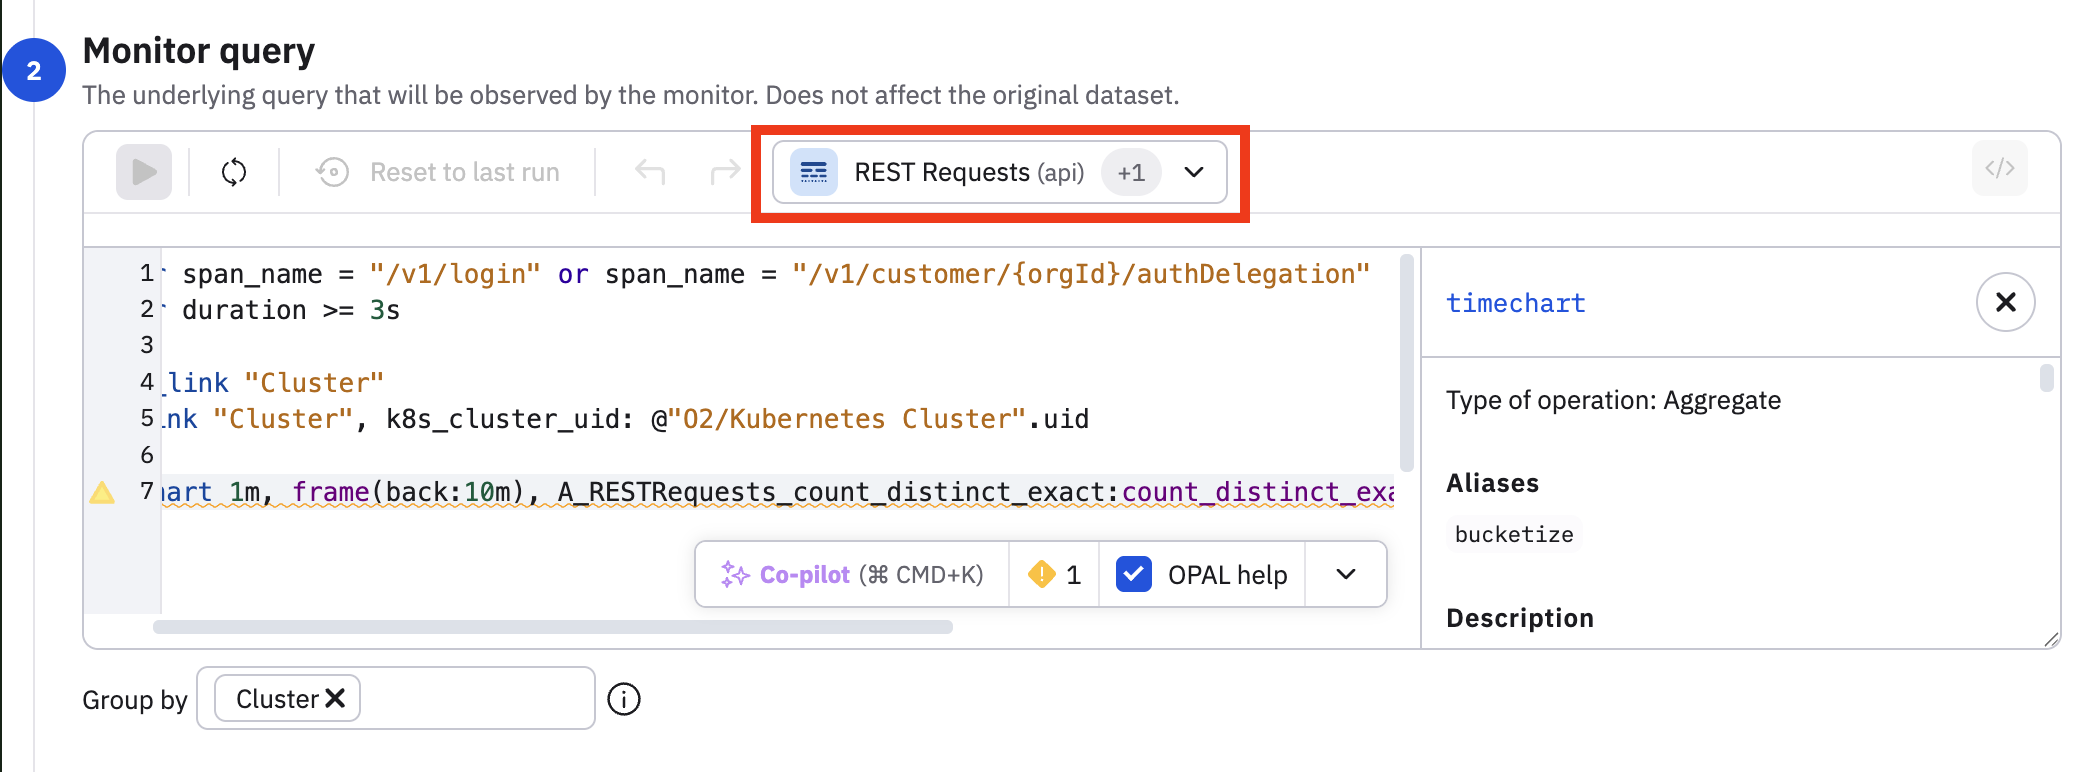
Edit the Monitor by clicking the edit icon () at top right or from the context menu and navigate to the Monitor query. Click Manage Inputs at the right side to list the input Datasets, and click the Open or Edit buttons to review their data or definitions. Note the Manage Inputs button is hidden when using an expression builder, click the OPAL button at the right side to expose it.
Updated 4 months ago