Add cards to a dashboard
Learn how to add, manage, and pivot from dashboard cards in Observe.
Begin creating any new dashboard by adding cards, or panels. Dashboard cards serve the following purposes:
- Data visualization: Each card displays specific information, such as a charts, graphs, or tables. You can choose the type of visualization that best suits your needs.
- Interactive exploration: Cards are not static; you can hover over elements to see details, drill down into the underlying raw data for deeper investigation, or pivot from the card to create Worksheets or Monitors.
- Flexible layout: You can freely arrange and resize cards within a dashboard to create a logical flow of information.
- Customization: Cards can be configured with specific titles, time ranges, and filters. You can also configure dashboard parameters to filter all cards by specific values.
How to add a card
This workflow describes how you can add a new card to a new dashboard. There are other ways to add cards to a dashboard, such as asking AI SRE to generate a chart and then adding the chart to a dashboard.
-
Click Dashboards in the left navigation rail.
-
On the Dashboard Explorer, click New dashboard.
-
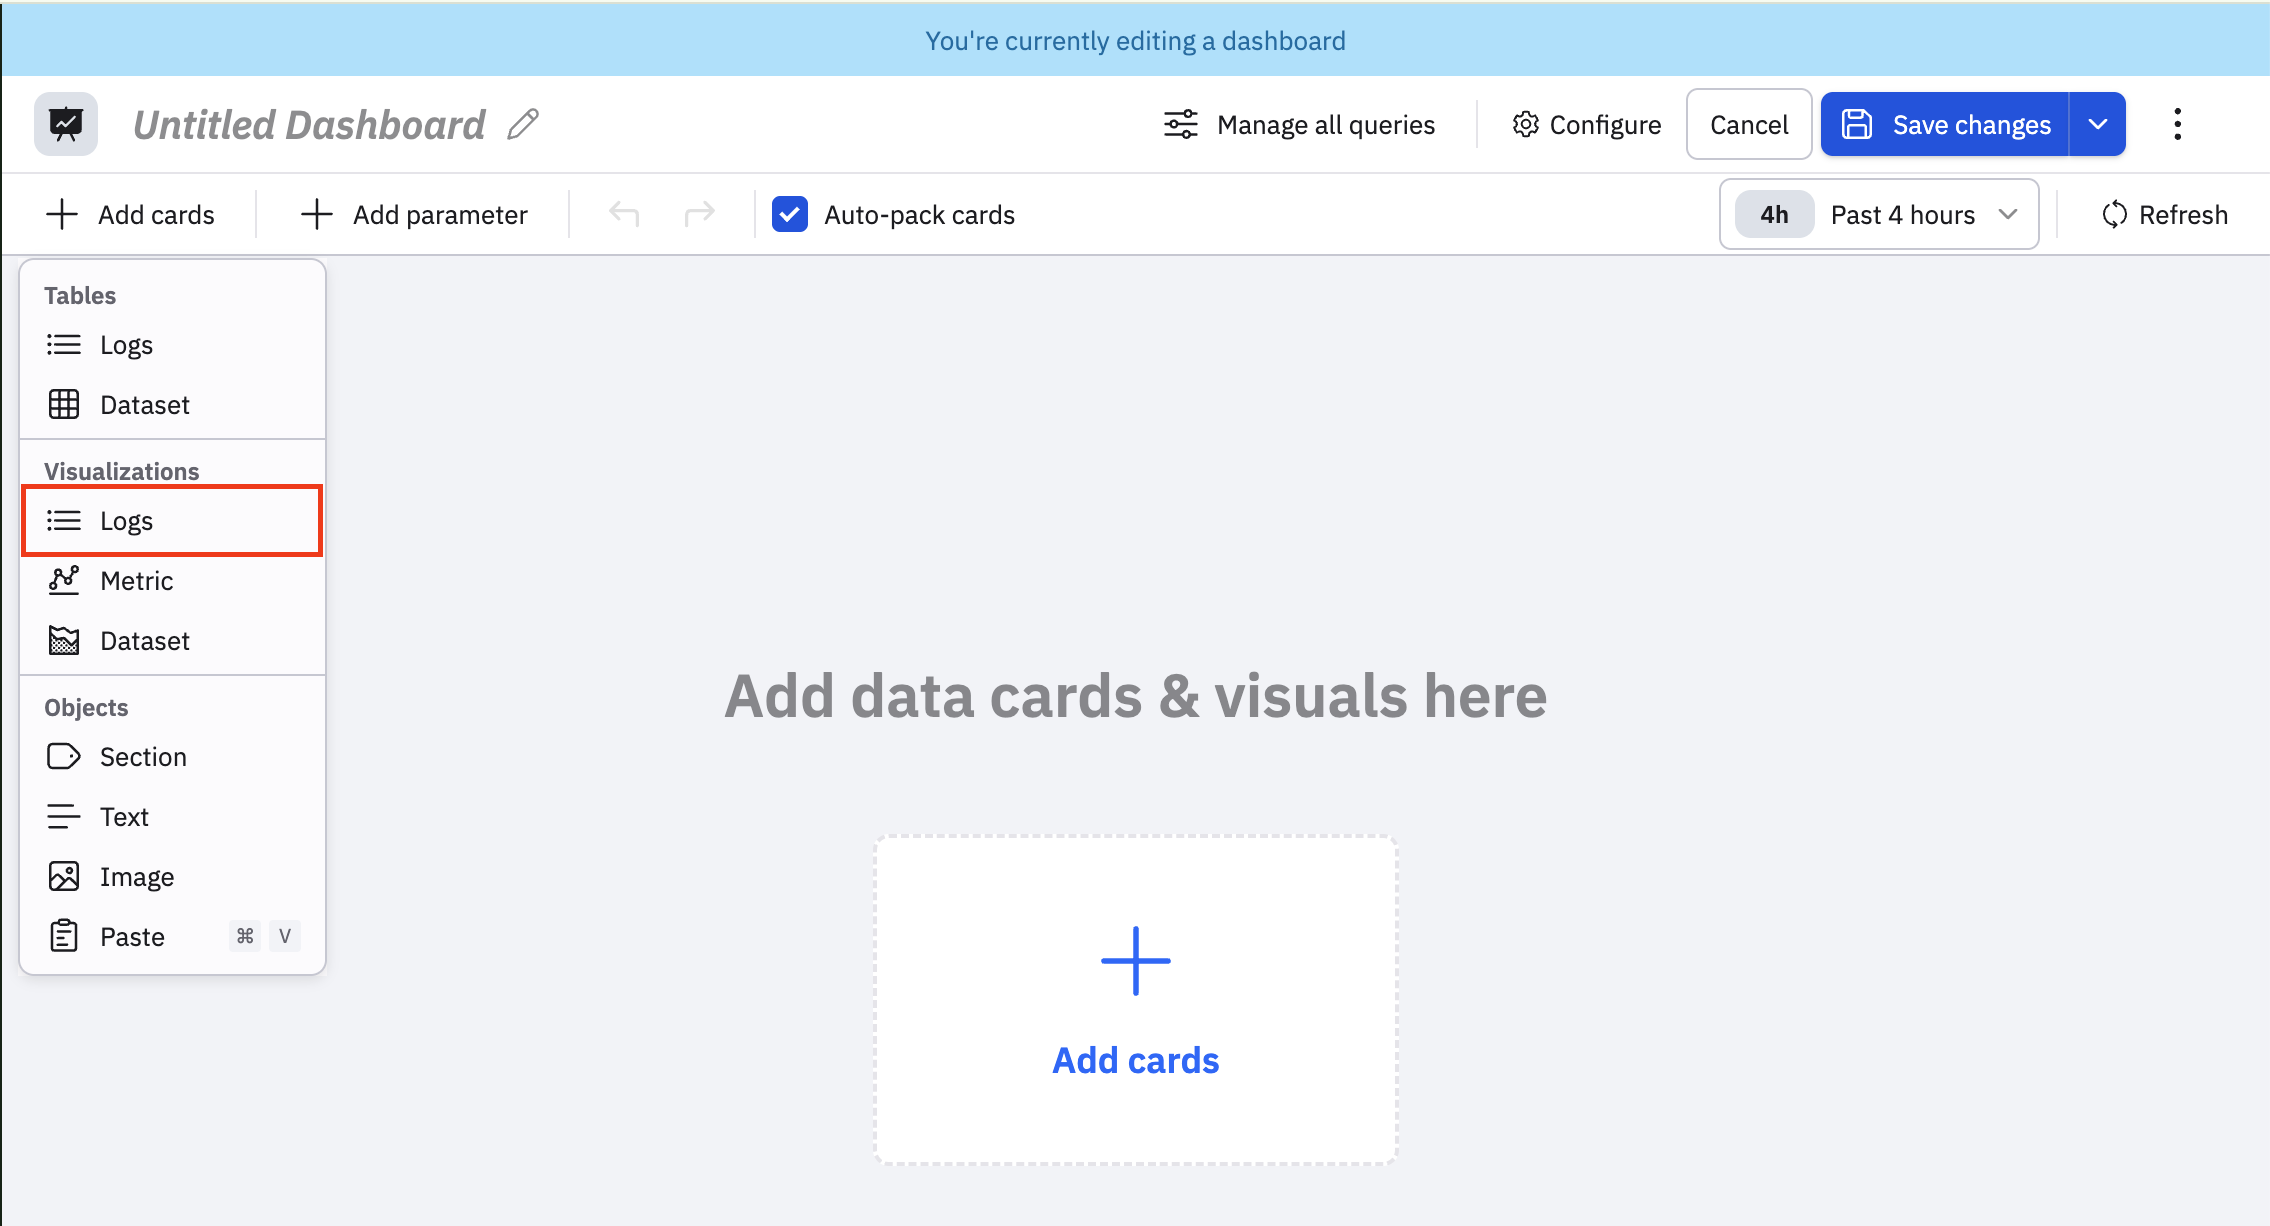
Click Add cards. You can add a card containing a table, visualization, or other object such a section, text, or image to design the layout of your dashboard. In this example, we'll add a card containing a log visualization.
-
Select Logs in the Visualization category.
-
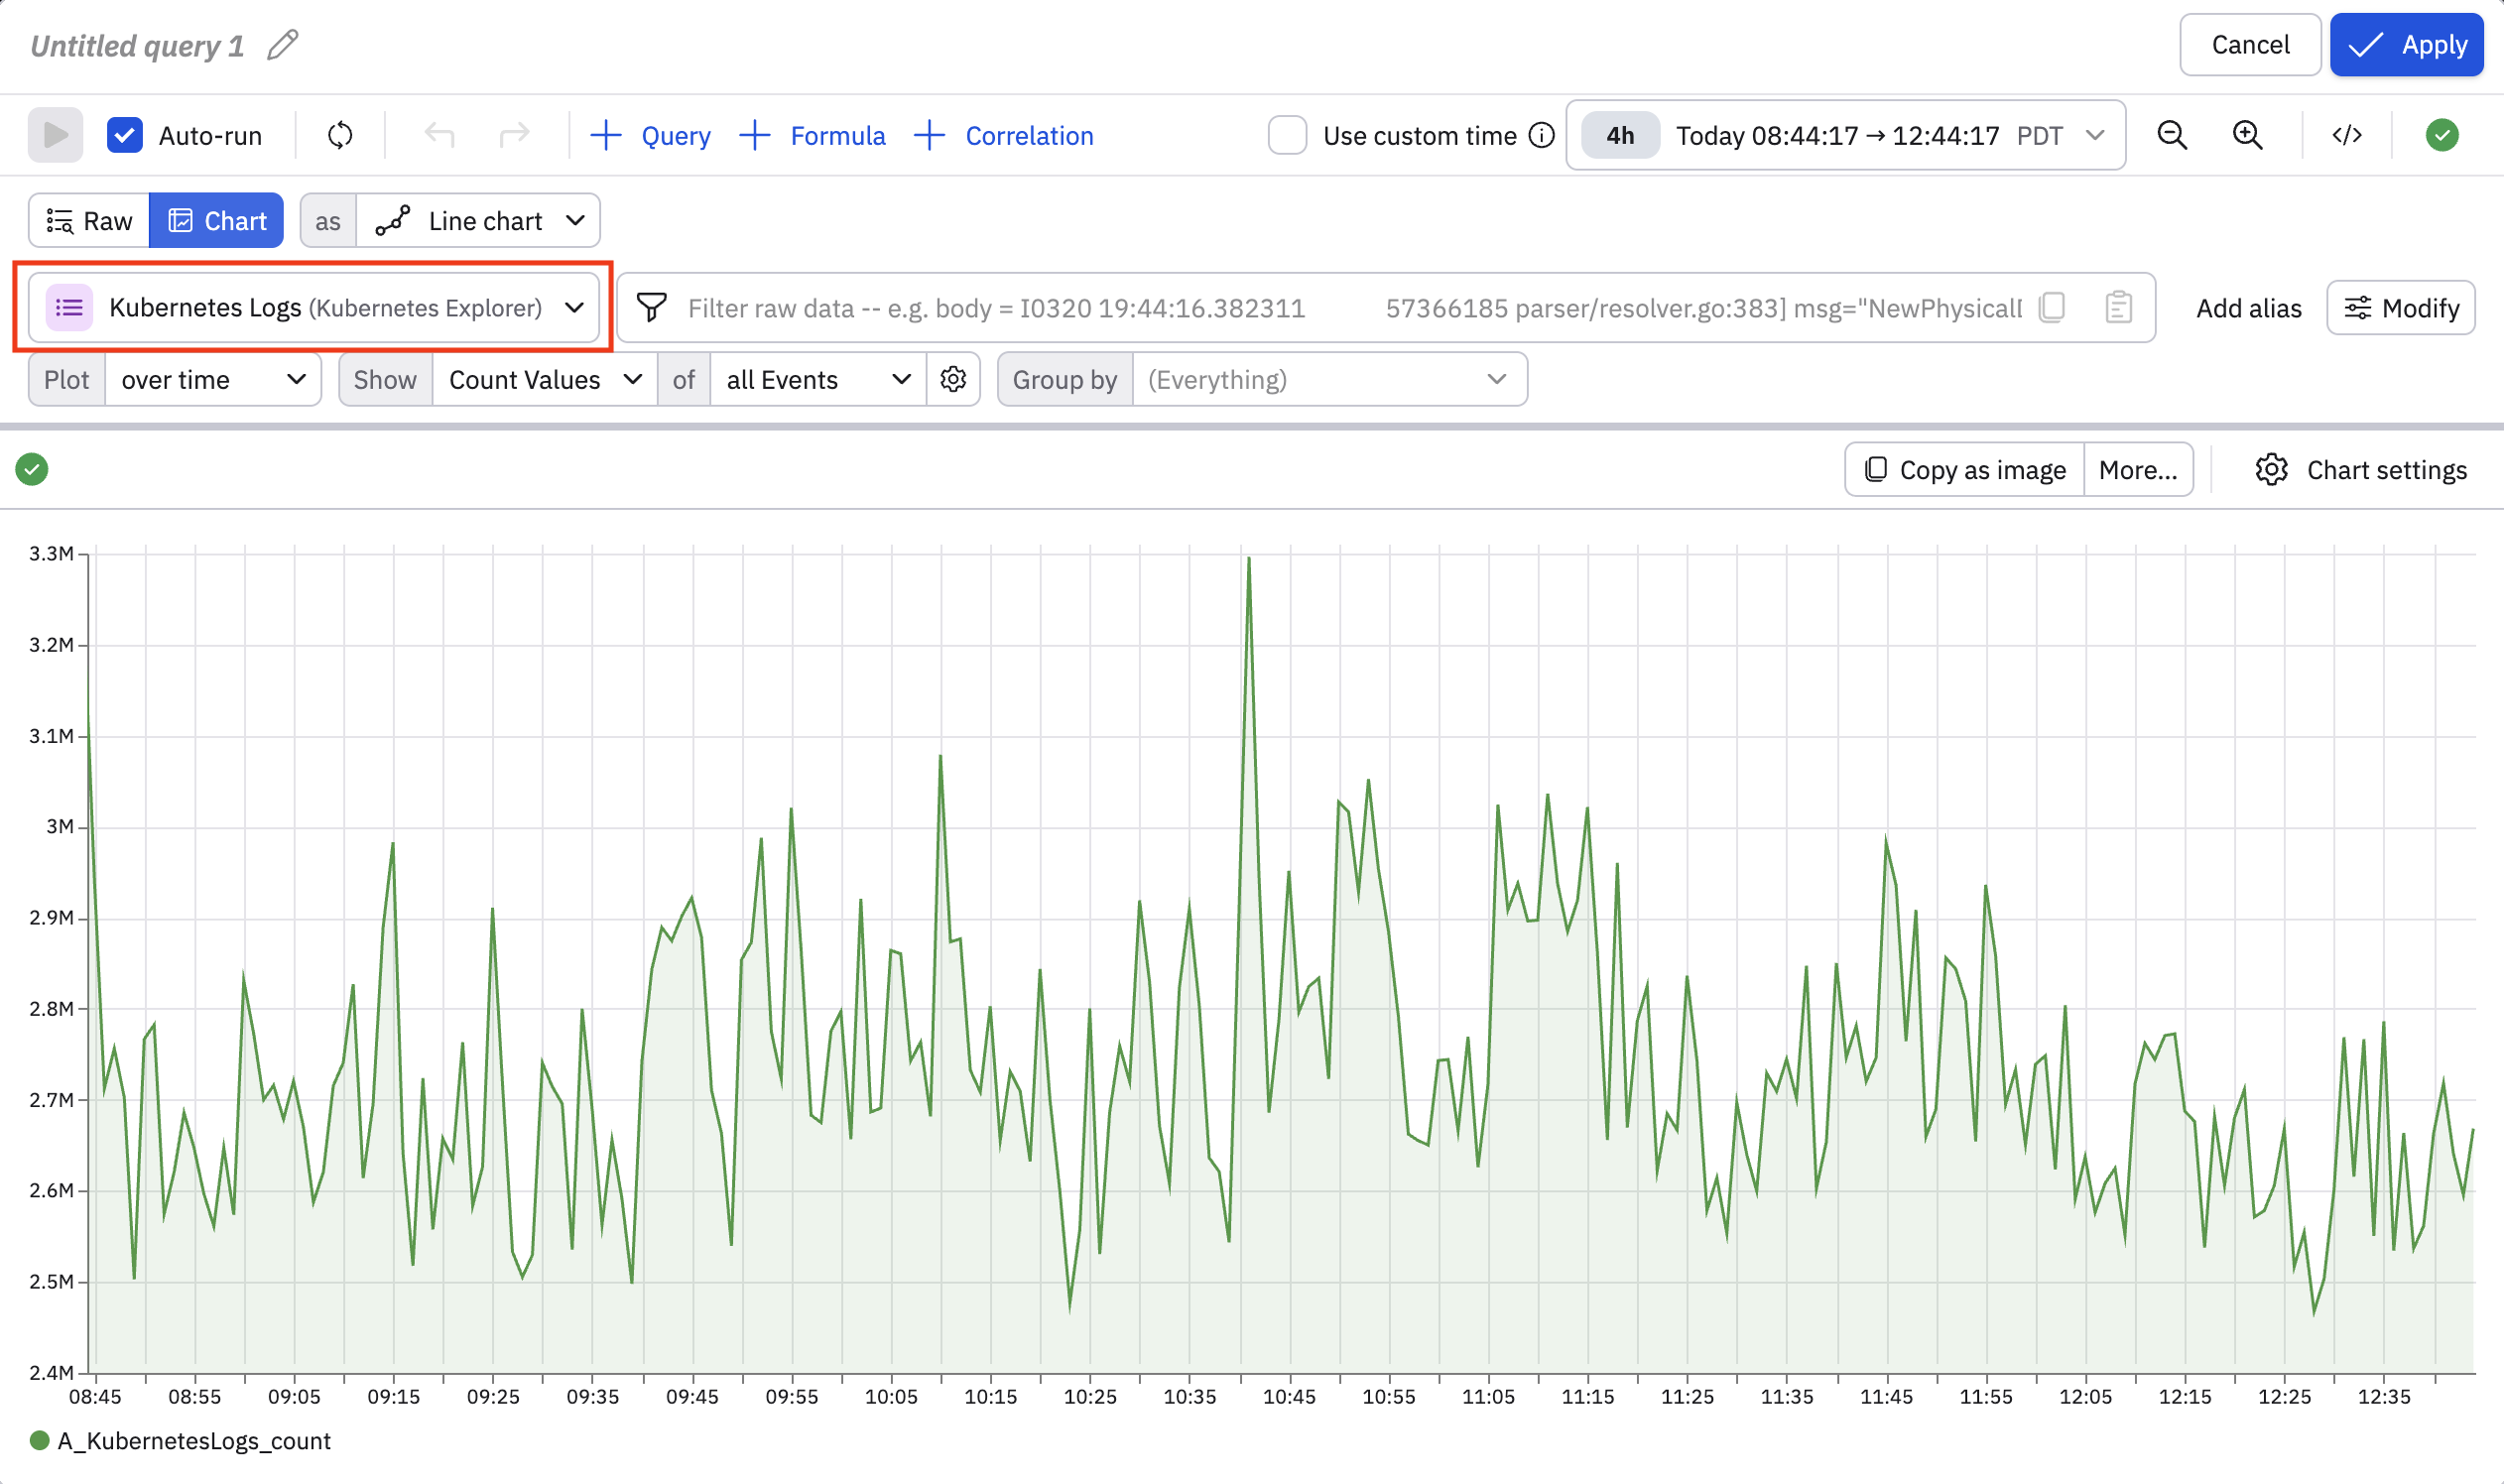
Select the Dataset you want to use for this card. This determines where the data in the card comes from. Since dashboards can have multiple cards, each with its own source data, your dashboard can represent data from any number of logs, spans, metrics, or other Datasets. In this example, we'll select the Kubernetes Logs Dataset.
-
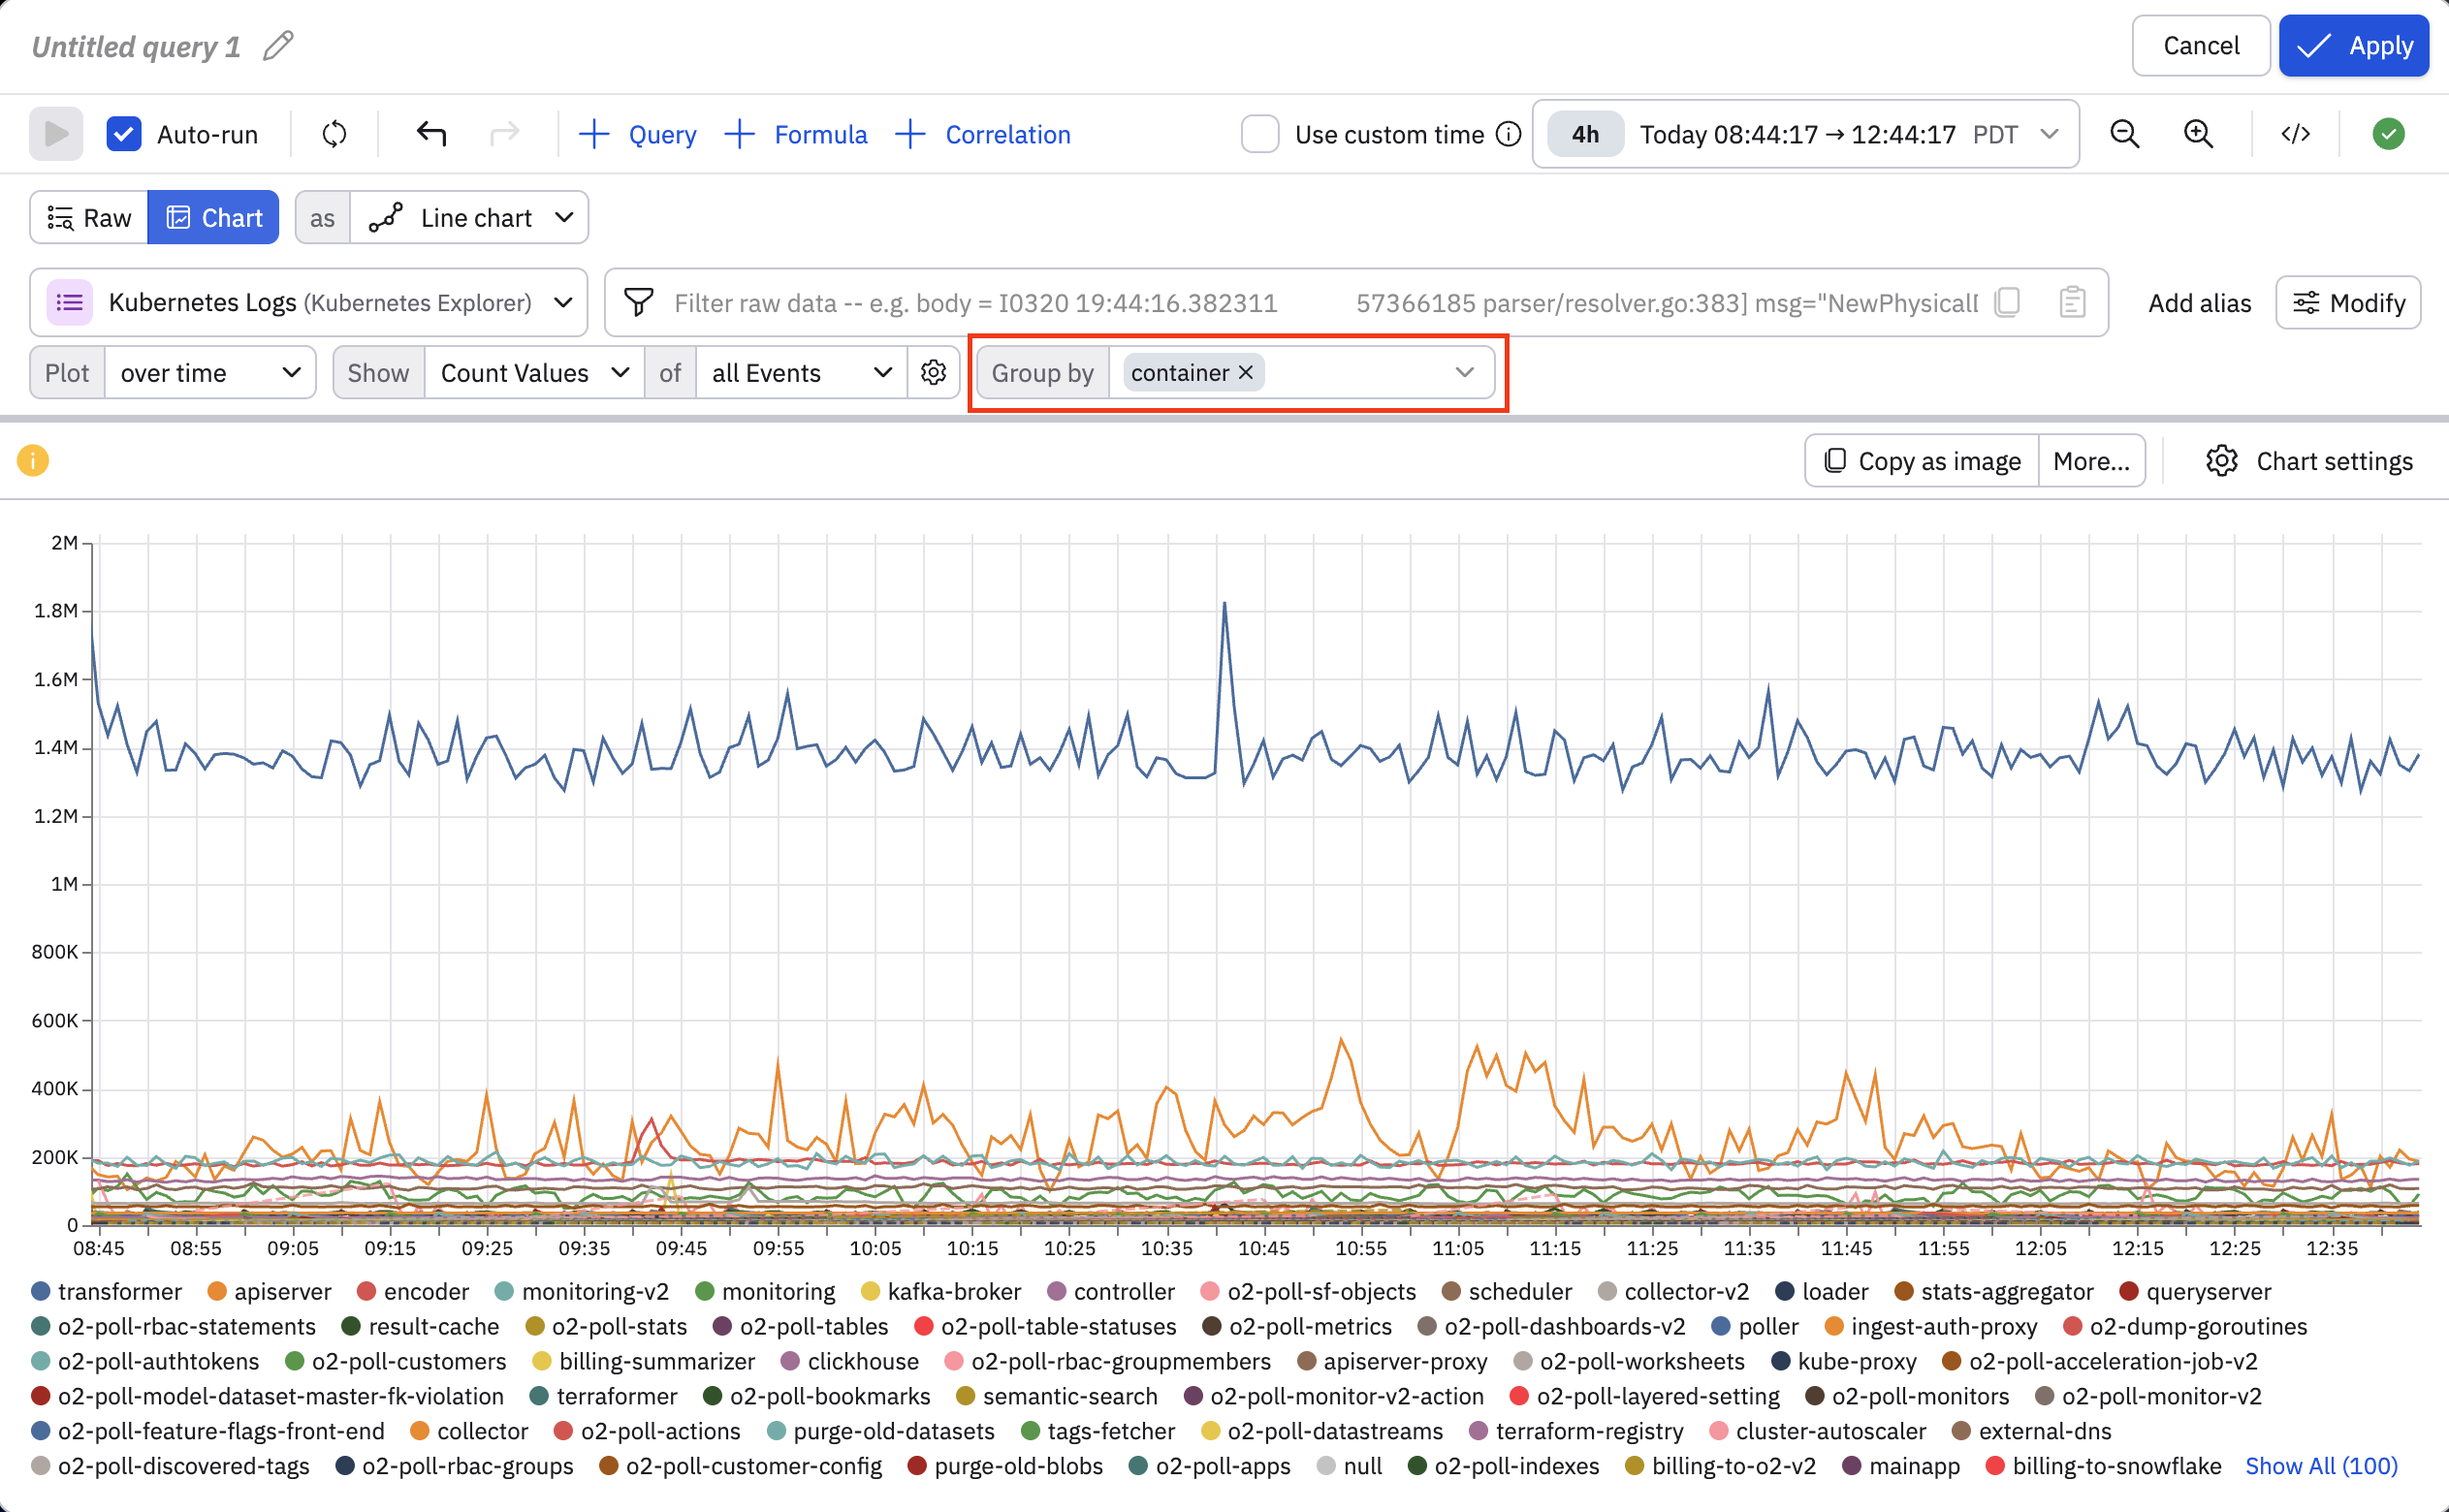
Use the query builder to do some additional shaping and filtering of the data you want to see. This chart shows the total number of events, we want to see the events sorted by container. In the Group by drop-down, we select container.
-
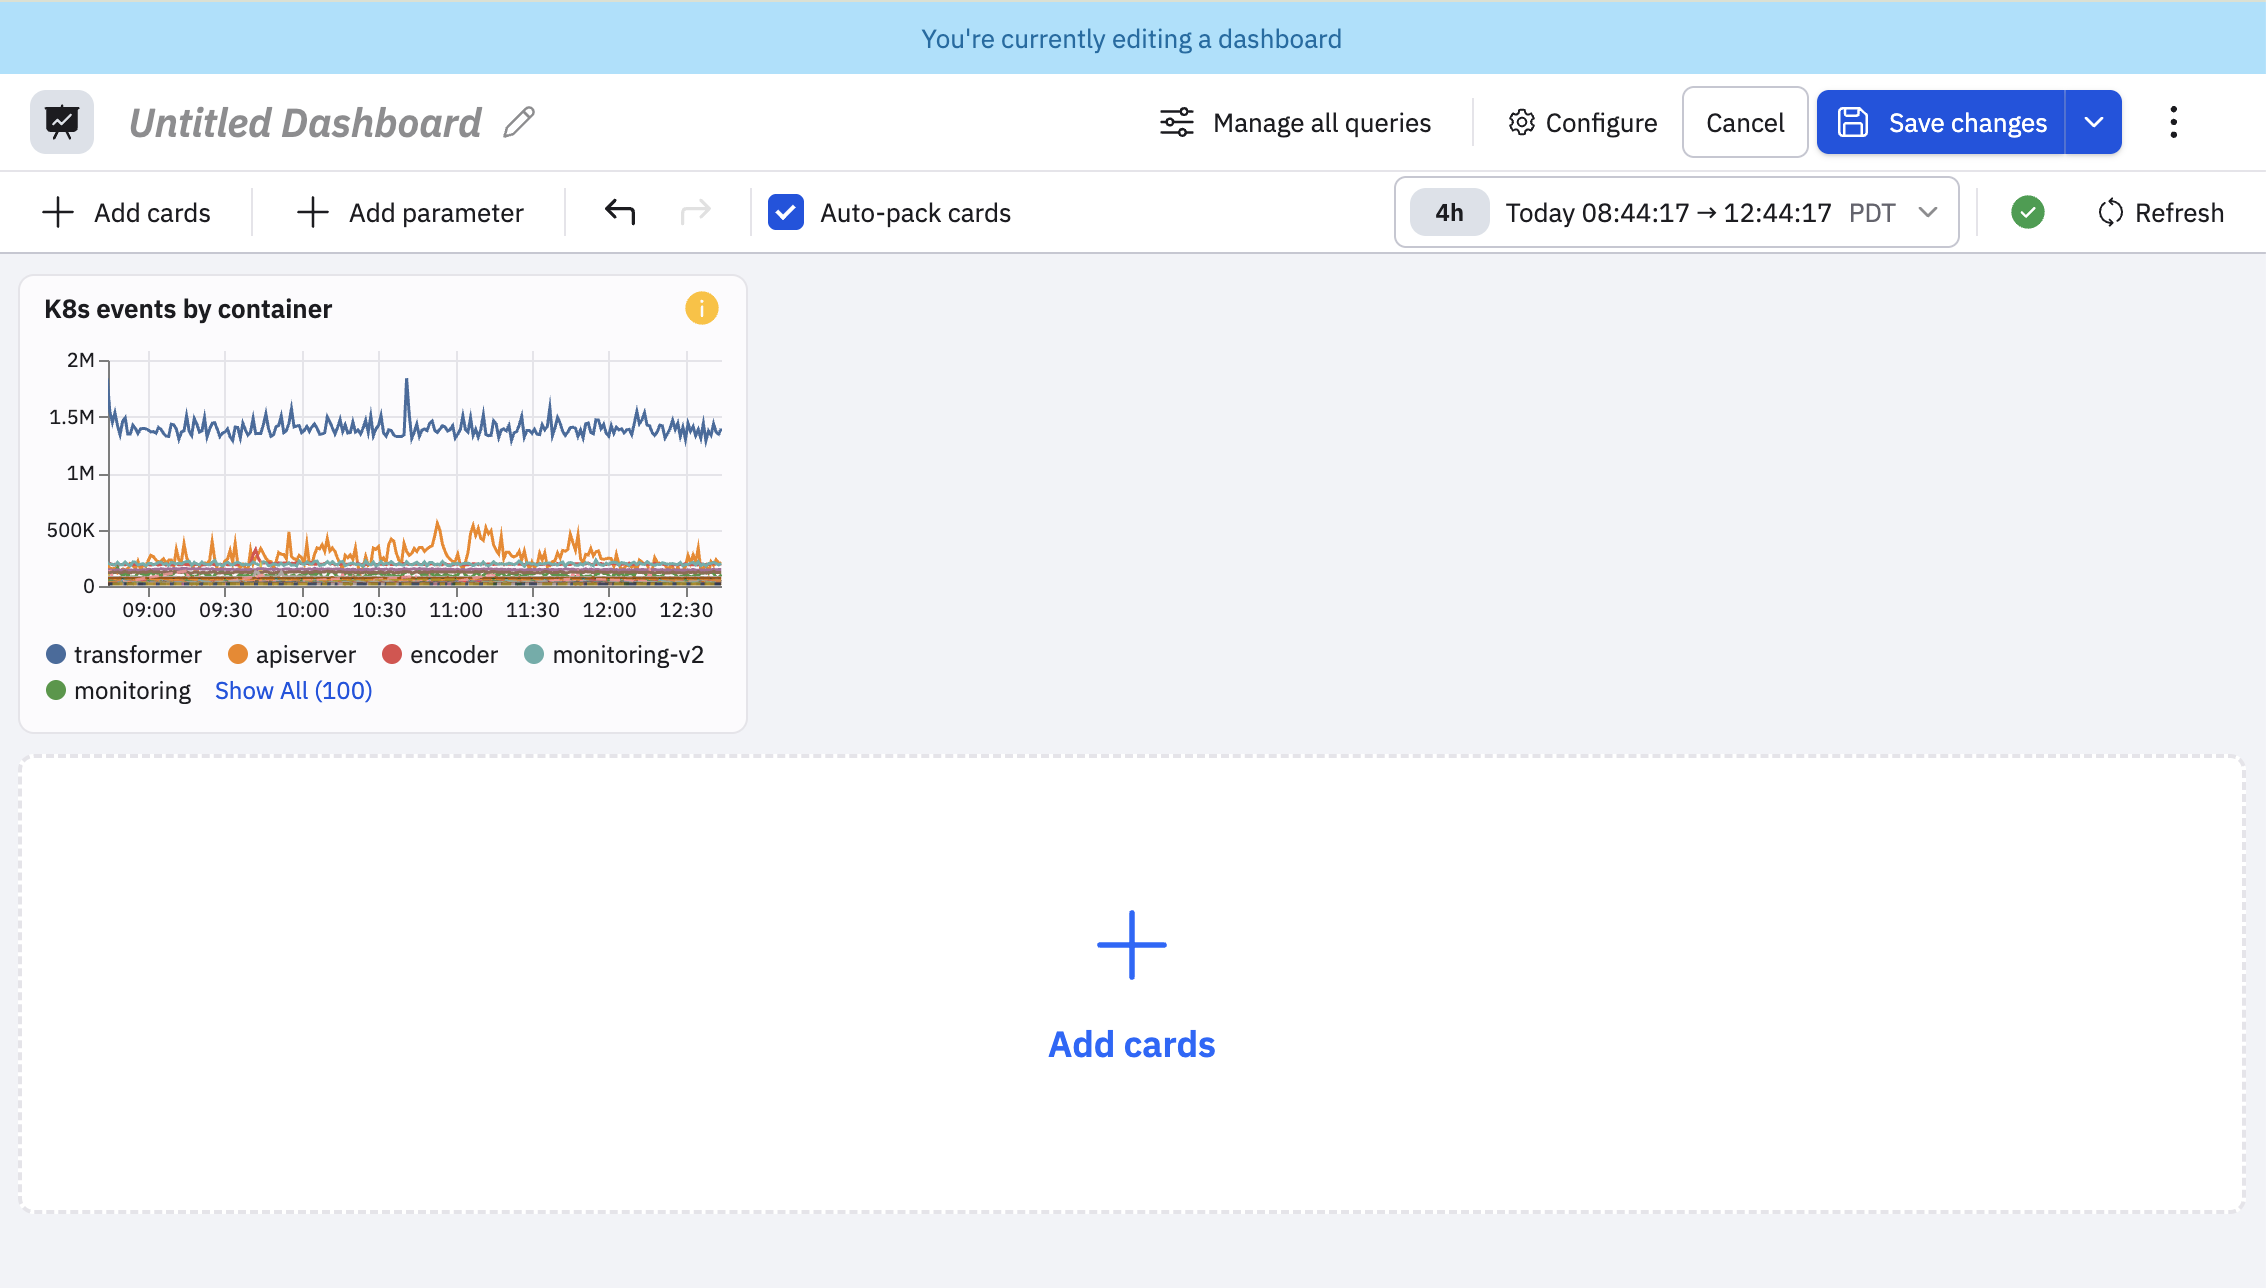
At the top of the chart, click Untitled query and give this card a name, such as K8s events by container.
-
Click Apply to add this card to the dashboard.
-
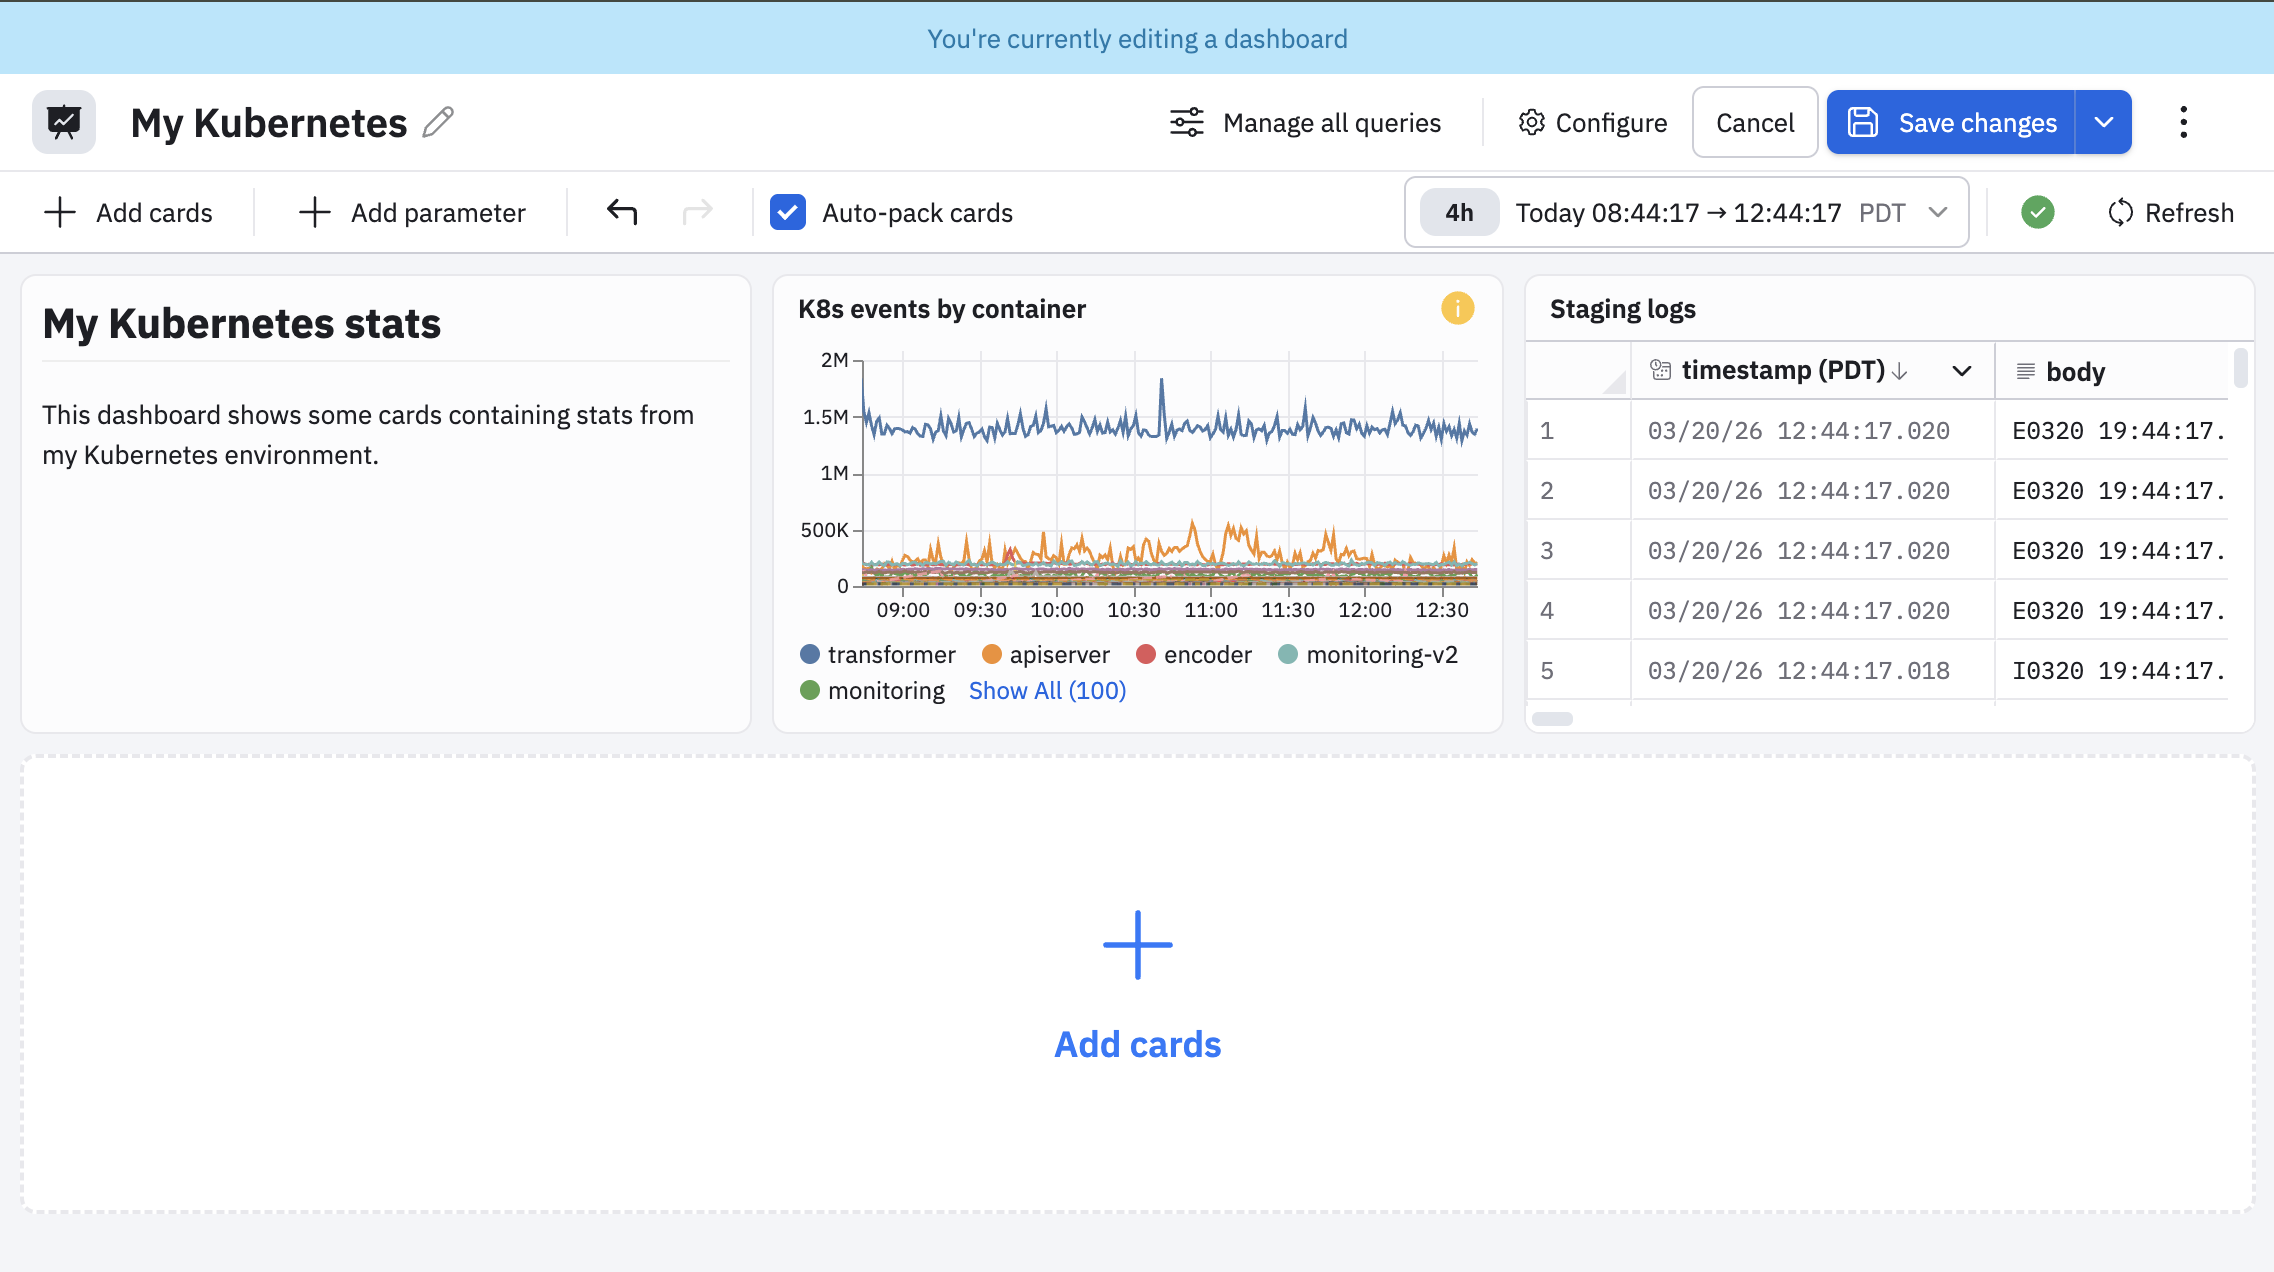
Give your dashboard a name, then click Save changes to save and create the dashboard.
You can continue adding cards in this manner. In the example below, we add a Dataset table and a text card summarizing the contents of the dashboard.
To add a Dataset table, perform the following steps:
- Click Add card.
- Select Dataset in the Tables category.
- Select the Dataset you want to use. In our example, we select only the Kubernetes Logs from our staging cluster, and name the card Staging logs.
To add a text card, perform the following steps:
- Click Add card.
- Select Text in the Objects category.
- Use Markdown and some formatting options in the UI to create the text you want.
After you create multiple cards, you can drag and drop them to rearrange the order and layout.
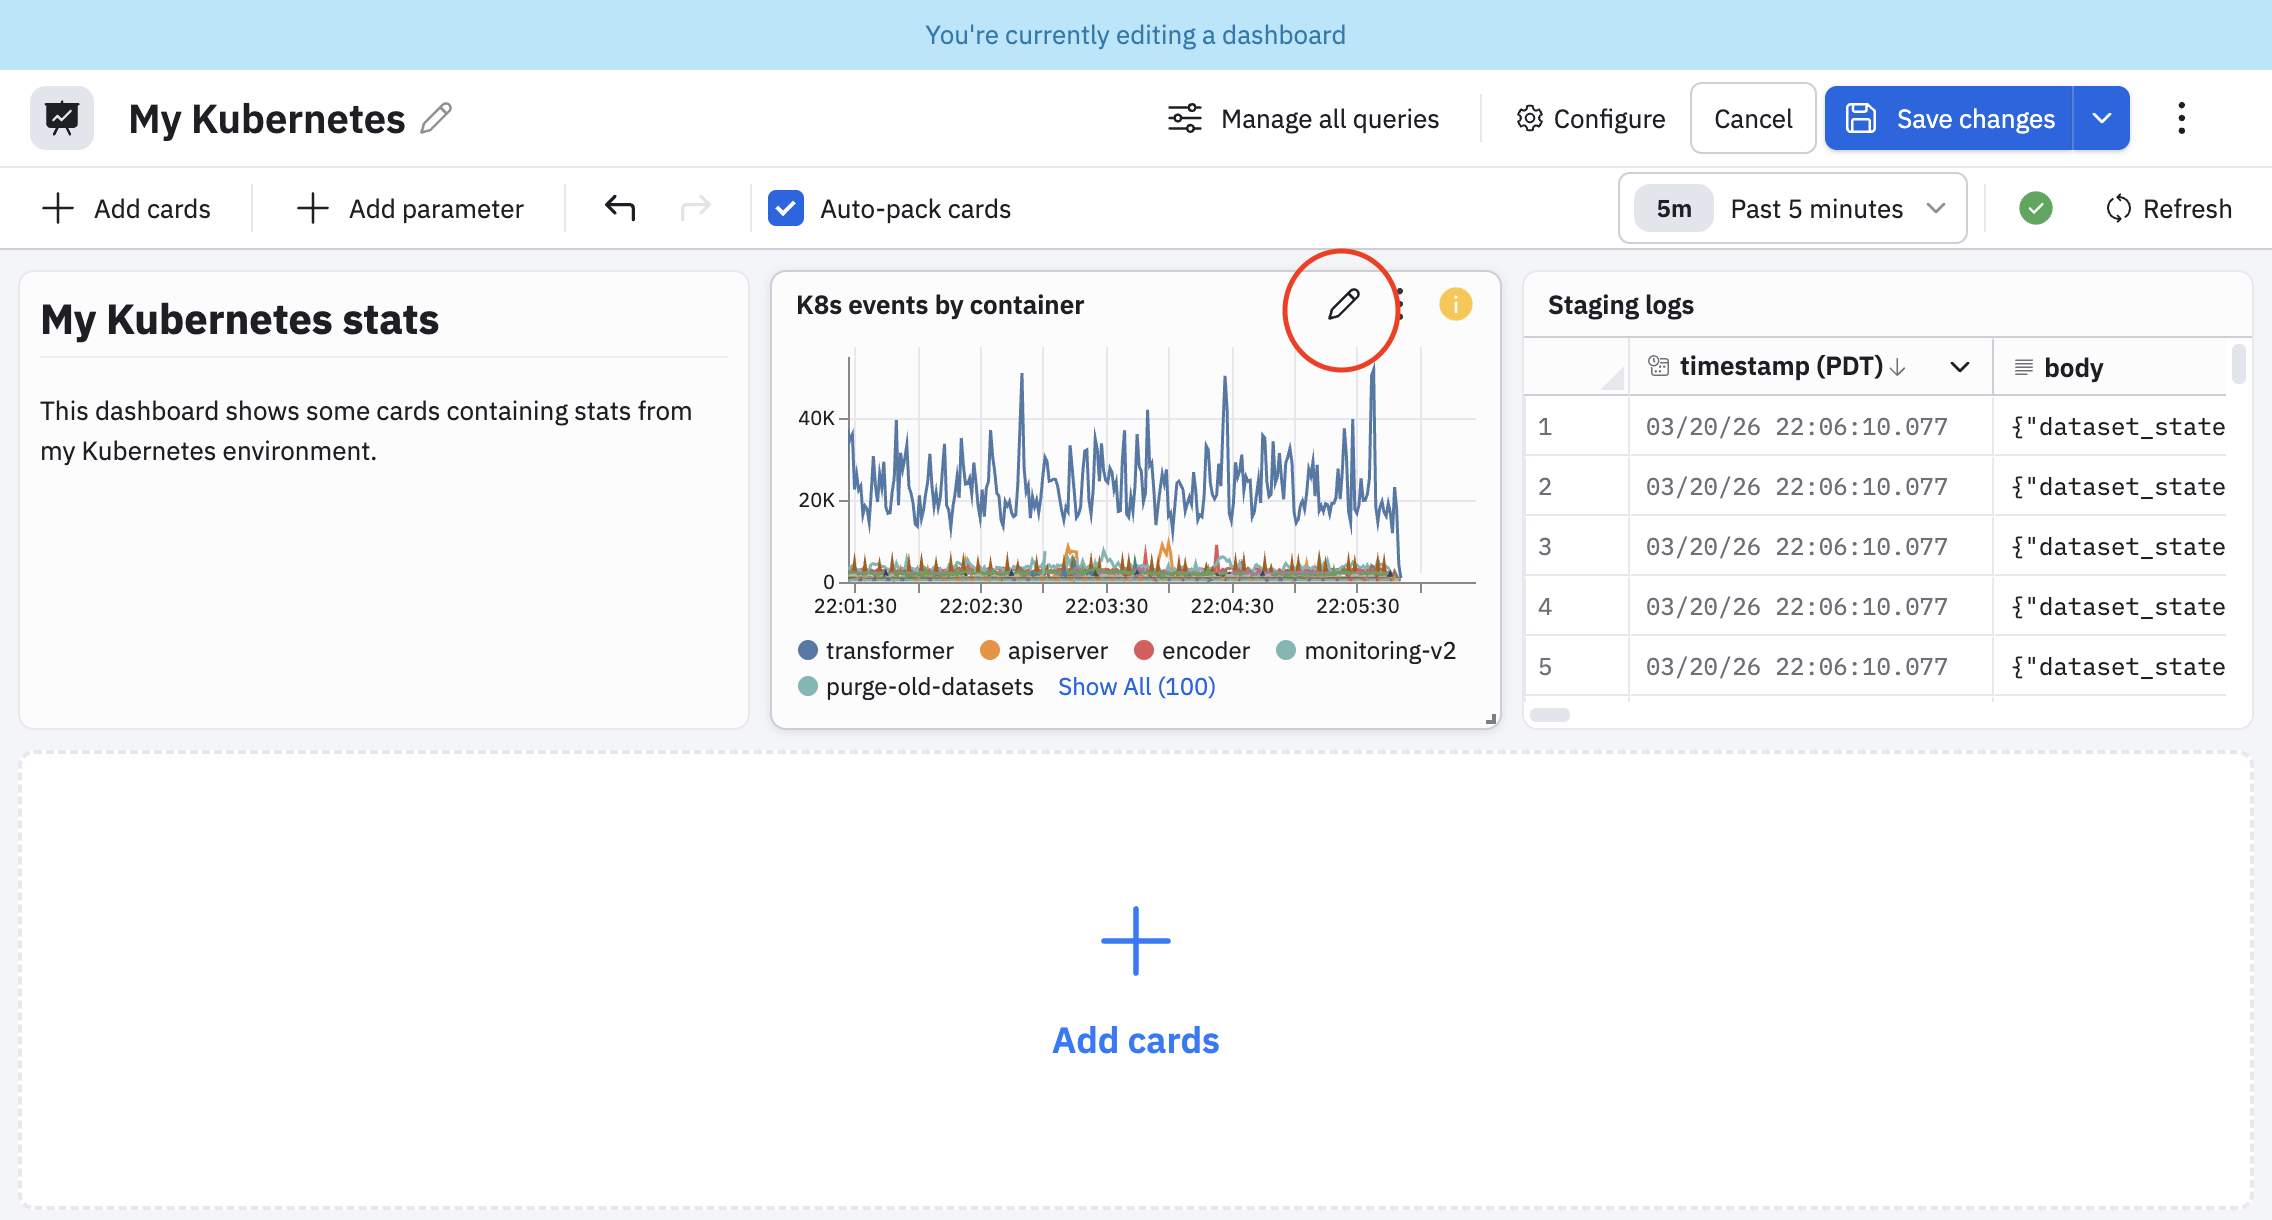
Edit dashboard cards
When editing a dashboard, hover on any dashboard card and click the pencil icon () to edit the card definition.
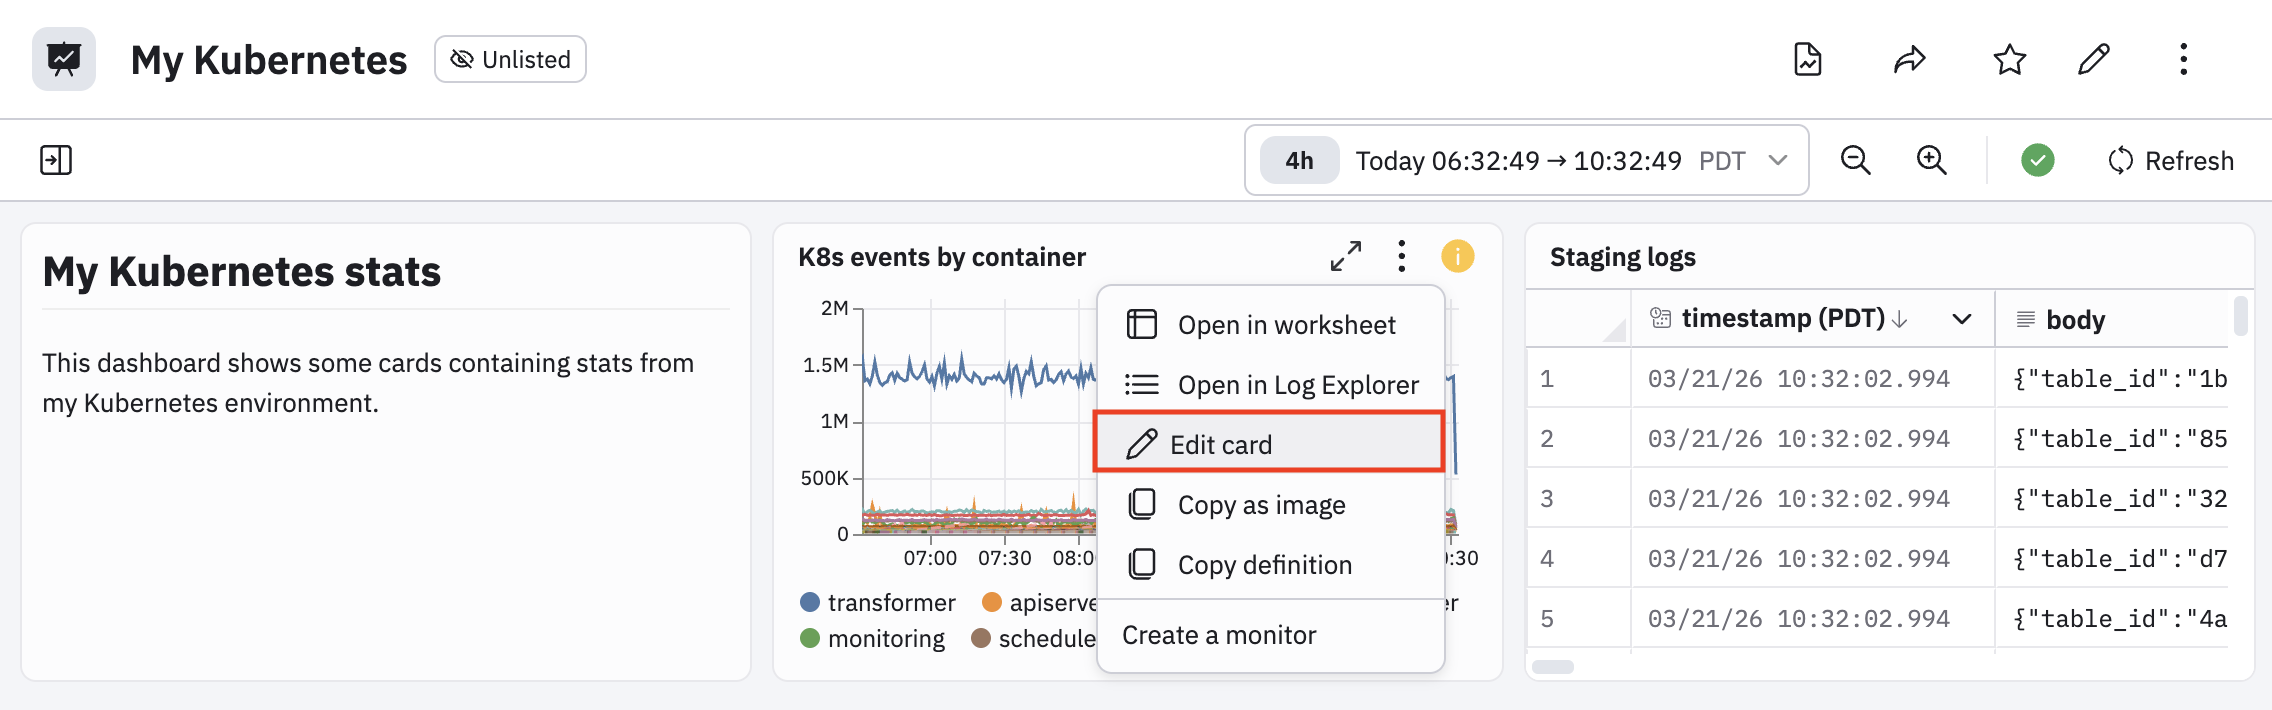
When viewing a dashboard (not in edit mode), click the vertical ellipsis icon (), then click Edit card to edit any dashboard card.
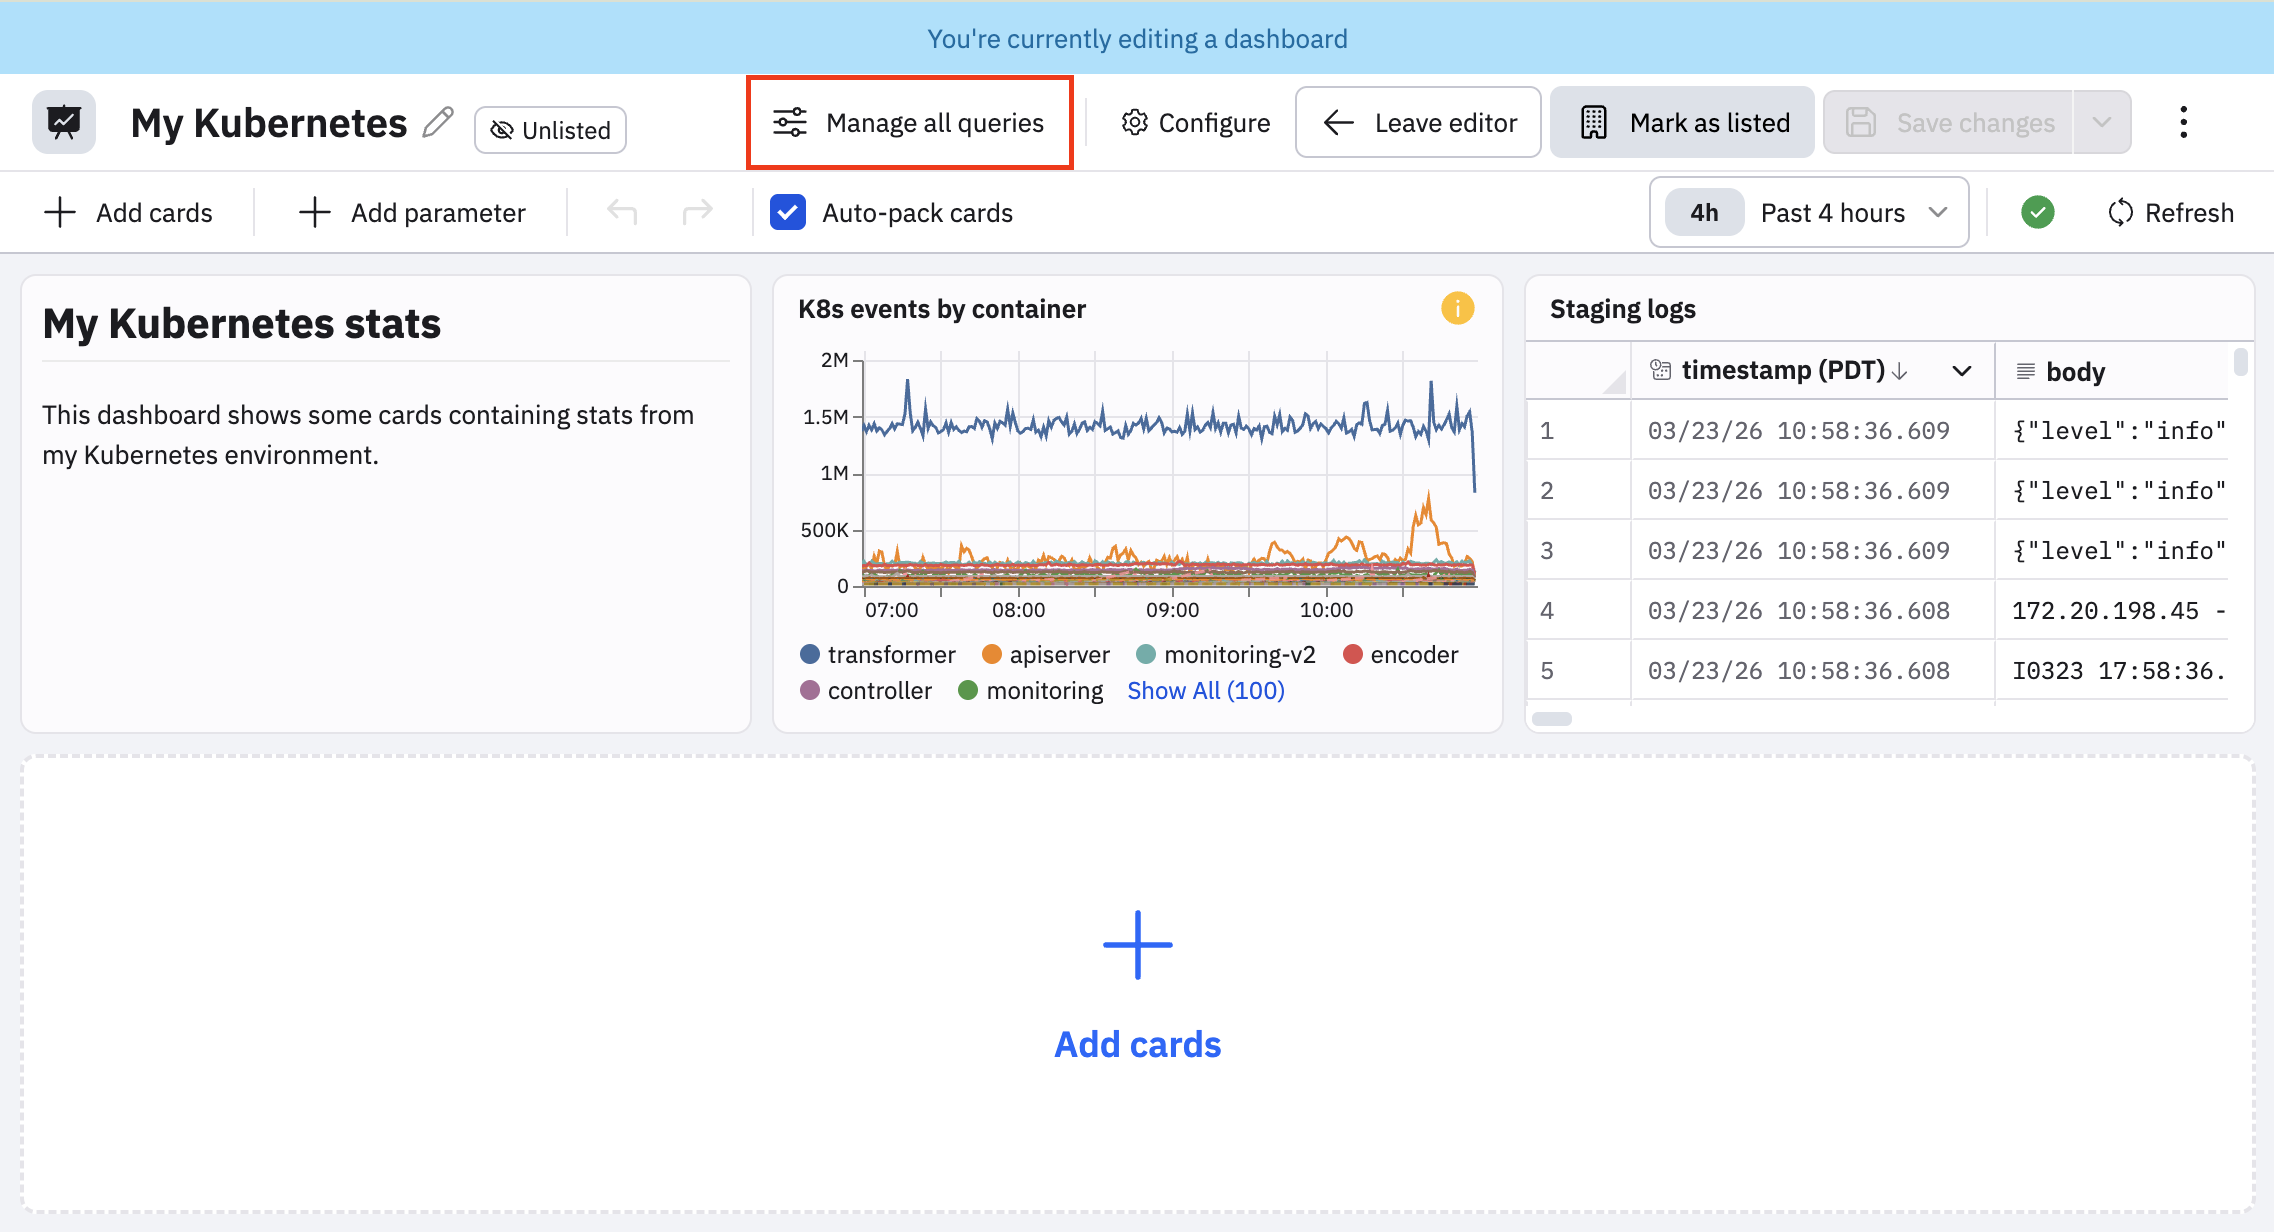
Edit multiple dashboard cards
Use the Manage all queries option when editing a dashboard to open an editor page similar to Worksheets, where you can edit multiple cards at once, along with more advanced settings.
Below are some important workflows available in this multi-card edit mode:
- Bulk query editing. View and modify the underlying OPAL queries for multiple dashboard cards simultaneously, rather than one by one.
- Advanced configuration. Access more granular settings for individual cards, such as hiding specific queries from the dashboard view without deleting them.
- Centralized workflow: Navigate through all the data stages and inputs that power your dashboard visualizations in a single, cohesive view.
Click the ellipsis icon () to get access to the following additional options:
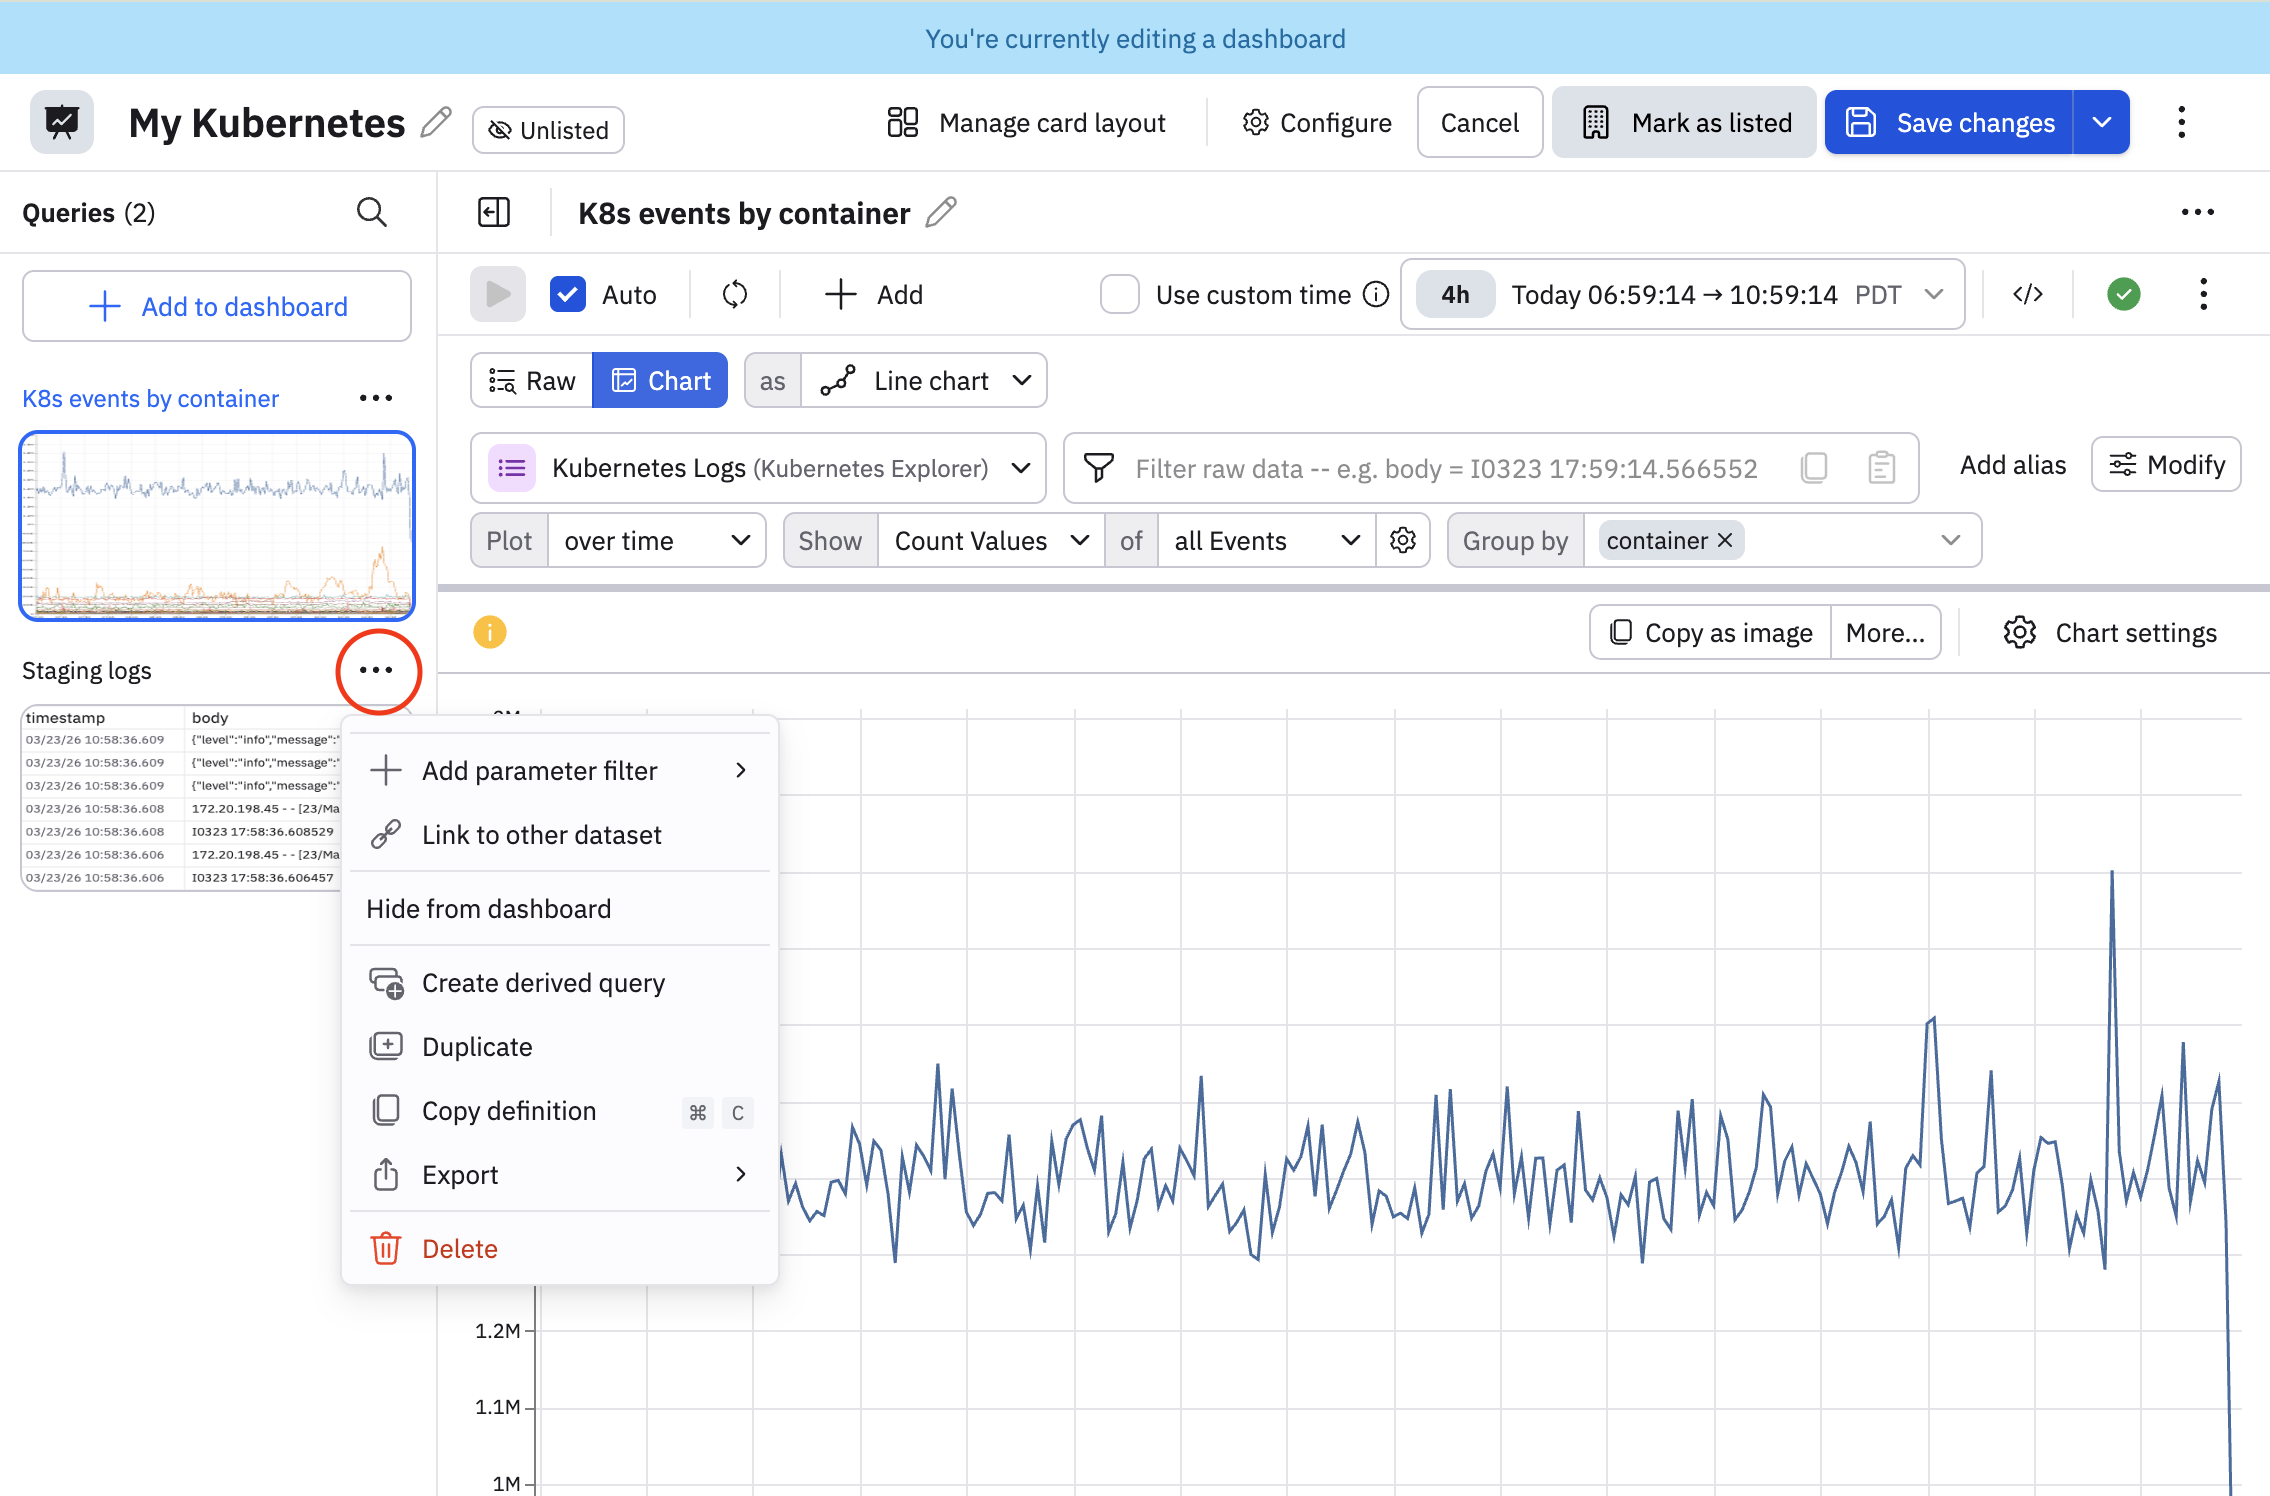
| Option | Description |
|---|---|
| Add parameter filter | Create a dashboard parameter. See Add dashboard parameters. |
| Link to other dataset | Change the source Dataset for a specific dashboard card or to join additional data into that card's existing query. For example, if you realize five different cards should all be pulling from a new consolidated Dataset, you can use Link to other dataset for each one in this single view rather than opening each card's settings individually. |
| Hide from dashboard | Hide this card when viewing the dashboard. |
| Create derived query | Create a new child query based on the current query as the parent. The output of parent query is used as the starting point. |
| Duplicate | Make a copy of this card on the current dashboard. |
| Copy definition | Copy the definition of this card into your cache, so you can paste it in any other dashboard. |
| Export | The following options are available:
|
Click Manage card layout to return to the default card layout screen when editing a dashboard.
Manage and pivot from dashboard cards
Hover on any dashboard the click the vertical ellipsis icon () to access additional options. The options differ slightly depending on whether you are viewing or editing your dashboard.
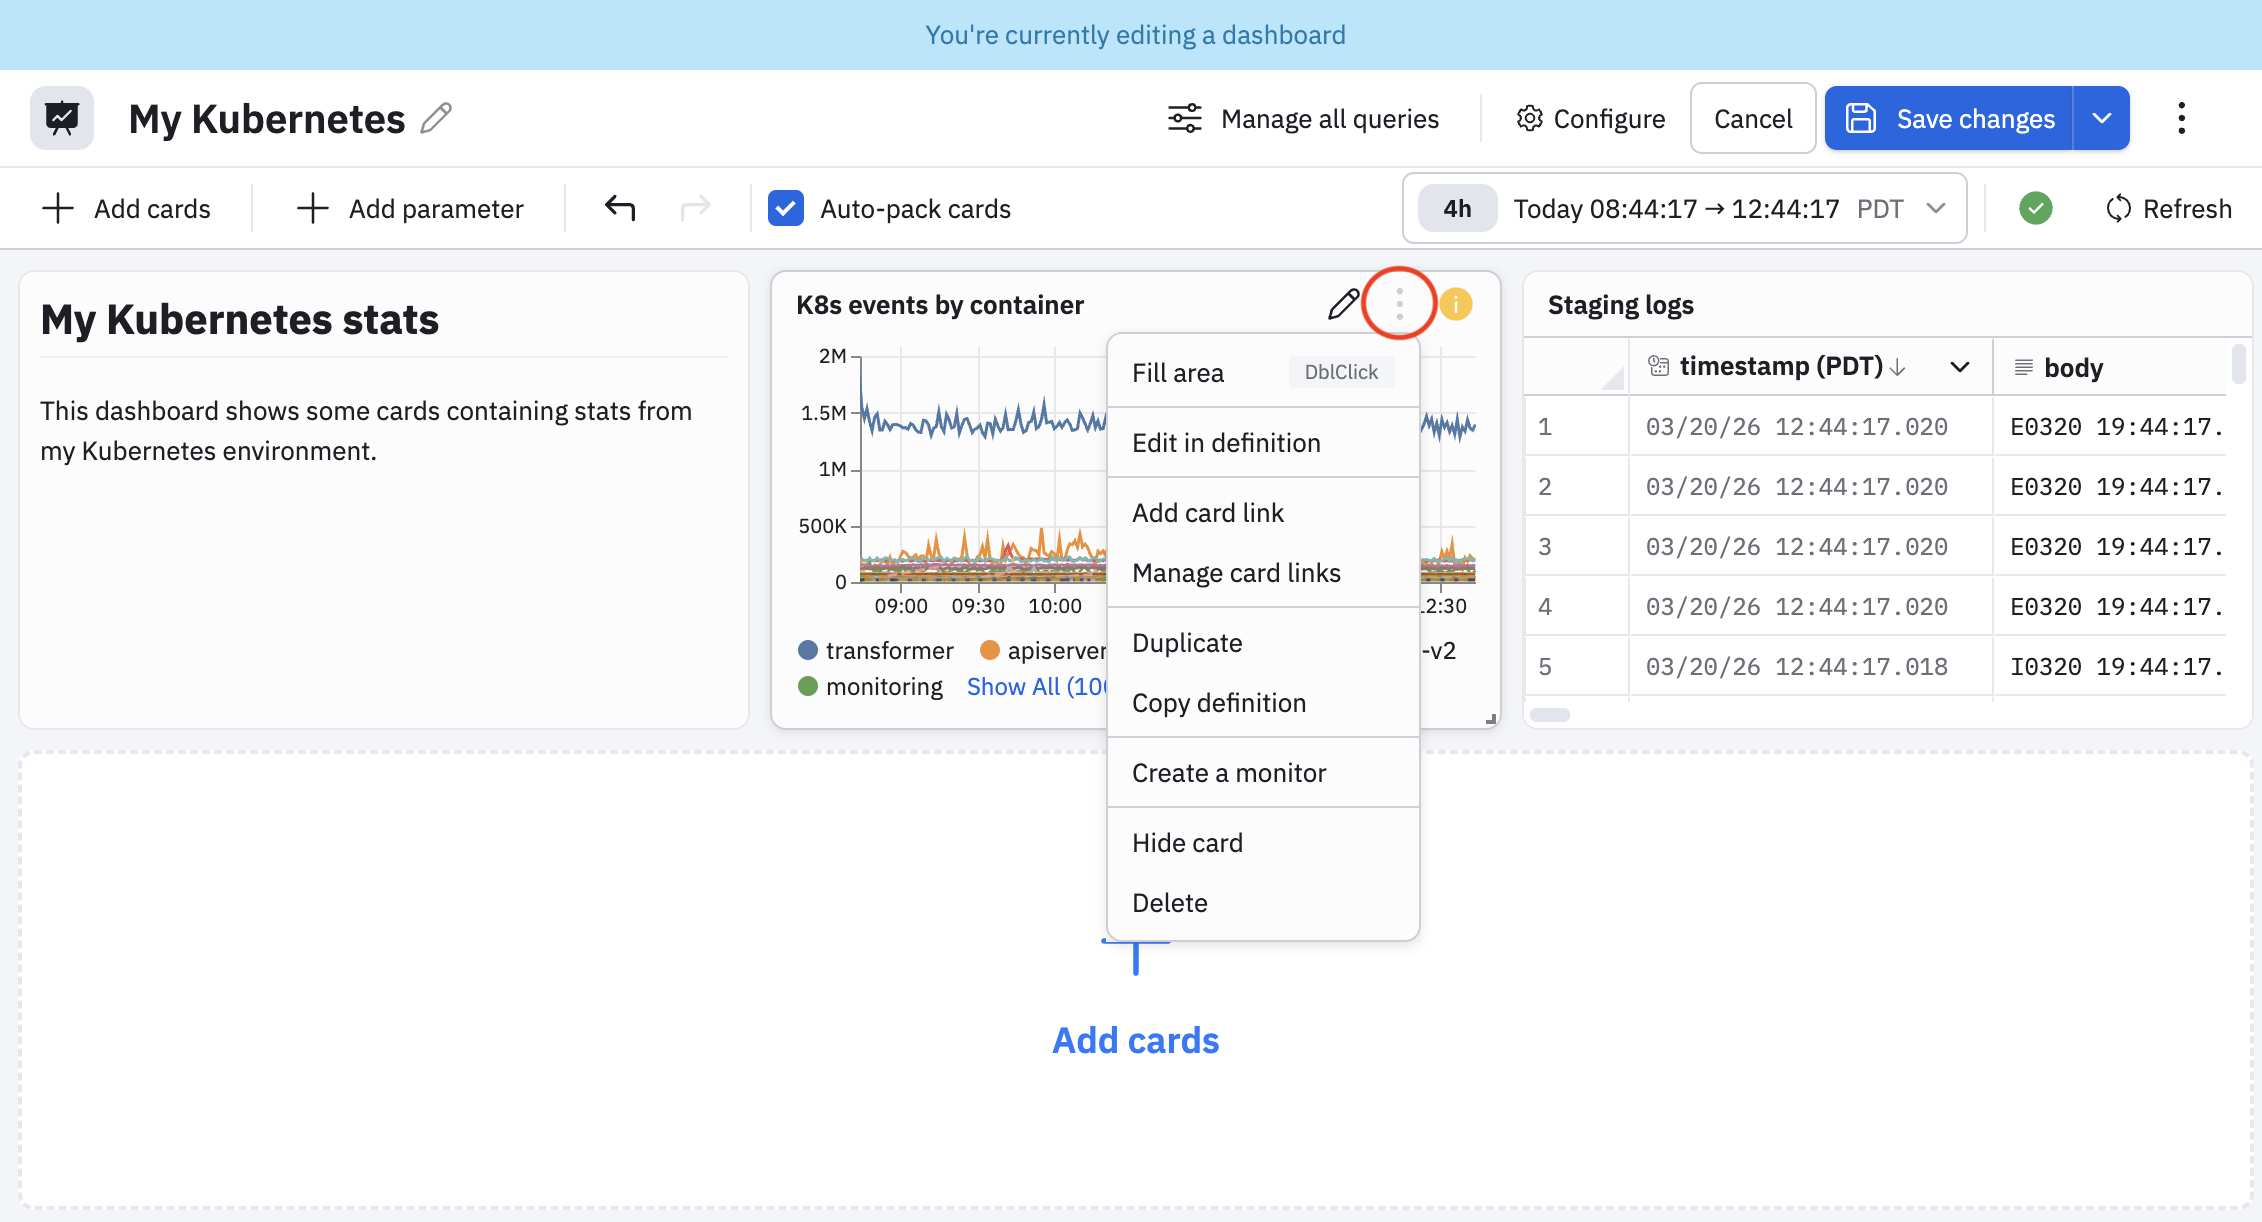
| Option | Description | Available when viewing dashboard? | Available when editing dashboard? |
|---|---|---|---|
| Fill area | This is a formatting option that makes the card fill the entire width of the available space. | No | Yes |
| Edit in definition | Edit the underlying OPAL query of the card. This is not the same as just editing the card, where you can change the visual representation and some basic query parameters. | No | Yes |
| Open in Worksheet | Open the card in a new Worksheet. See Create and share Worksheets. | Yes | No |
| Pivot to an Explorer | In this example, we see Open in Log Explorer because the data powering the card is log data. If the data was metrics data, the pivot option would be Open in Metrics Explorer. | Yes | No |
| Edit card | Open the dashboard card for editing. | Yes | No |
| Add card link | Add a link from this card to another dashboard. | No | Yes |
| Manage card links | View the links configured for this card. | No | Yes |
| Duplicate | Make a copy of this card in the same dashboard. | No | Yes |
| Copy definition | Copy the card definition to the clipboard. Then, from the same dashboard or any other dashboard, click Add card, then select Paste in the Objects category. | Yes | Yes |
| Copy as image | Copy the current state of the card as a PNG image that you can paste into any document. | Yes | No |
| Create a monitor | Create a Monitor based on the data in the card. Observe detects the computations used in the card and automatically selects the best Monitor type for you. See | Yes | Yes |
| Hide card | Hide the card so that the card is not visible on the dashboard. To make the card visible again, click Hidden to view the hidden dashboards, then click + for the card to want to make visible. | No | Yes |
| Delete | Delete the card. | No | Yes |
Pivot from dashboard card context menus
The data in dashboard cards can also be used to pivot or drill down for further analysis or investigation.
For example, we can hover on the Log Volume by Namespace Over Time card and click on any dot in the line chart, or any of the chart labels to access a context menu. Here, we click on the staging label in the card:
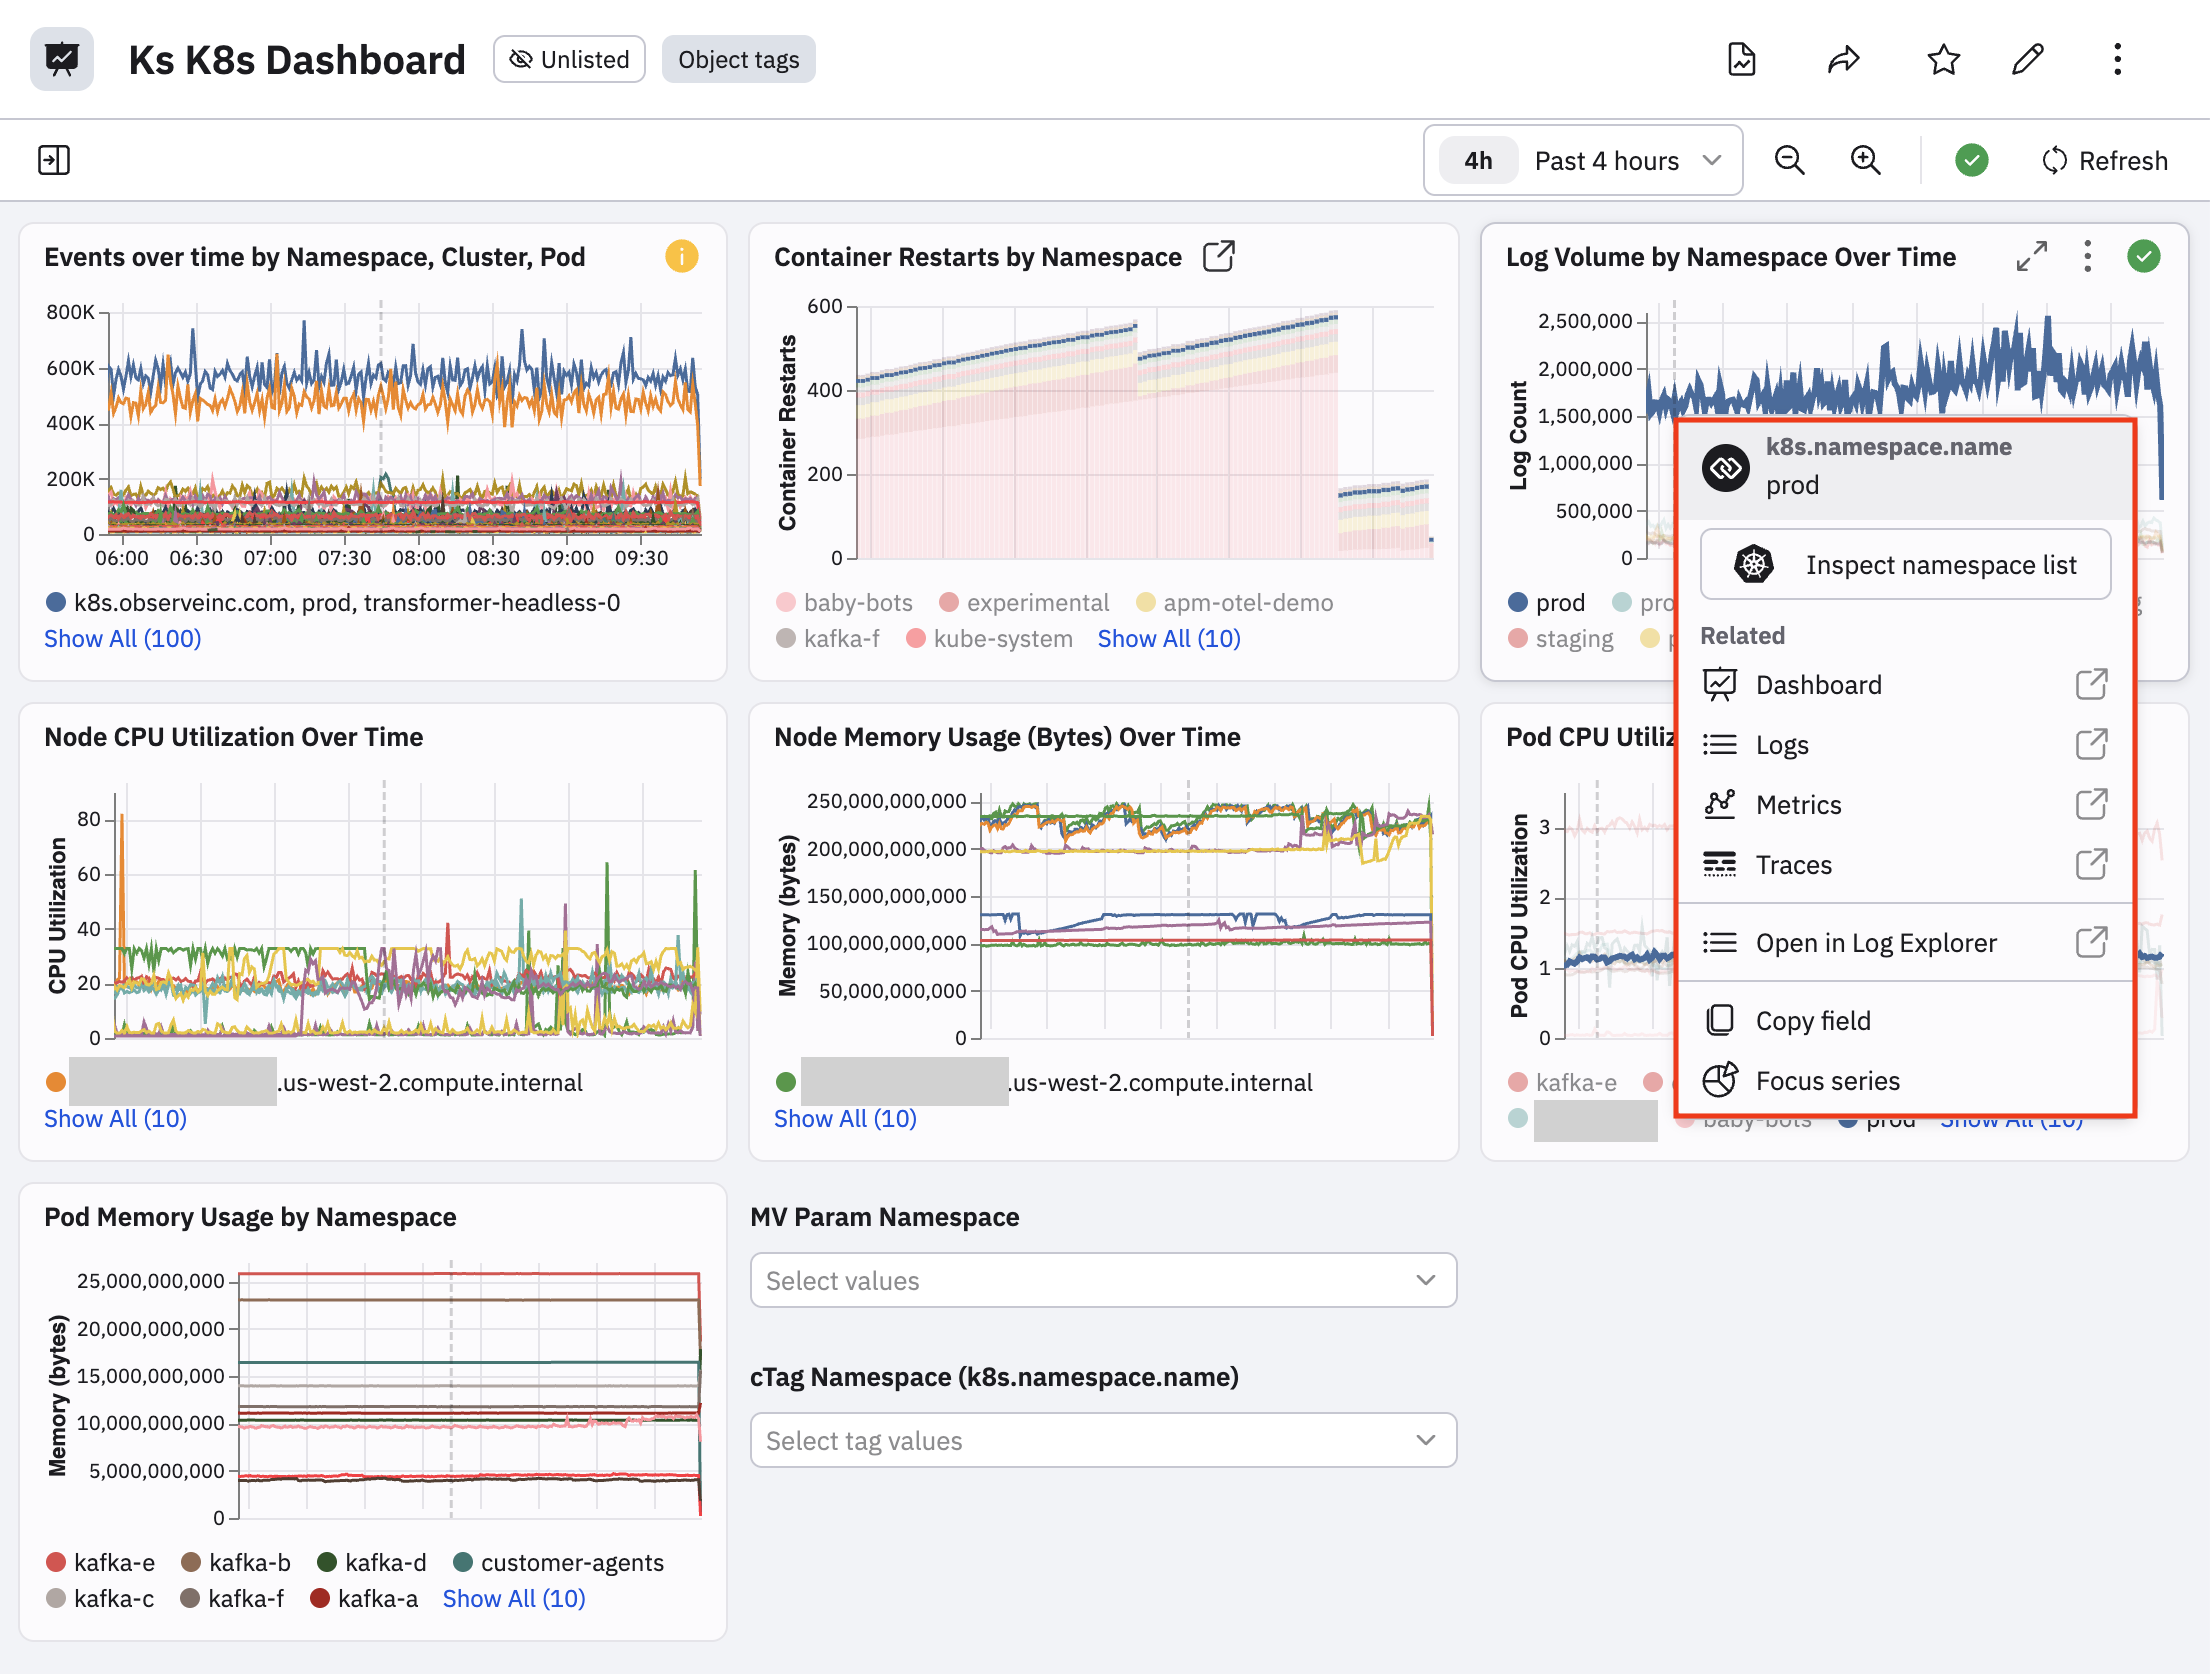
You can pivot to other areas of Observe and start new workflows from the options in the context menu. For example:
- Click Inspect namespace list to pivot to the Kubernetes Explorer.
- Click Focus series to reduce visual clutter and show the data for just the selected time series. Click Remove focus to return to the original view.
For cards that contain multiple tags, the context menu lists the tags so that you can easily pivot based on a specific tag value. For example, the Events over time by Namespace, Cluster, Prod card:
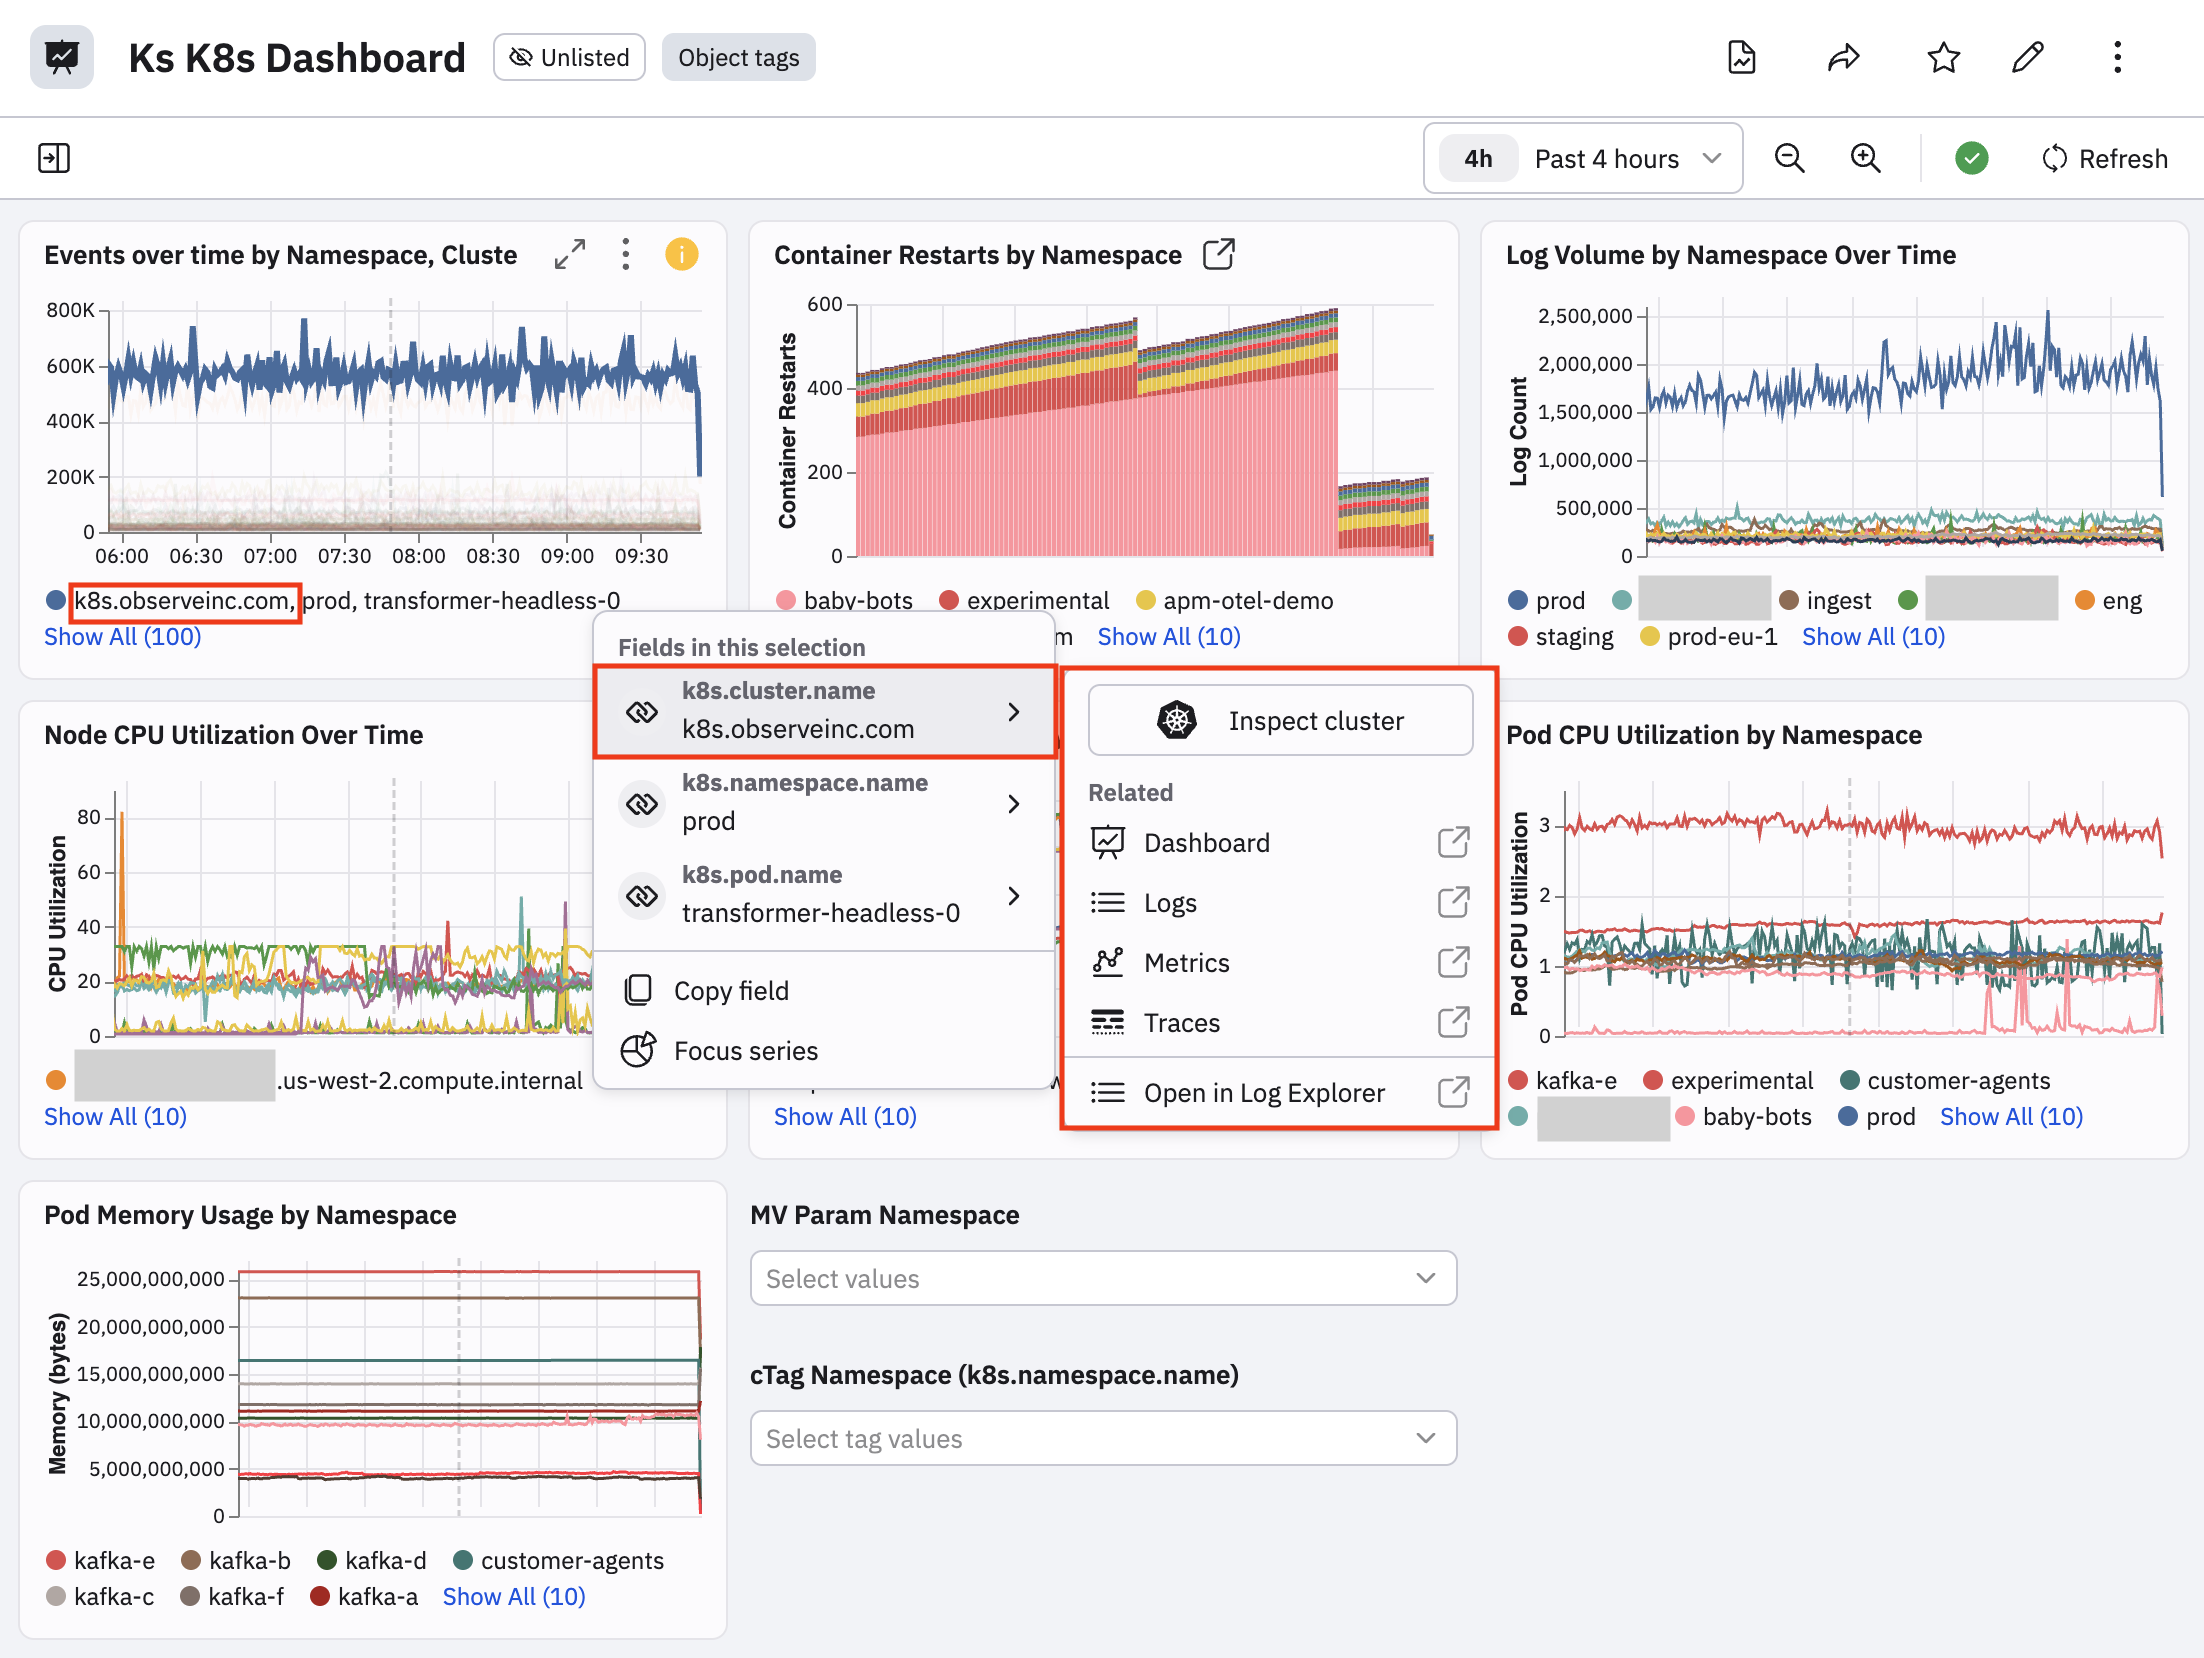
Each field has its own sub menu. For example, you can over on the k8s.cluster.name field to pivot based on the value of that field and carry the value forward when you pivot.
Updated 18 days ago