Manage your Monitors
Introduction to the Monitor Explorer.
Select Monitoring from the left navigation rail to view a list of existing Monitors configured on your instance.
The major components of the Monitors Explorer are described below.
| Component | Description |
|---|---|
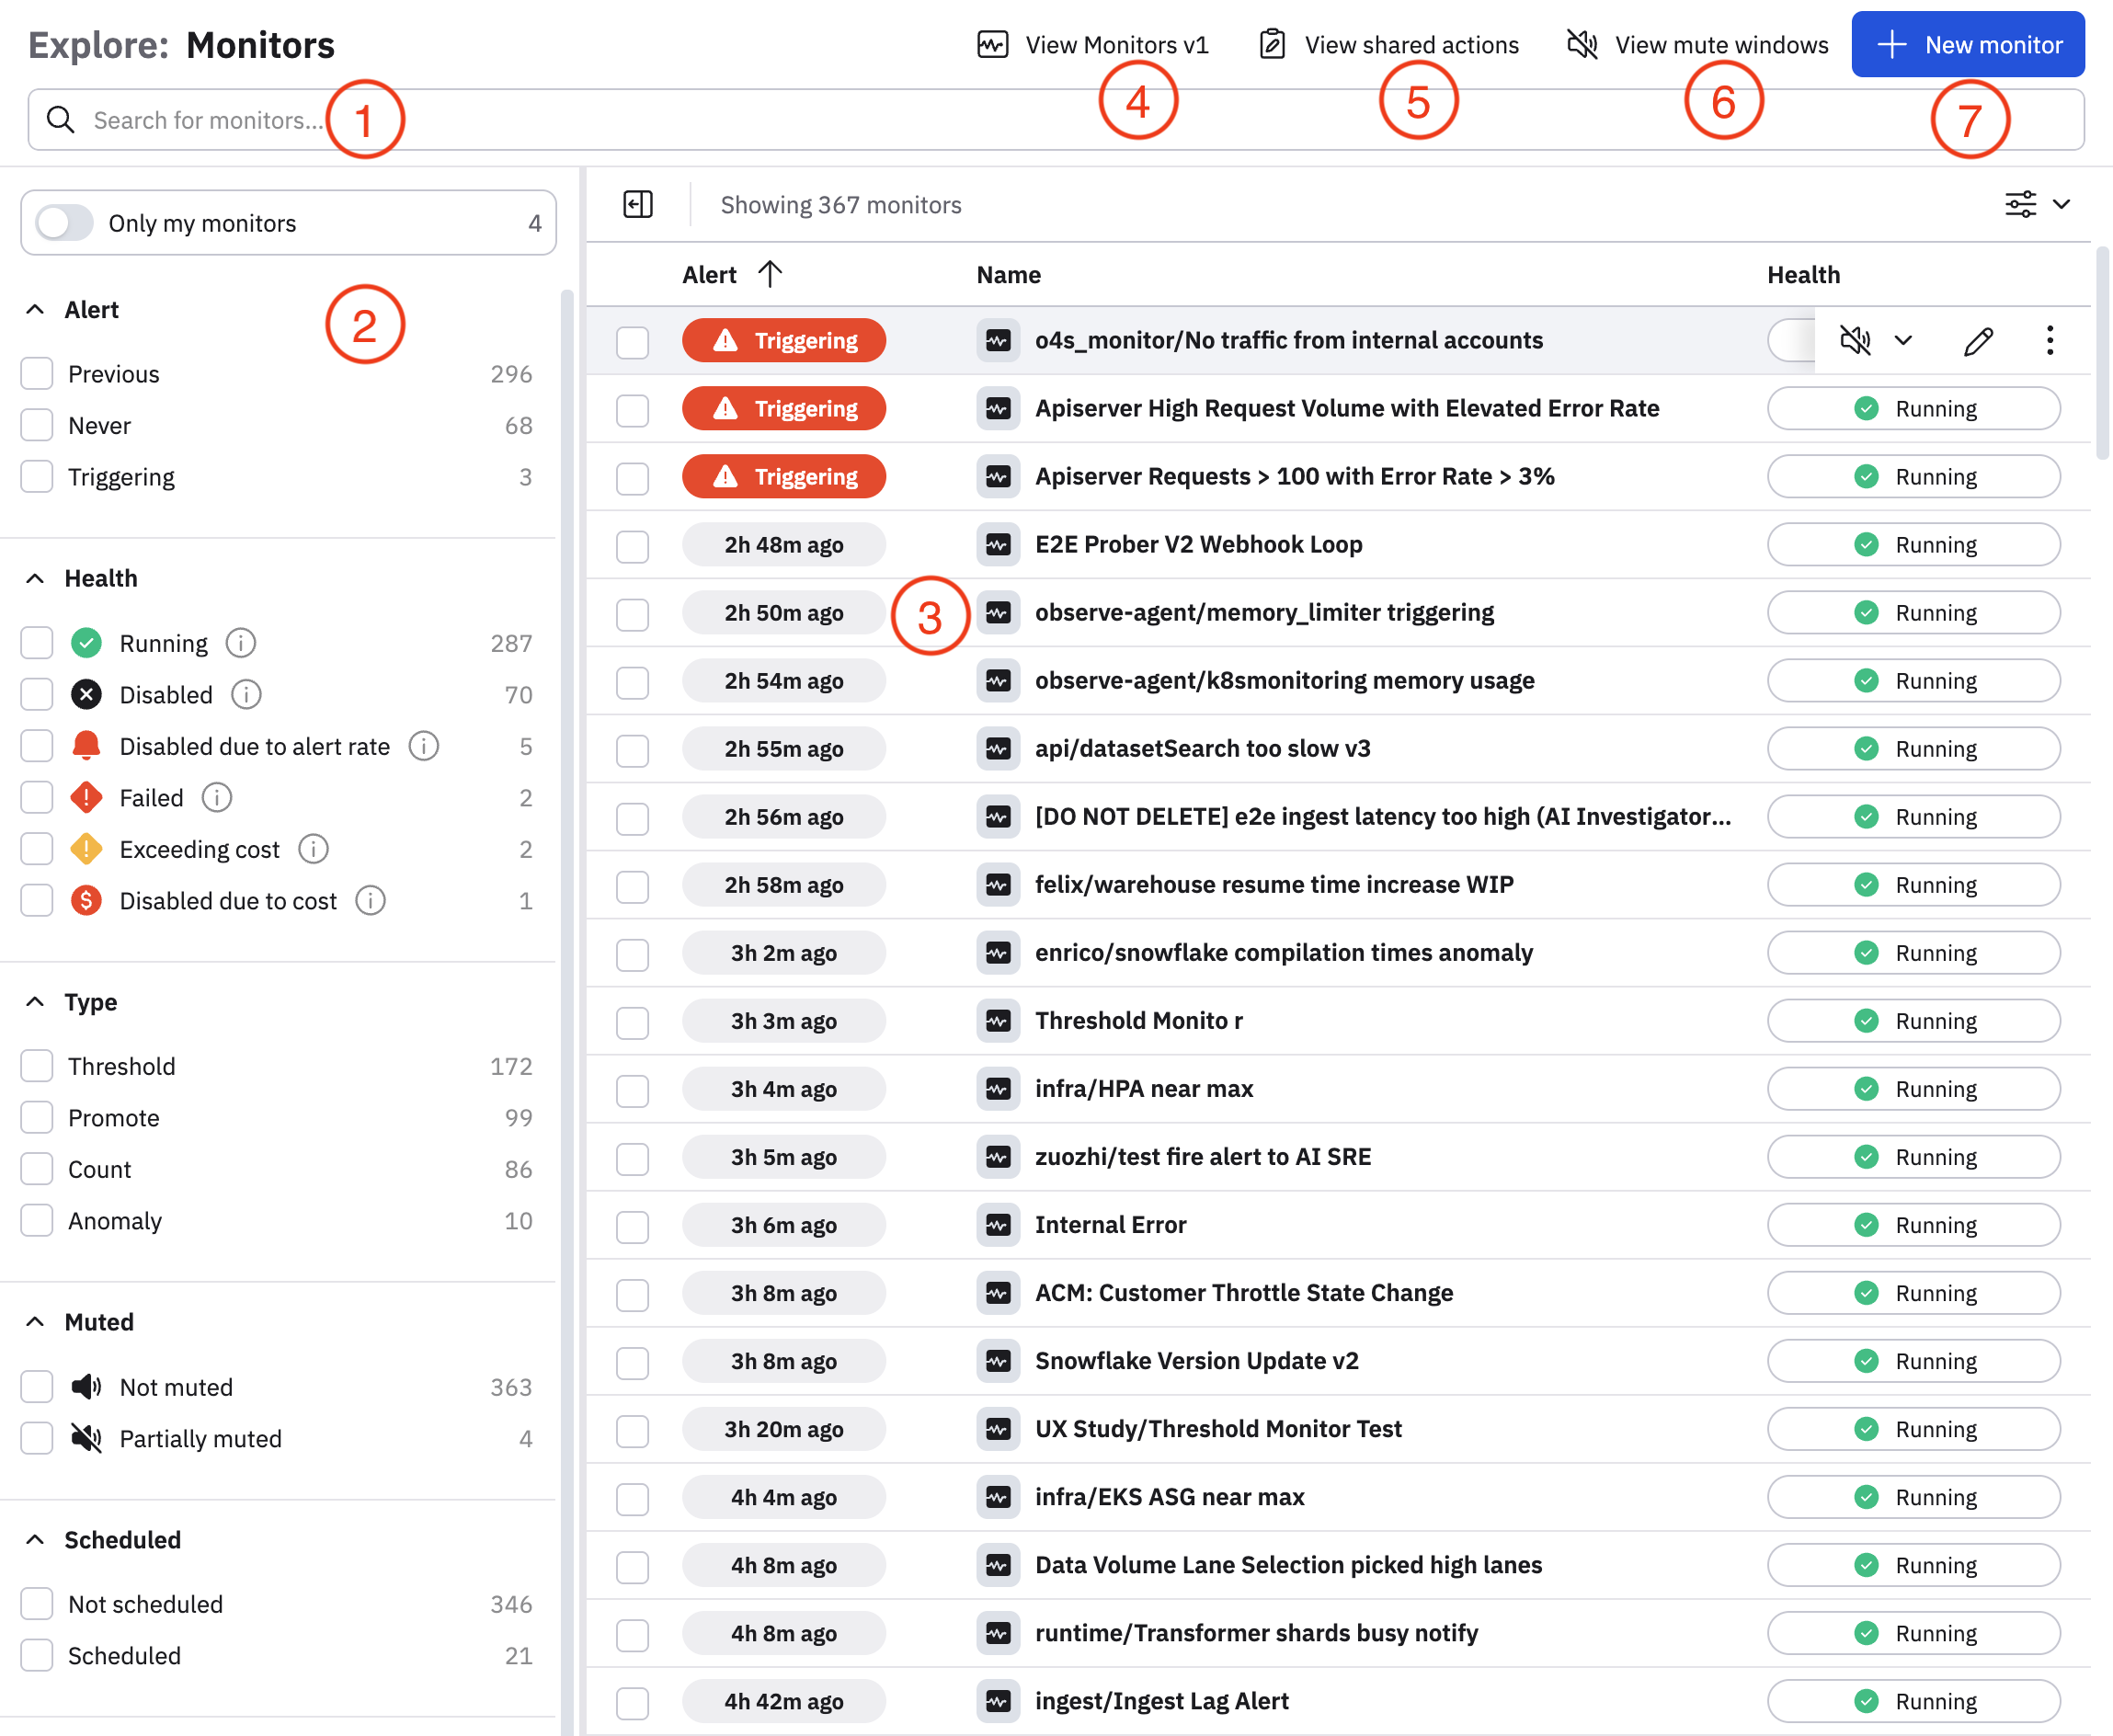
| (1) Filter bar | Enter any text to search for specific Monitors. For example, you can search by status, Monitor name, or anything in a Monitor's description. |
| (2) Filter panel | Select any option from the filter panel to limit the Monitors shows in the list of Monitors. Any option you select here appears in the filter bar. For example, if you click Running to view only Monitors that are actively running, you will see health = Running in the filter bar. |
| (3) Monitors list | The list of Monitors that apply to your filter criteria. If you don't specify any filters, Monitors are listed by Alert, so that actively triggering Monitors are listed at the top, followed by Monitors listed by how recently it generated an alert. A Triggering badge next to a Monitor's Alert column means the Monitor has currently active alerts. Hover on any Monitor to get quick access to additional actions, such as edit, mute, enable or disable, duplicate, or export. |
| (4) View v1 Monitors | View v1 Monitors. See Conversion from earlier Monitor types. |
| (5) View shared actions | View any configured shared actions that can be applied to existing or new Monitors. See Configure shared actions. |
| (6) View mute windows | View or configure mute windows for your Monitors, where they will not generate any alerts. See Mute a Monitor. |
| (7) Create new monitor | Begin the workflow for creating a new Monitor. See Create Monitors workflow. |
Monitor health states
Reported health can be in one of the following states:
| Health state | Description |
|---|---|
| Running | The Monitor is working as expected. |
| Warning | The Monitor is executed as expected but has issues that need investigating. Warnings may be caused by trouble reaching destinations, upstream data changes that invalidate findings, or similar concerns. |
| Failed | The Monitor's most recent attempt to evaluate data ended in an error. |
| Disabled | The Monitor is not evaluating because a user has manually disabled this Monitor. To enable a Monitor, hover on its name in the Monitor Explorer, click on the vertical ellipsis icon () and slide the toggle in the Disabled field to the on position. The text changes from Disabled to Enabled. |
| Disabled due to alert rate | The Monitor is generating a very large number of alerts and has automatically been disabled. See Monitors generating too many alerts are automatically disabled . |
| Disabled due to cost | The Monitor has exceeded your daily credit limit throughout the length of the grace period and has automatically been disabled. See Per-user query limits help protect your organization's compute budget . |
| Exceeding cost | The Monitor has exceeded 100 credits for more than 24 consecutive hours. Contact support to have Observe help you adjust the query in this Monitor. |
When a Monitor is disabled, notifications are sent using the appropriate channels. See Notifications sent when a Monitor is disabled.
Monitors generating too many alerts are automatically disabled
Noisy Monitors generating a high number of alerts are automatically disabled.
You can configure this threshold in the Evaluation settings when you configure any Monitor. By default, the threshold is set to 100 alerts per hour, but you can change this number if you expect to have a Monitor generating a higher number of alerts.
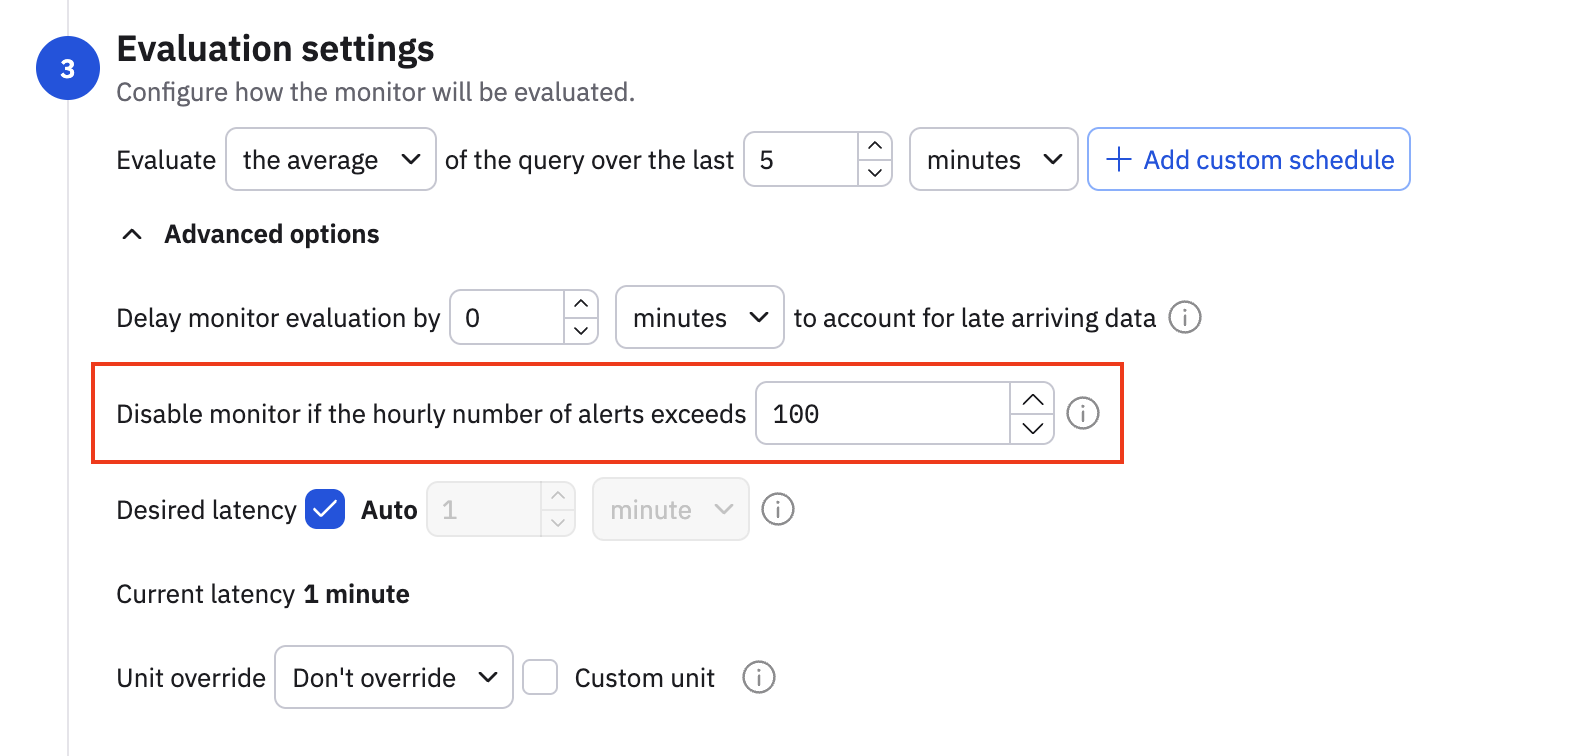
Observe automatically disables any Monitor generating more than 3,600 alerts per hour.
Per-user query limits help protect your organization's compute budget
Query Compute limits are protection mechanisms by Observe which provide a guardrail against abnormally heavy usage of the product. If this ever does happen - it's usually an indication that the product is being used in a way that wasn't originally intended; please reach out so that we can help determine the best way to address that use case.
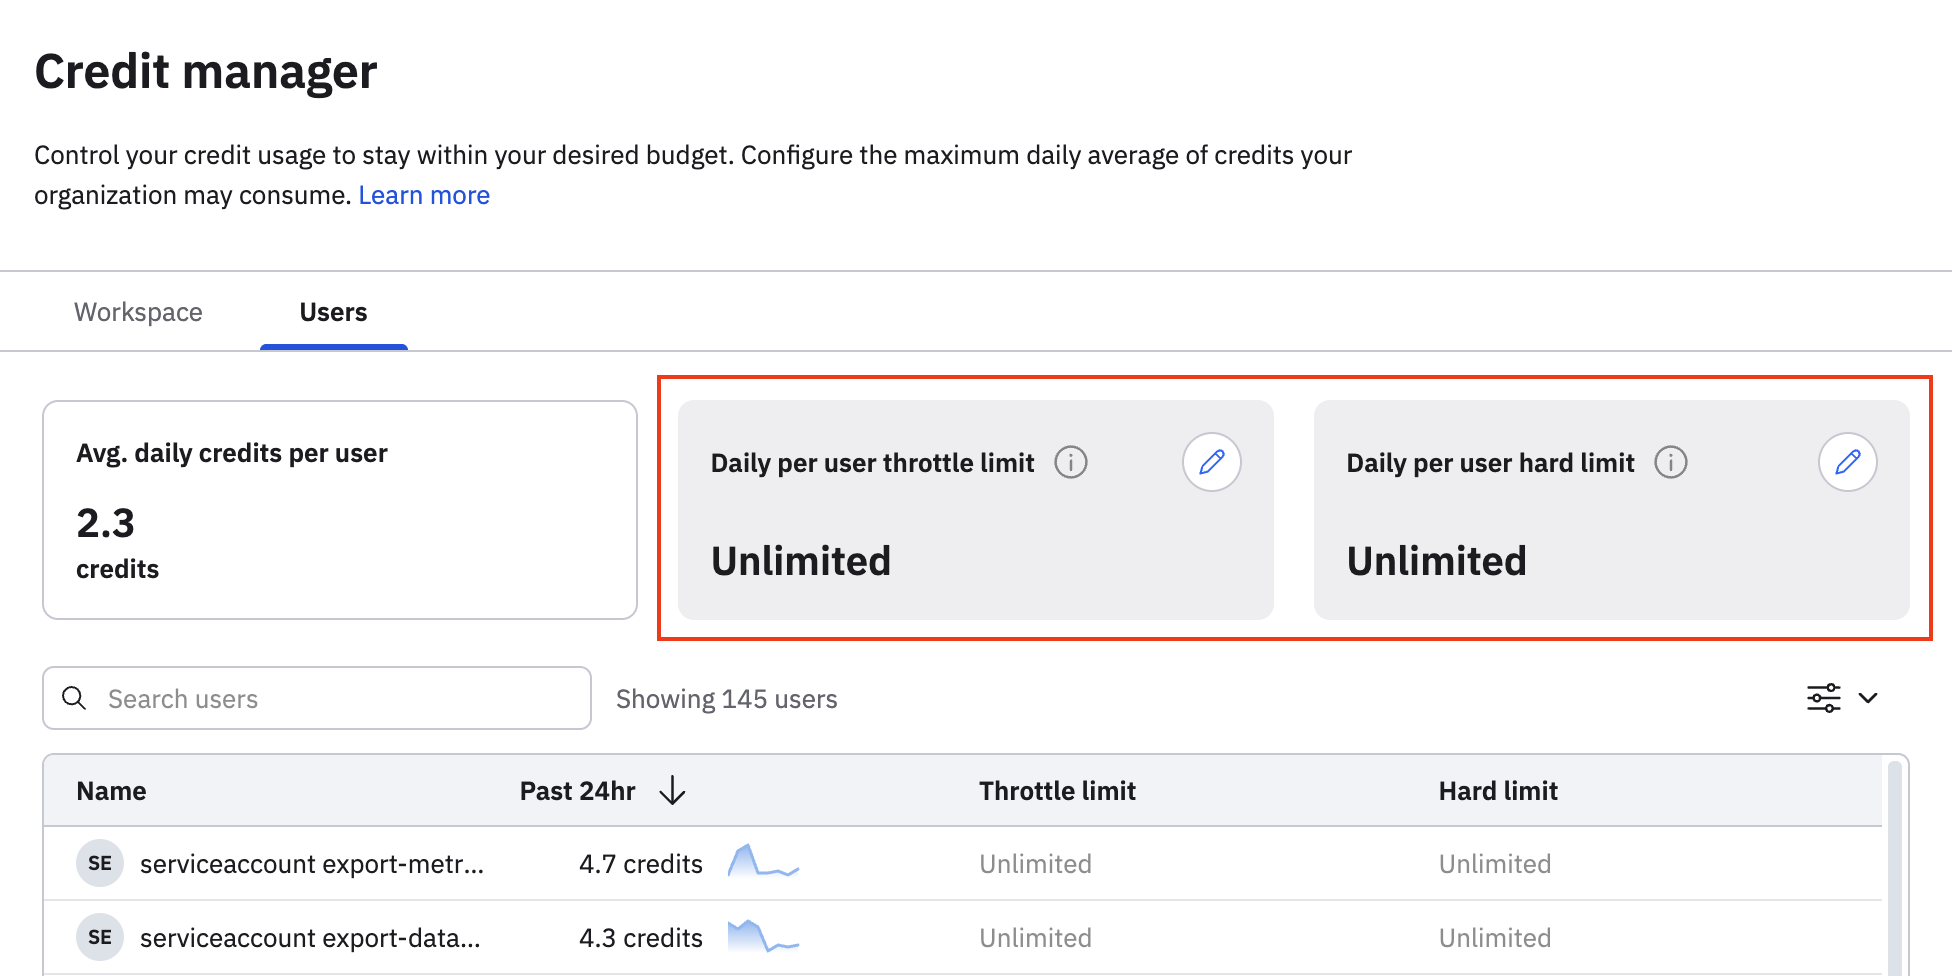
To give you more control over how query compute limits are shared across your organization, Observe applies default per-user credit limits in addition to your organization-level limit. Now, if a small number of Users in your organization uses a high amount of compute - only these users will experience any query throttling, and not the whole organization. These limits are set high enough to ensure that even typical power users will likely never hit them, but less than the organization-level limit, to provide overall protection.
You have full control over per-user limits. From the Observe UI, you can view and adjust query credit limits for individual RBAC groups or specific users to suit your organization's needs. This means that if you have power users who you need to be able to use more than others, you can configure this. Please note giving a User a very high user limit may make it more like the than organization hits it's organization-level limit.
To get assistance understanding or configuring your query credit limits, contact your Observe account representative or visit the Observe Support Portal.
Notifications sent when a Monitor is disabled
When a Monitor is disabled, the following notifications are sent:
- Emails to the Monitor owner and last updater (most recent user to update the Monitor). In the case that the Monitor owner or last updater are not available, for example, they left the company, the recipients from the Monitor email actions (other users or static addresses without templates) are notified.
- Everyone else the Monitor is configured to notify in the action rules. All webhook, Slack, and PagerDuty actions are run for all URLs that are valid and allowed.
Common trouble states
The following table summarizes the common trouble state for health monitors:
| Trouble state | Description |
|---|---|
| Failed to evaluate monitor | This causes a Failed health state that lasts until the next successful execution. A Monitor may fail to evaluate because of dataset re-materialization. Materialization failures may indicate hitting an on-demand materialization limit. Resolving this state requires reviewing your Usage Dashboard and Acceleration Manager to determine if Datasets the monitor needs are unable to materialize. |
| Detected upstream data updates | Observe maintains awareness of monitored data stability, and will set a Warning state due to changes to data that has already been evaluated. Changes in upstream data can lead to flapping of alert states, false negative, or false positive alerts. The root cause of a change can be due to late-arriving data or a stability delay that is not sufficient for the expected upstream data. Note that upstream stability is not only a matter of external data providers; data instability can be produced by joining a dataset with a periodic update as well. To correct this issue, gradually increase the Monitor's stabilization delay value. |
Updated 2 months ago