Host Quickstart
About the Host Quickstart app
The Host Quickstart app provides the easiest way to start monitoring your Linux, Windows, or macOS using Observe. It quickly surfaces logs and metrics within the Log and Metric explorers, ensuring a streamlined setup.
This app leverages the Observe Agent for Linux, Windows, and macOS, offering a lightweight installation to simplify the process. Configuration instructions for collecting logs and metrics can be found within the app’s configuration panel in the UI-based installer.
NoteThe Observe Agent sends metrics in Prometheus format by default. Since the Host Quickstart app is modeled on OpenTelemetry Metrics format, follow
Using OpenTelemetry Metrics with Observe Agent v2
to continue sending metrics in OpenTelemetry Metrics format.
How does it work?
Observe’s Host Quickstart app helps you monitor your servers’ health and activity through:
- A logs Dataset (Logs) with log files being shipped from your host.
- A metrics Dataset (Metrics) with common host metrics collected from your host.
- A resource Dataset (Source) to quickly show you the hosts your are monitoring that links to associated logs and metrics.
- A simple home dashboard that shows high level logs and metrics with links to our log, metric and resource explorers.
- A simple health dashboard to monitor the health of the otelcol agent installed on your server.
View host data in Observe
View the logs, metrics, and resource Datasets.
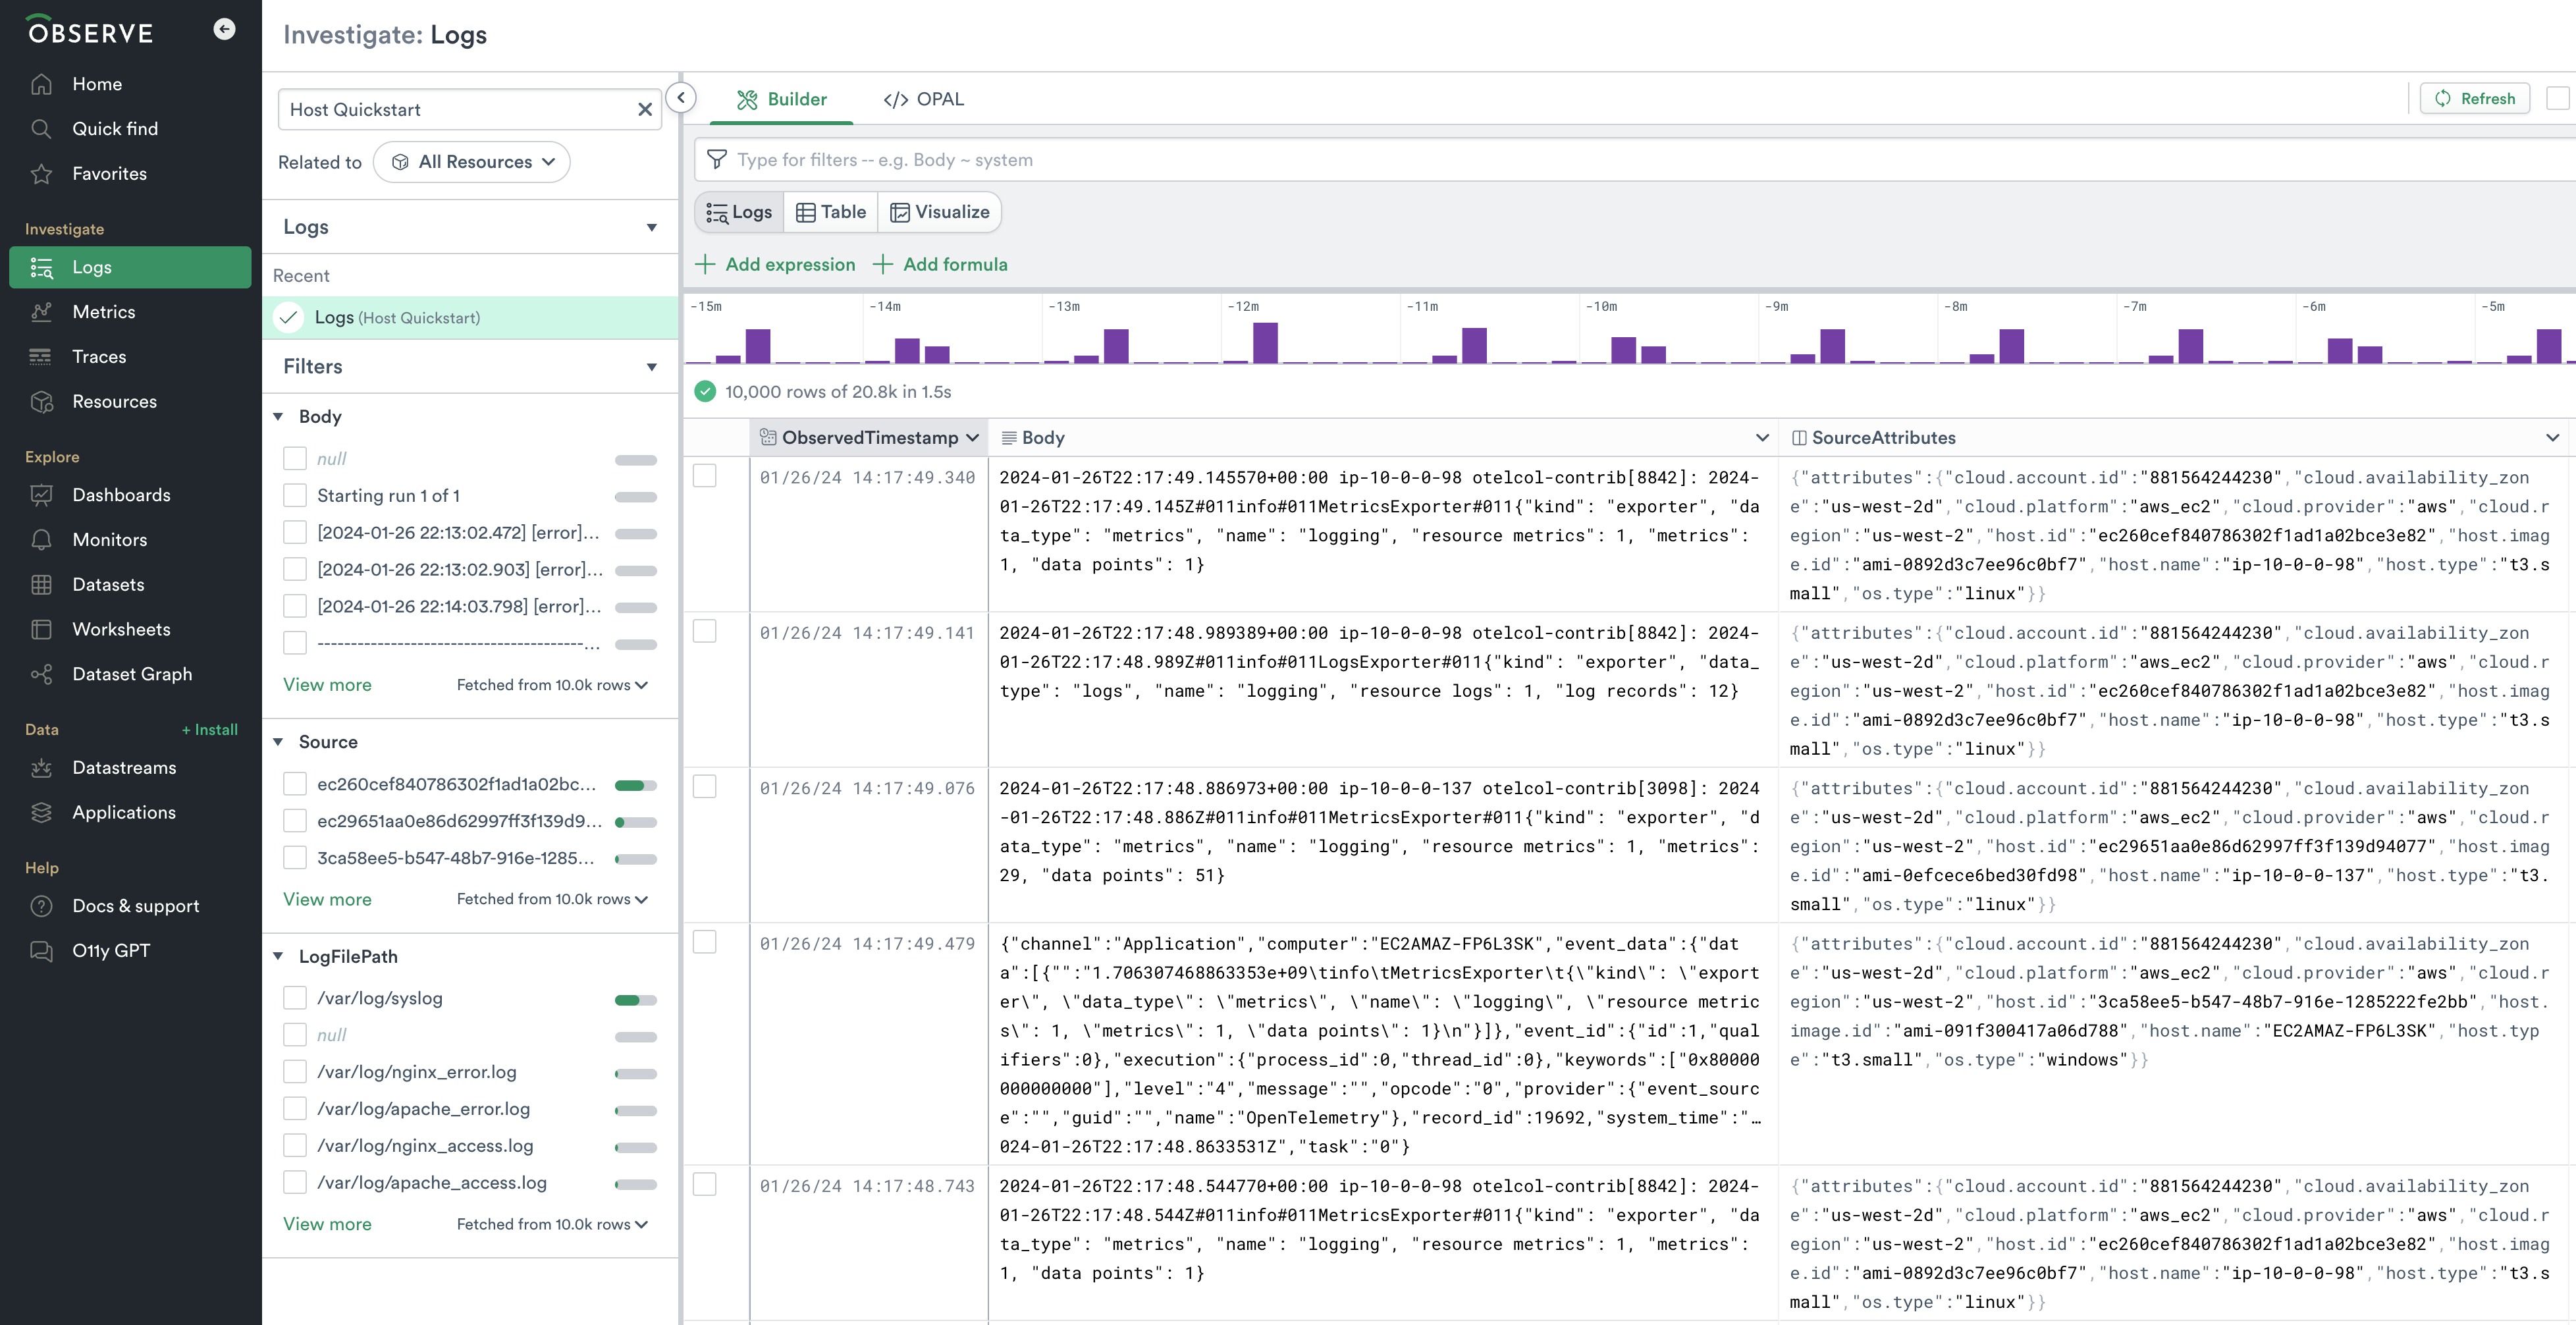
Log Dataset
The Logs dataset can be viewed in the Log Explorer. If you type Host Quickstart in the search on the left hand side - under Investigate Logs - of the screen you will find the Logs dataset.
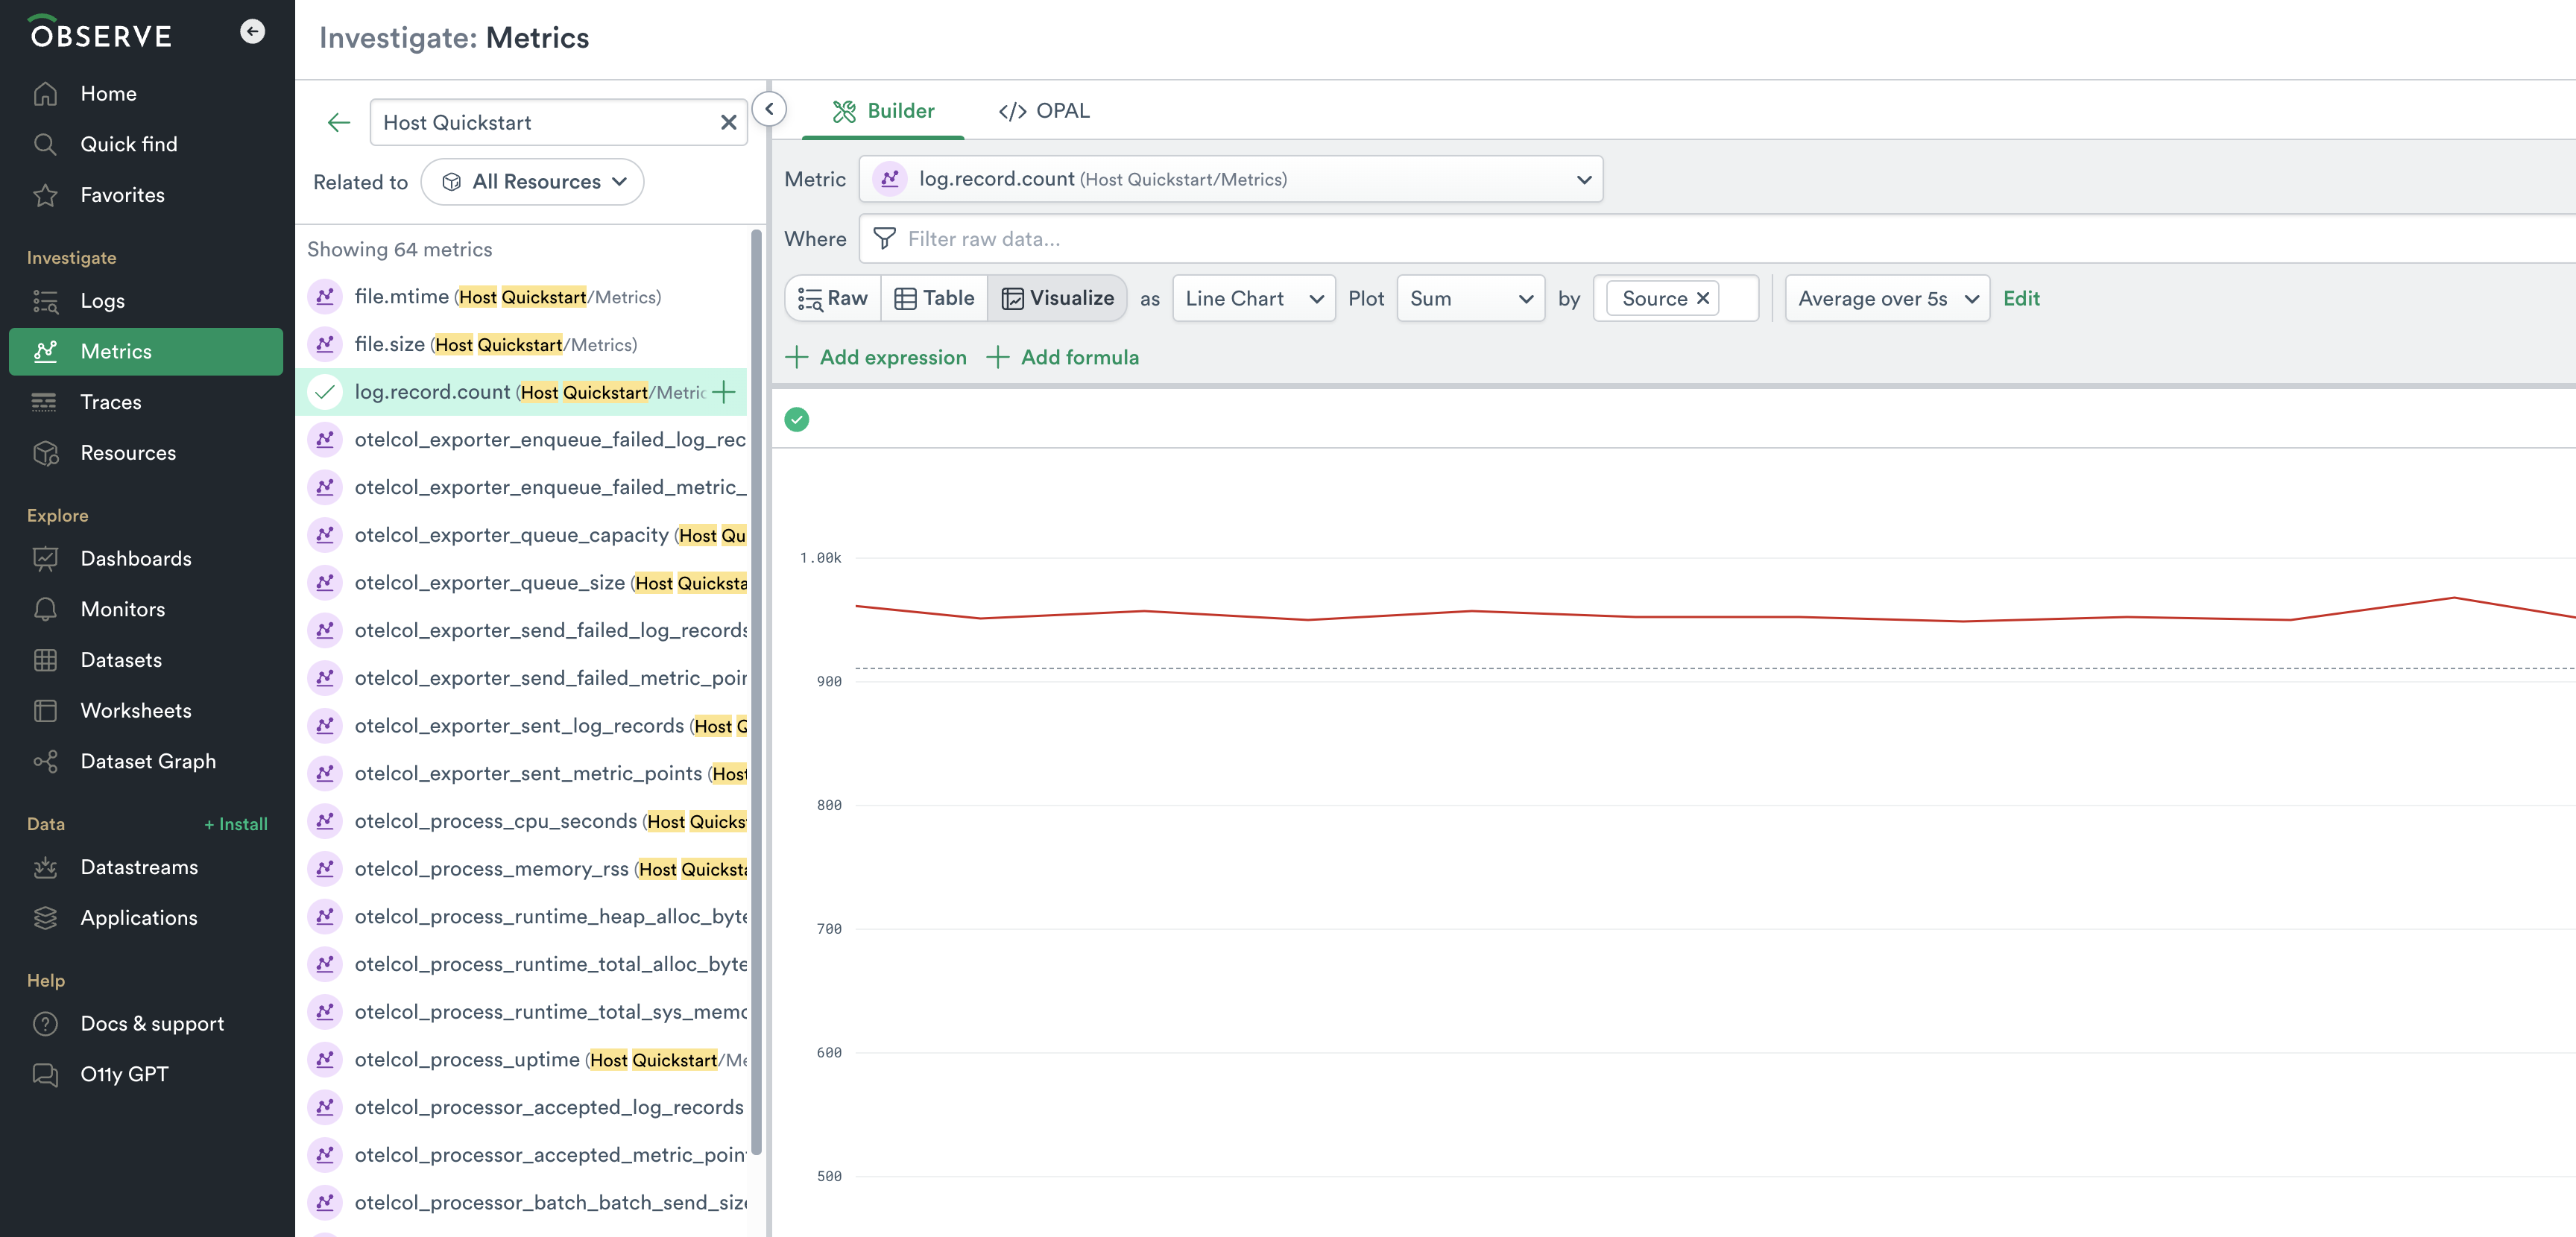
Metric Dataset
The Metrics dataset can be viewed in the Metrics Explorer. If you type Host Quickstart in the search on the left hand side - under Investigate Metrics - of the screen you will find the Metrics dataset and the metrics being produced by your host instances.
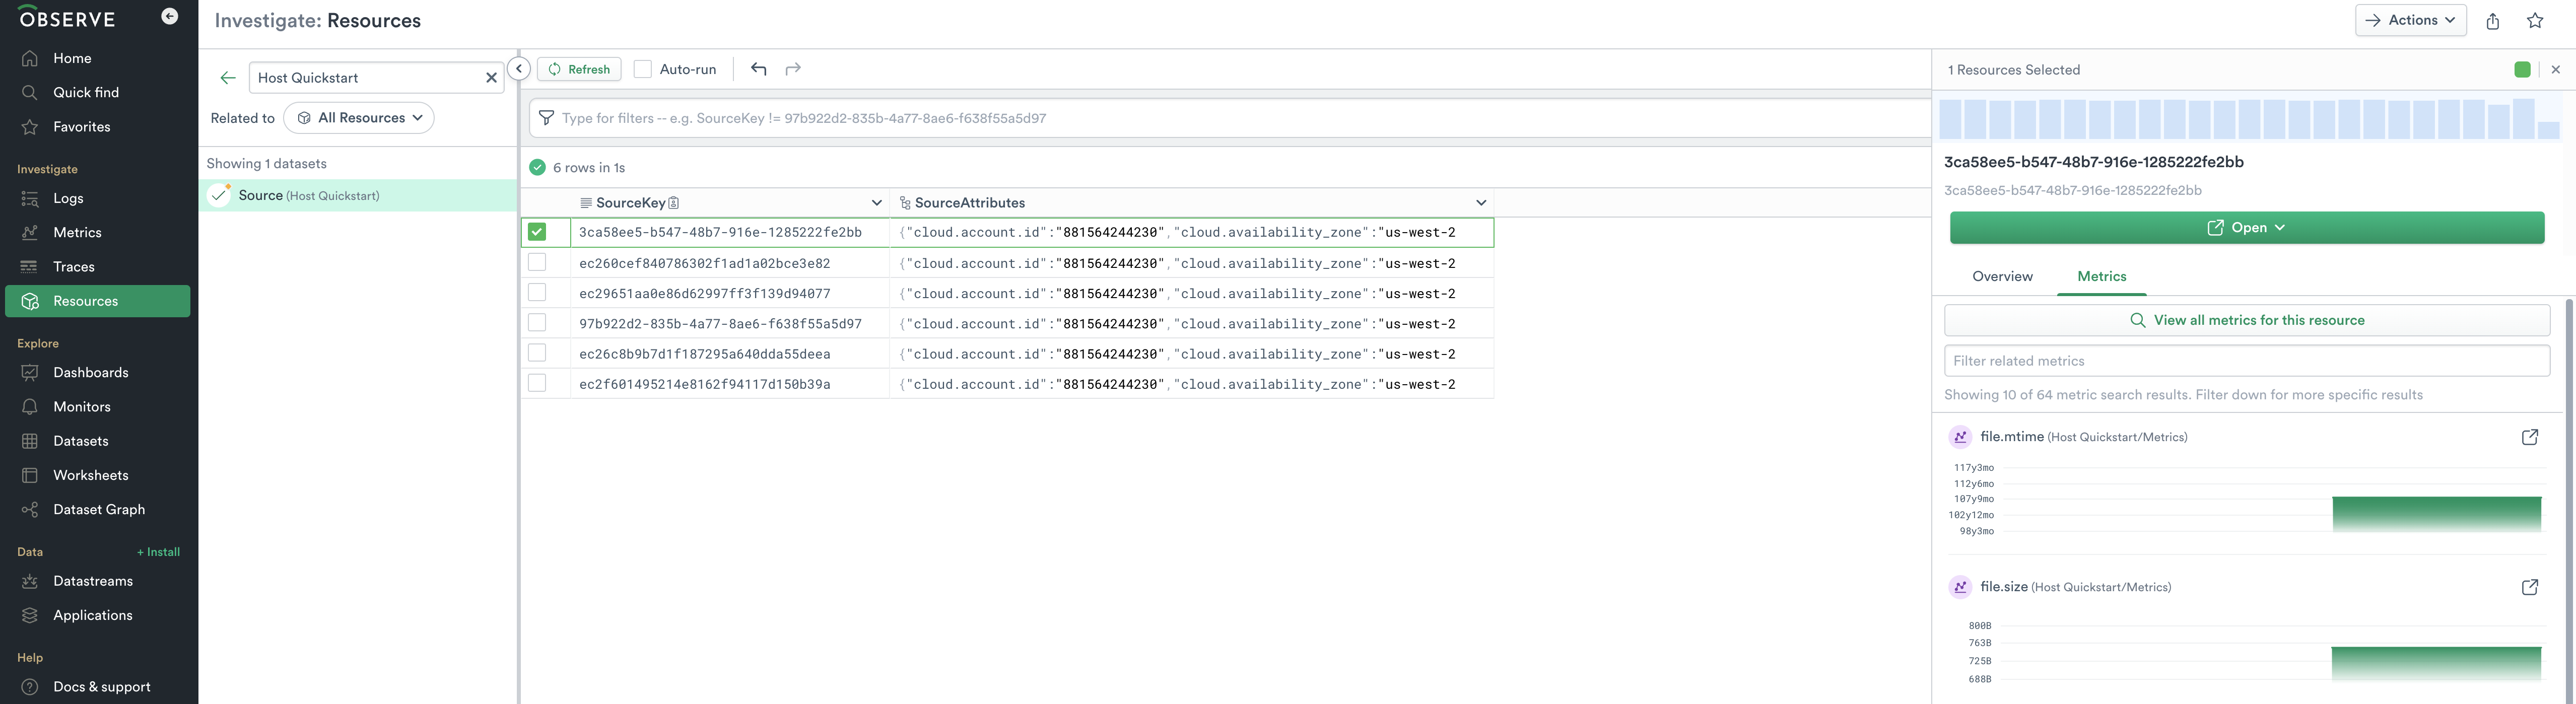
Source Dataset
The Source dataset can be viewed in the Resource Explorer. If you type Host Quickstart in the search on the left hand side - under Investigate Resources - of the screen you will find the Source dataset and the hosts emitting telemetry.