Log-derived metrics
Learn how you can extract metrics directly from your logs.
Log-derived metrics enable you to extract metrics directly from your logs instead of from app or agent instrumentation. Using log-derived metrics, you can optimize your dashboards by drilling into the data you really care about.
Public preview featureYou may access and use this preview feature solely for internal evaluation purposes. Previews are provided as-is. Your use of this preview is subject to the Snowflake Preview Terms located at https://www.snowflake.com/en/legal.
Manage log-derived metrics in Observe
Perform the following steps to manage log-derived metrics in Observe:
- Hover over your username, then select Manage account.
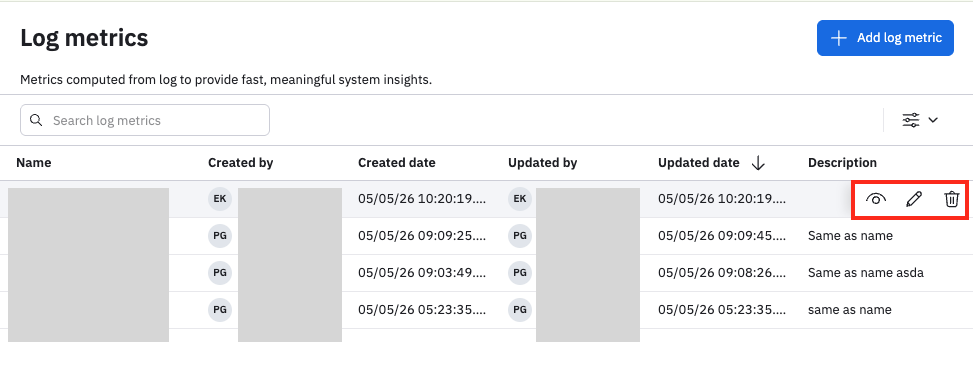
- Click Log metrics.
- Hover on any log metric to pivot to the Metric Explorer, edit the log metric, or delete the log metric.
Create a log-derived metric
Perform the following steps to create log-derived metrics in Observe:
- Hover over your username, then select Manage account.
- Click Log metrics.
- Click Add log metric.
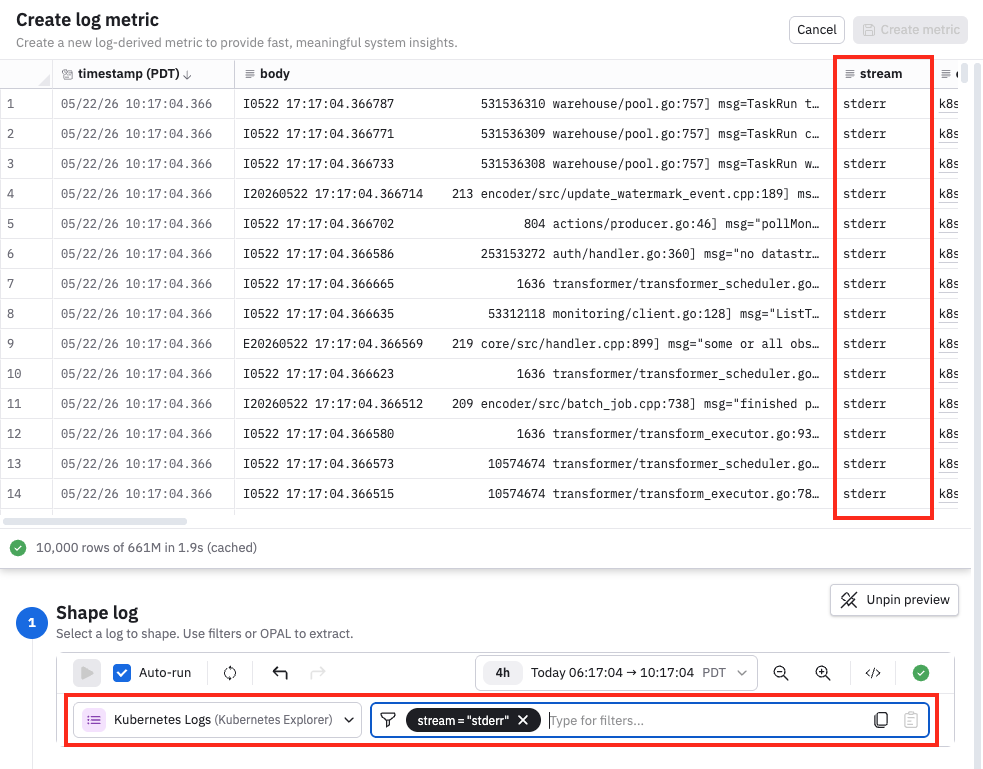
Select the Dataset and filter events
Begin by selecting the Dataset whose logs you will derive the metrics from, and specify any additional filtering you want to do. For example, we will look at Kubernetes logs where the stream is writing to stderr. Use the preview pane to verify you are getting the events you want.
Configure the metric value
Next, configure the metric value you want to monitor. For example, in our Kubernetes logs where the stream is stderr, we can count the total number of such events every 10 seconds.
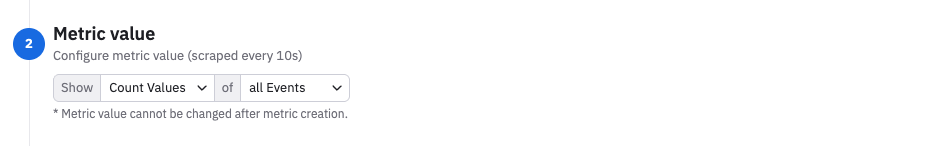
Once you set this value, it can't be changed later if you want edit the log-derived metric.
Select the dimensions
Select the fields you want to use metric tags. Without selecting any dimensions, you would get the total count of all stderr events. Observe automatically selects some values for you, based on the most common use cases for the data.
NoteIt's not recommended to select any dimension with high cardinality, as this can result in slower performance.
In this example, we just retain all the recommended values already selected for us. The selected dimensions are available to us later when we view this metric in the Metrics Explorer, in the Group by field.
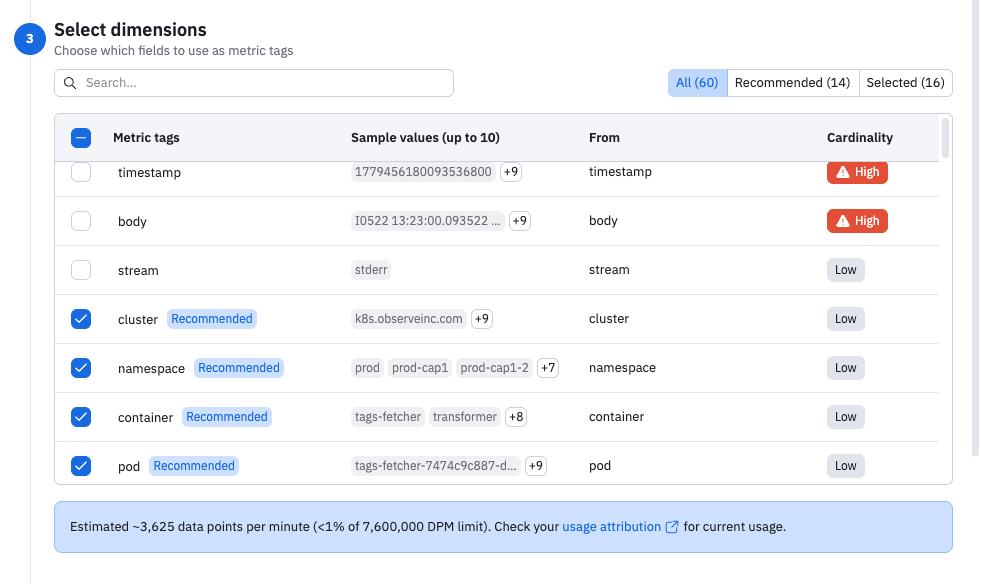
You can view some of the metadata around the table that informs you of the total number of dimensions, how many are recommended (14), and how many are selected (16).
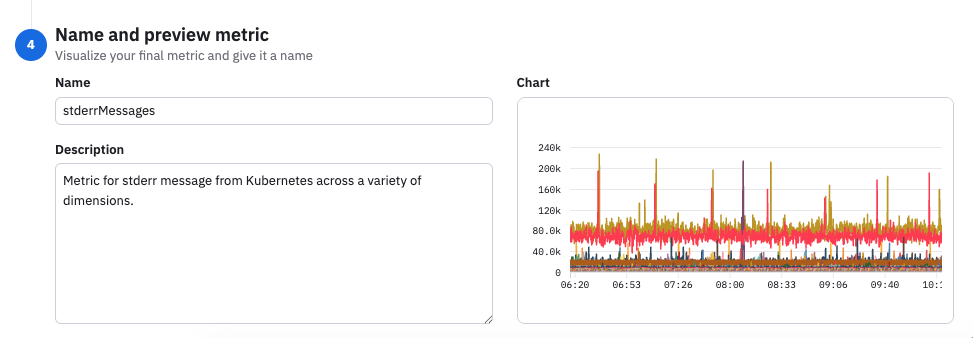
Provide a name and description, and preview the visualization
Continue scrolling in the derived metrics builder to provide a name and description, and also get visualization of your data.
The metric name can't have any spaces:
When you are done, click Create metric to save your changes, then click Create again to confirm you want to create this metric.
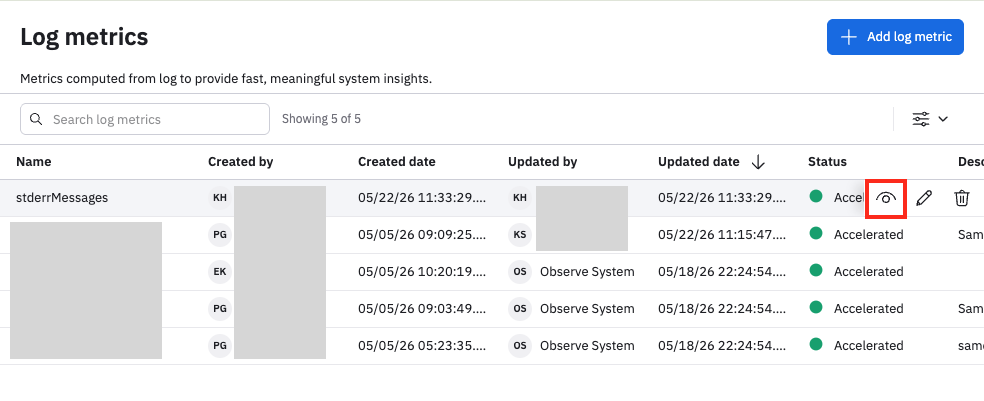
What's next?
After you create your log-derived metric, you can pivot to the Metrics Explorer. From the list of log-derived metrics, hover on the metric and select the eye icon:
We see the stderrMessages metric in the Metrics Explorer:
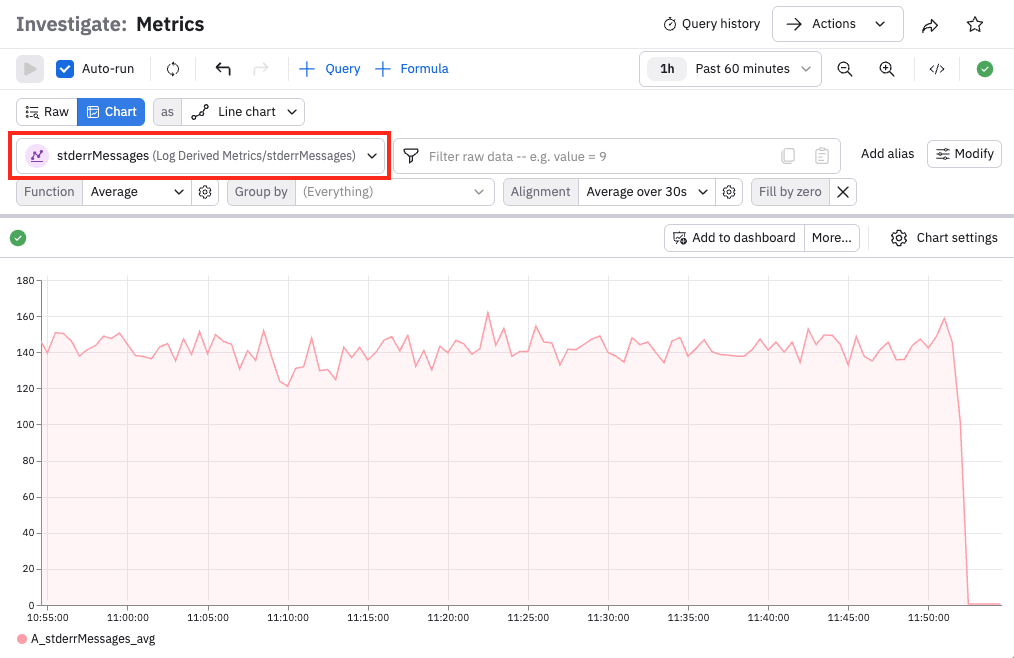
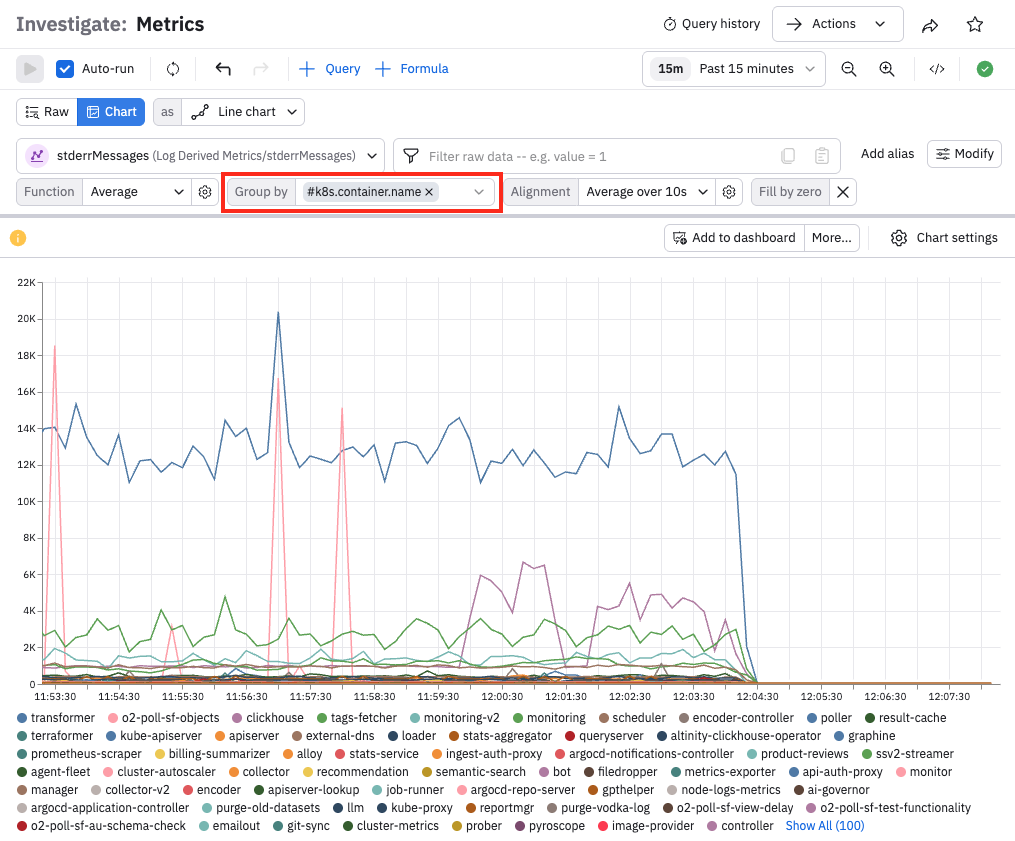
The dimensions we selected during the log metric creation are now available to use in the query bar. Instead of seeing the average of all stderr events, we can group the events by container name:
See Metrics Explorer to learn more about metrics workflows.
Log-derived metrics are managed as a Dataset.
- In the left navigation, click Datasets.
- Search for the Log Derived Metrics package, then find the stderrMessages Dataset.
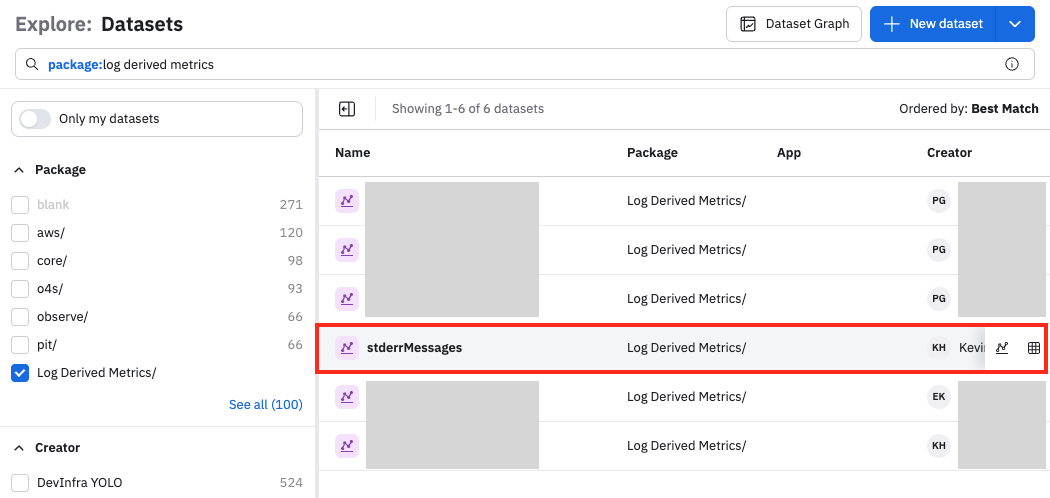
You can click on the name or the chart icon () to pivot to the Metrics Explorer, or click the Dataset icon () to view the Dataset properties. See Create and share Datasets.
Updated 11 days ago