

Instrument your applications using AI skills
Use Observe by Snowflake's AI skills from an agentic coding tool to add, fix, and validate OpenTelemetry instrumentation for your applications.
Public preview featureYou may access and use this preview feature solely for internal evaluation purposes. Previews are provided as-is. Your use of this preview is subject to the Snowflake Preview Terms located at https://www.snowflake.com/en/legal.
The following skills are available:
| Skill | Description |
|---|---|
opentelemetry-auto-instrumentation | Sets up OpenTelemetry auto-instrumentation for applications written in Java, .NET, Node.js, Python, and Ruby. |
opentelemetry-manual-instrumentation | Add custom instrumentation using the OpenTelemetry SDK for applications written in Go, C++, Java, .NET, Node.js, Python, and Ruby. |
opentelemetry-validation | Audit your instrumentation against Observe by Snowflake APM features and OpenTelemetry best practices. |
Prerequisites
You must have the Observe by Snowflake CLI installed for these skills to work. To install the CLI, run this command:
curl -fsSL [https://raw.githubusercontent.com/observeinc/cli/main/install.sh](https://raw.githubusercontent.com/observeinc/cli/main/install.sh) | bashTo confirm your installation, run the following command:
observe --version
NoteSome steps use experimental Observe by Snowflake CLI subcommands that require
OBSERVE_CLI_EXPERIMENTAL=1in your shell.
Install the required skills
Run the following commands to install the required Observe by Snowflake AI skills:
npx skills add observeinc/skills -s opentelemetry-auto-instrumentation
npx skills add observeinc/skills -s opentelemetry-validation
npx skills add observeinc/skills -s opentelemetry-manual-instrumentation
Authenticate the observe CLI to your tenant for the validation skill, and set OBSERVE_CLI_EXPERIMENTAL=1 because the skill calls experimental subcommands.
Example scenario: OpenTelemetry auto instrumentation
Target the opentelemetry-auto-instrumentation skill towards your application codebase from a coding agent like Snowflake CoCo, Claude Code, Cursor, or similar. The prompt can be as simple as follows:
Help me instrument this appOnce triggered, a typical agent goes through the following steps:
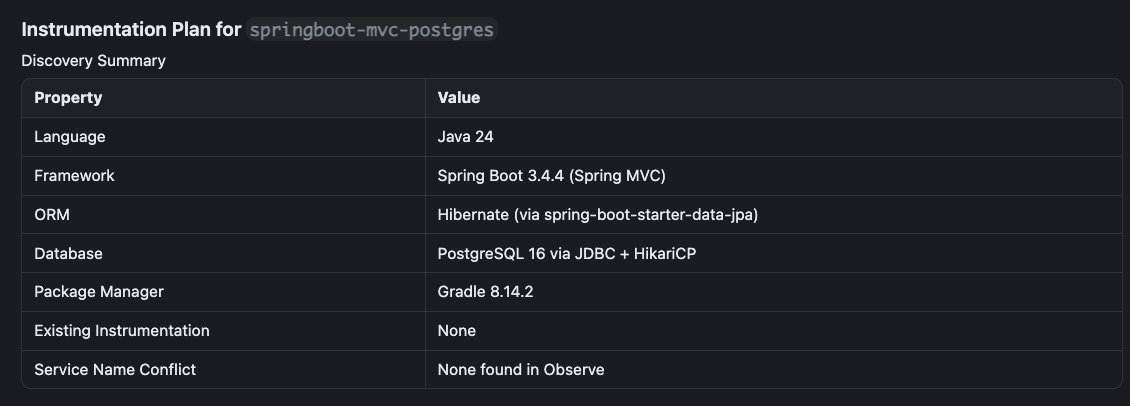
Project discovery
The agent should interpret details about your project, such as installed libraries and frameworks, build and runtime tools, and so on.
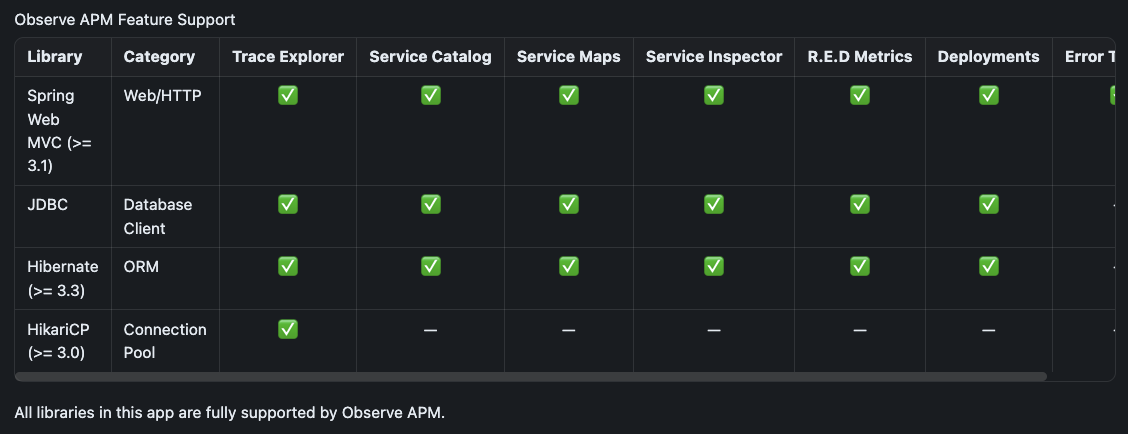
Observe by Snowflake APM feature compatibility
The agent provides a detailed breakdown of various features in Observe by Snowflake APM corresponding to your application stack:
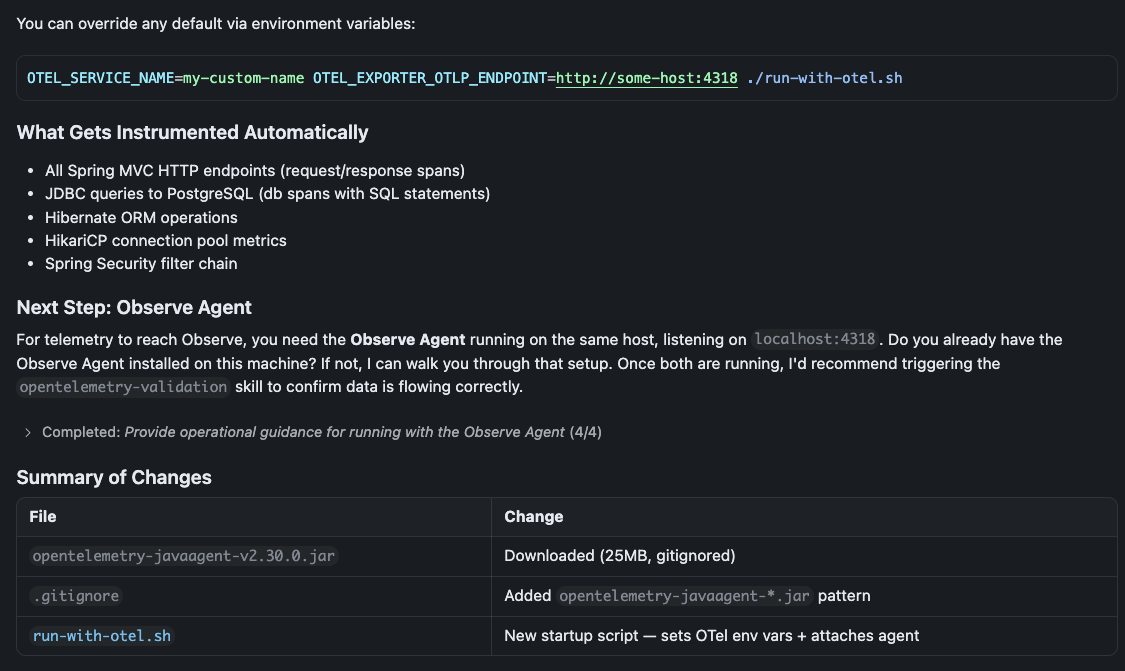
Configuration and handoff
Once the appropriate instrumentation steps are executed, the agent provides a summary of changes, along with next steps, such as setting up the Observe Agent for your environment.
Example scenario: OpenTelemetry manual instrumentation
NoteThe walkthrough below is one example session. Your agent's steps and output will vary with your codebase, the signal you ask for, and the coding agent you run it from.
Target the opentelemetry-manual-instrumentation skill at your application codebase from a coding agent like Snowflake CoCo, Claude Code, Cursor, or similar. Name the outcome you want to see:
Help me add a metric so I can chart spend by categoryThe skill covers spans, metrics, logs, attribute enrichment, and context propagation, and it works on instrumentation you already have.
What the agent does
The agent reads your project first: language and runtime, package manager, entrypoint, and any OTel or vendor instrumentation already in place.
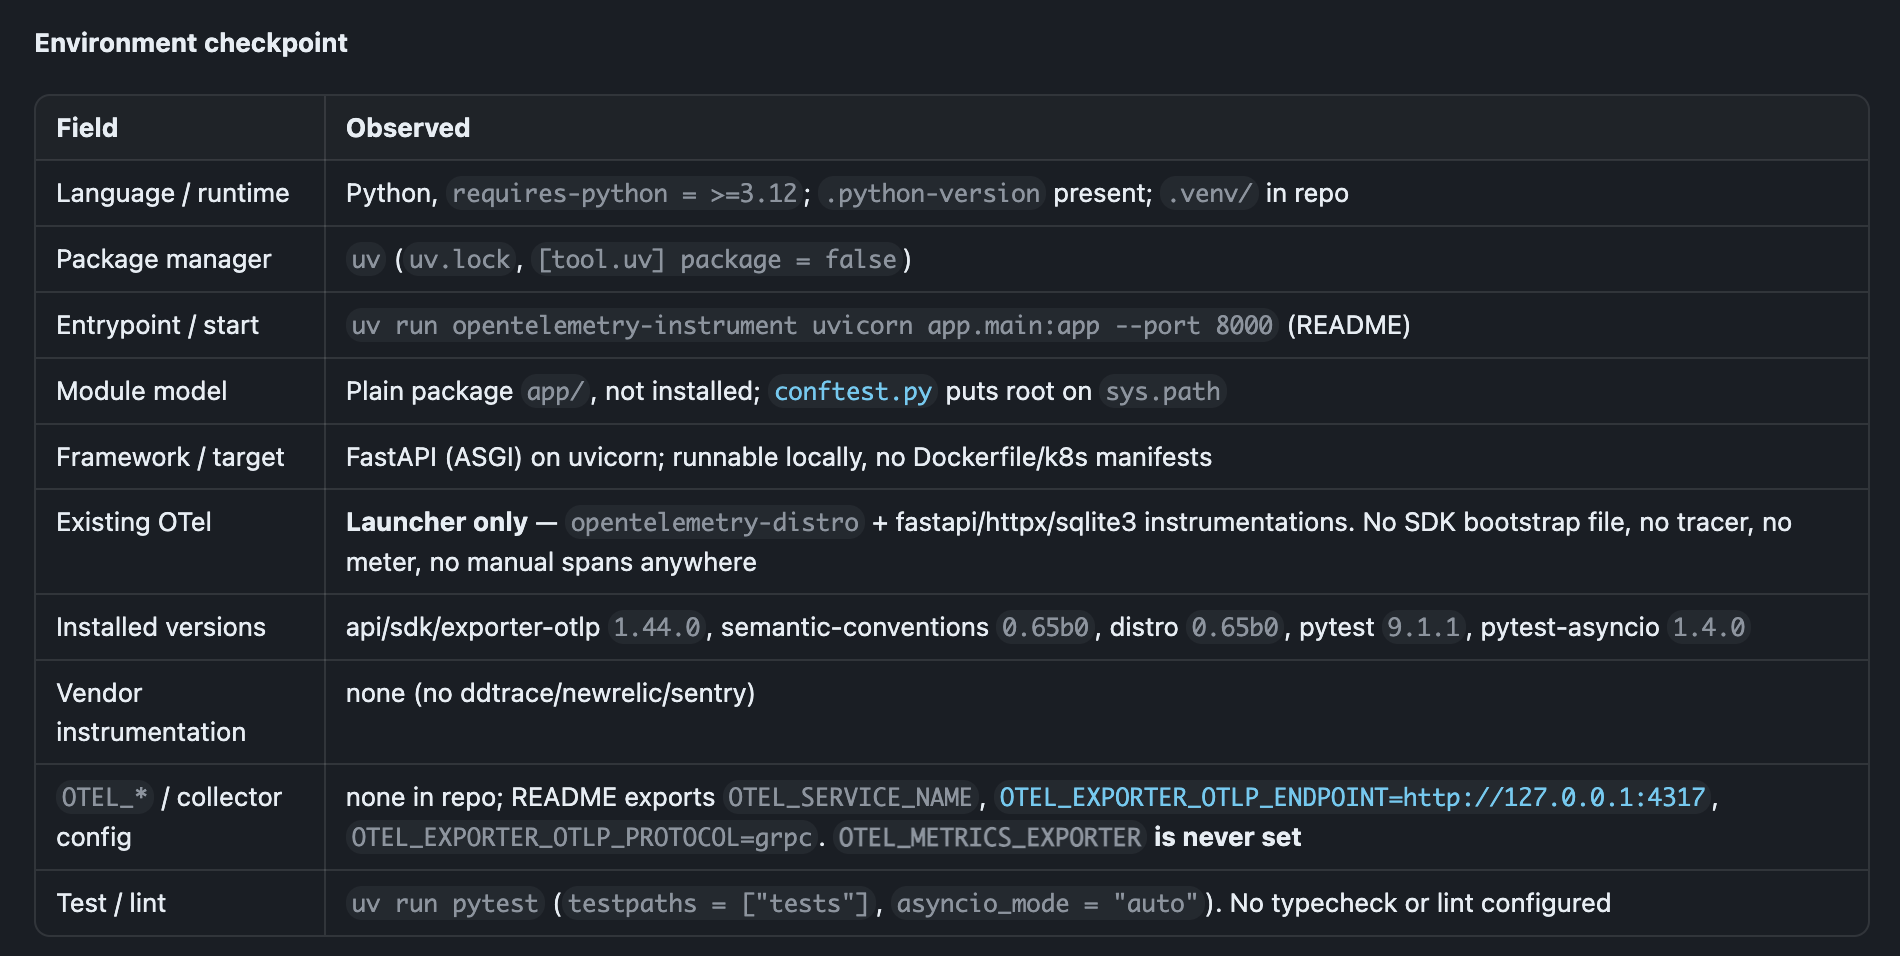
From there it works through four steps.
Plan and sign-off
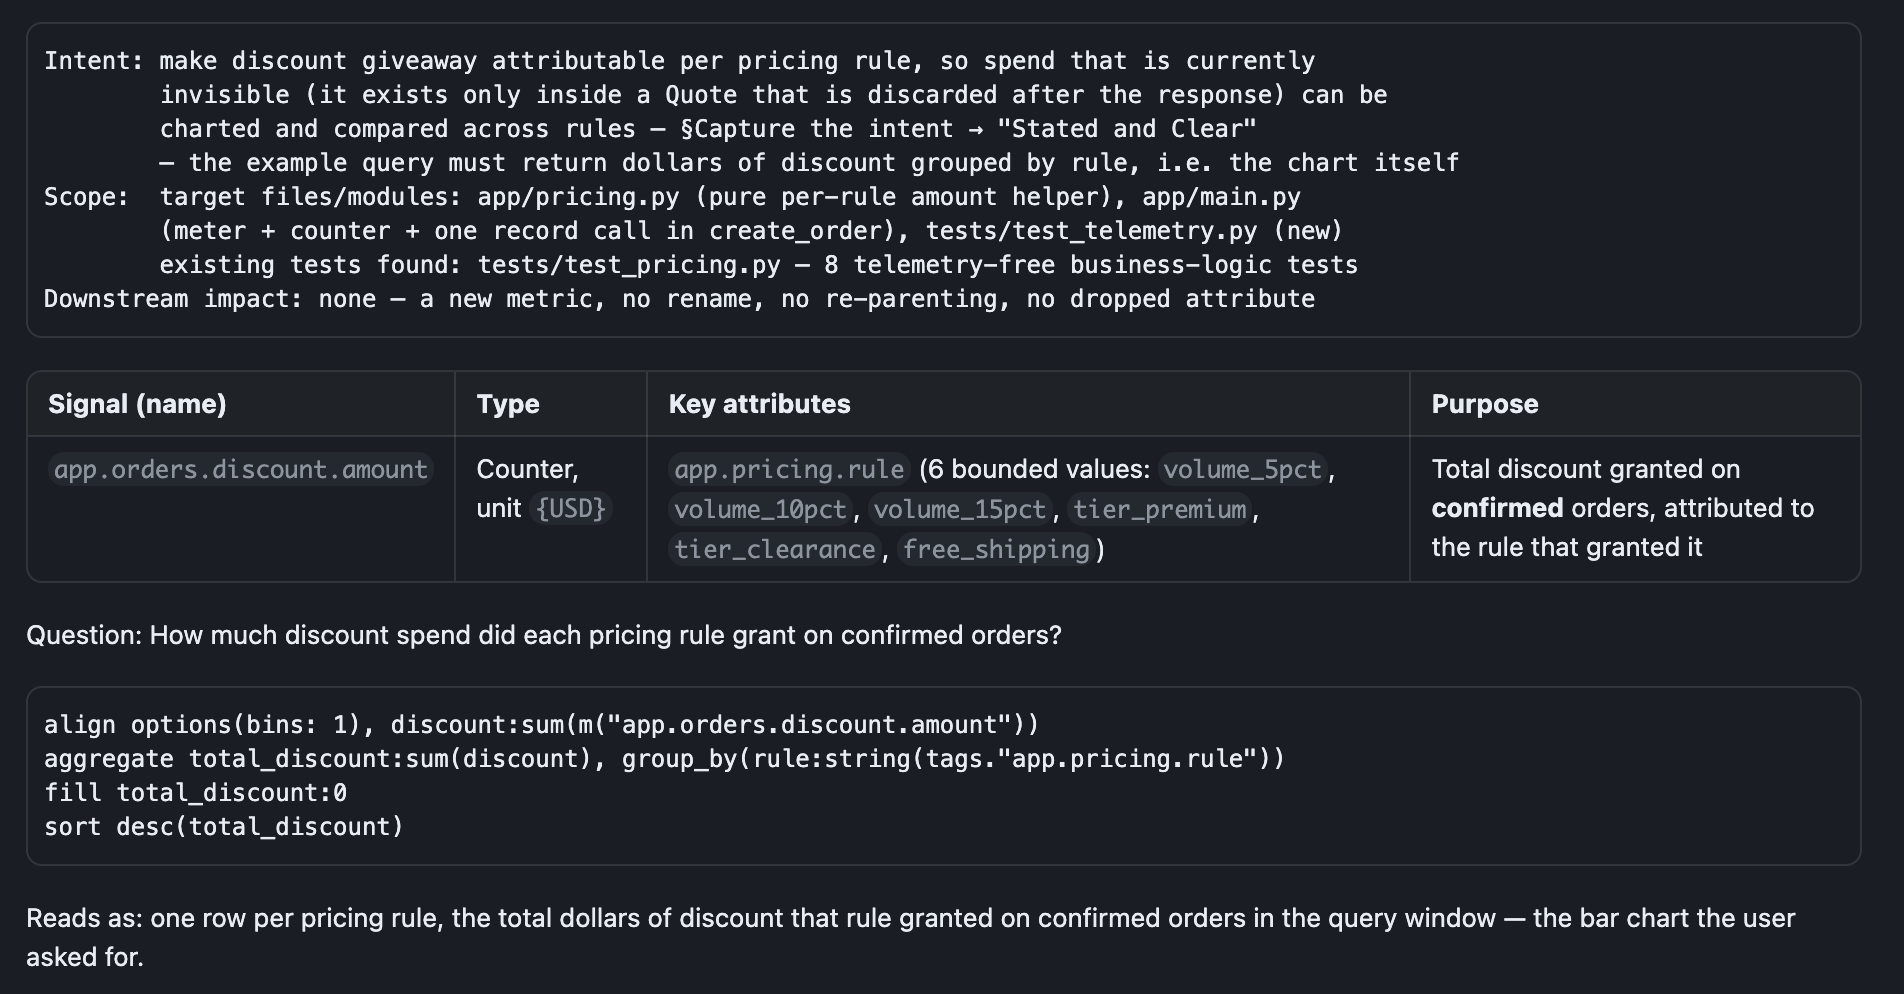
It shows you the plan before it edits: which signal it adds, where in your code it records, and which attributes it carries. It names the tradeoff behind each option, whether that is span granularity or metric label cardinality, and stops to ask when a choice would change what the telemetry means.
Instrumentation
It instruments the path in the plan and keeps business logic on the OTel API, so it never fights an auto-instrumentation launcher for ownership of the provider.
Telemetry unit tests
The tests drive your real handlers through an in-memory exporter and assert on what came out, including the paths where nothing should be recorded.
Adversarial review
A second subagent with its own context re-reads the diff against the skill's rules and can send the agent back to fix what it finds.
Report
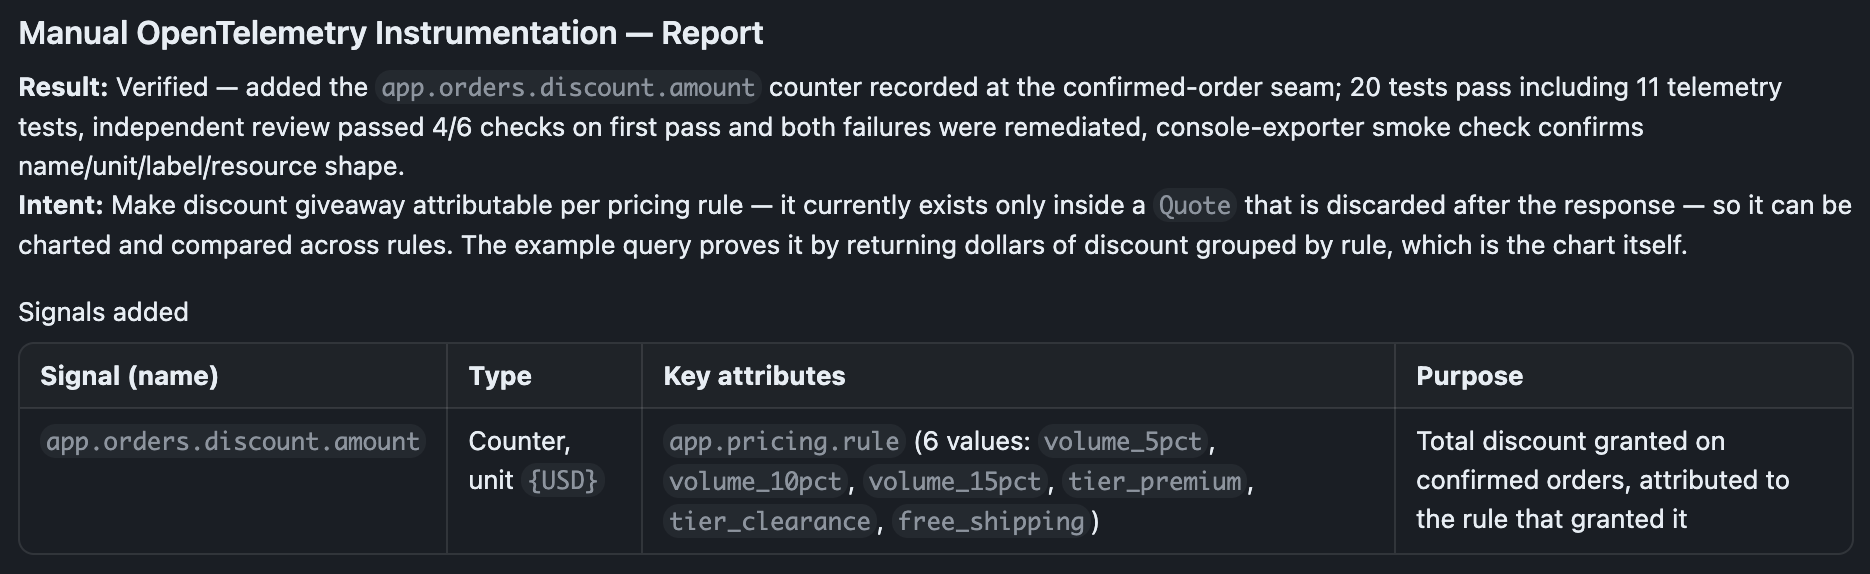
The report opens with the verdict and a table of every signal it added: name, type, key attributes, and what each one is for.
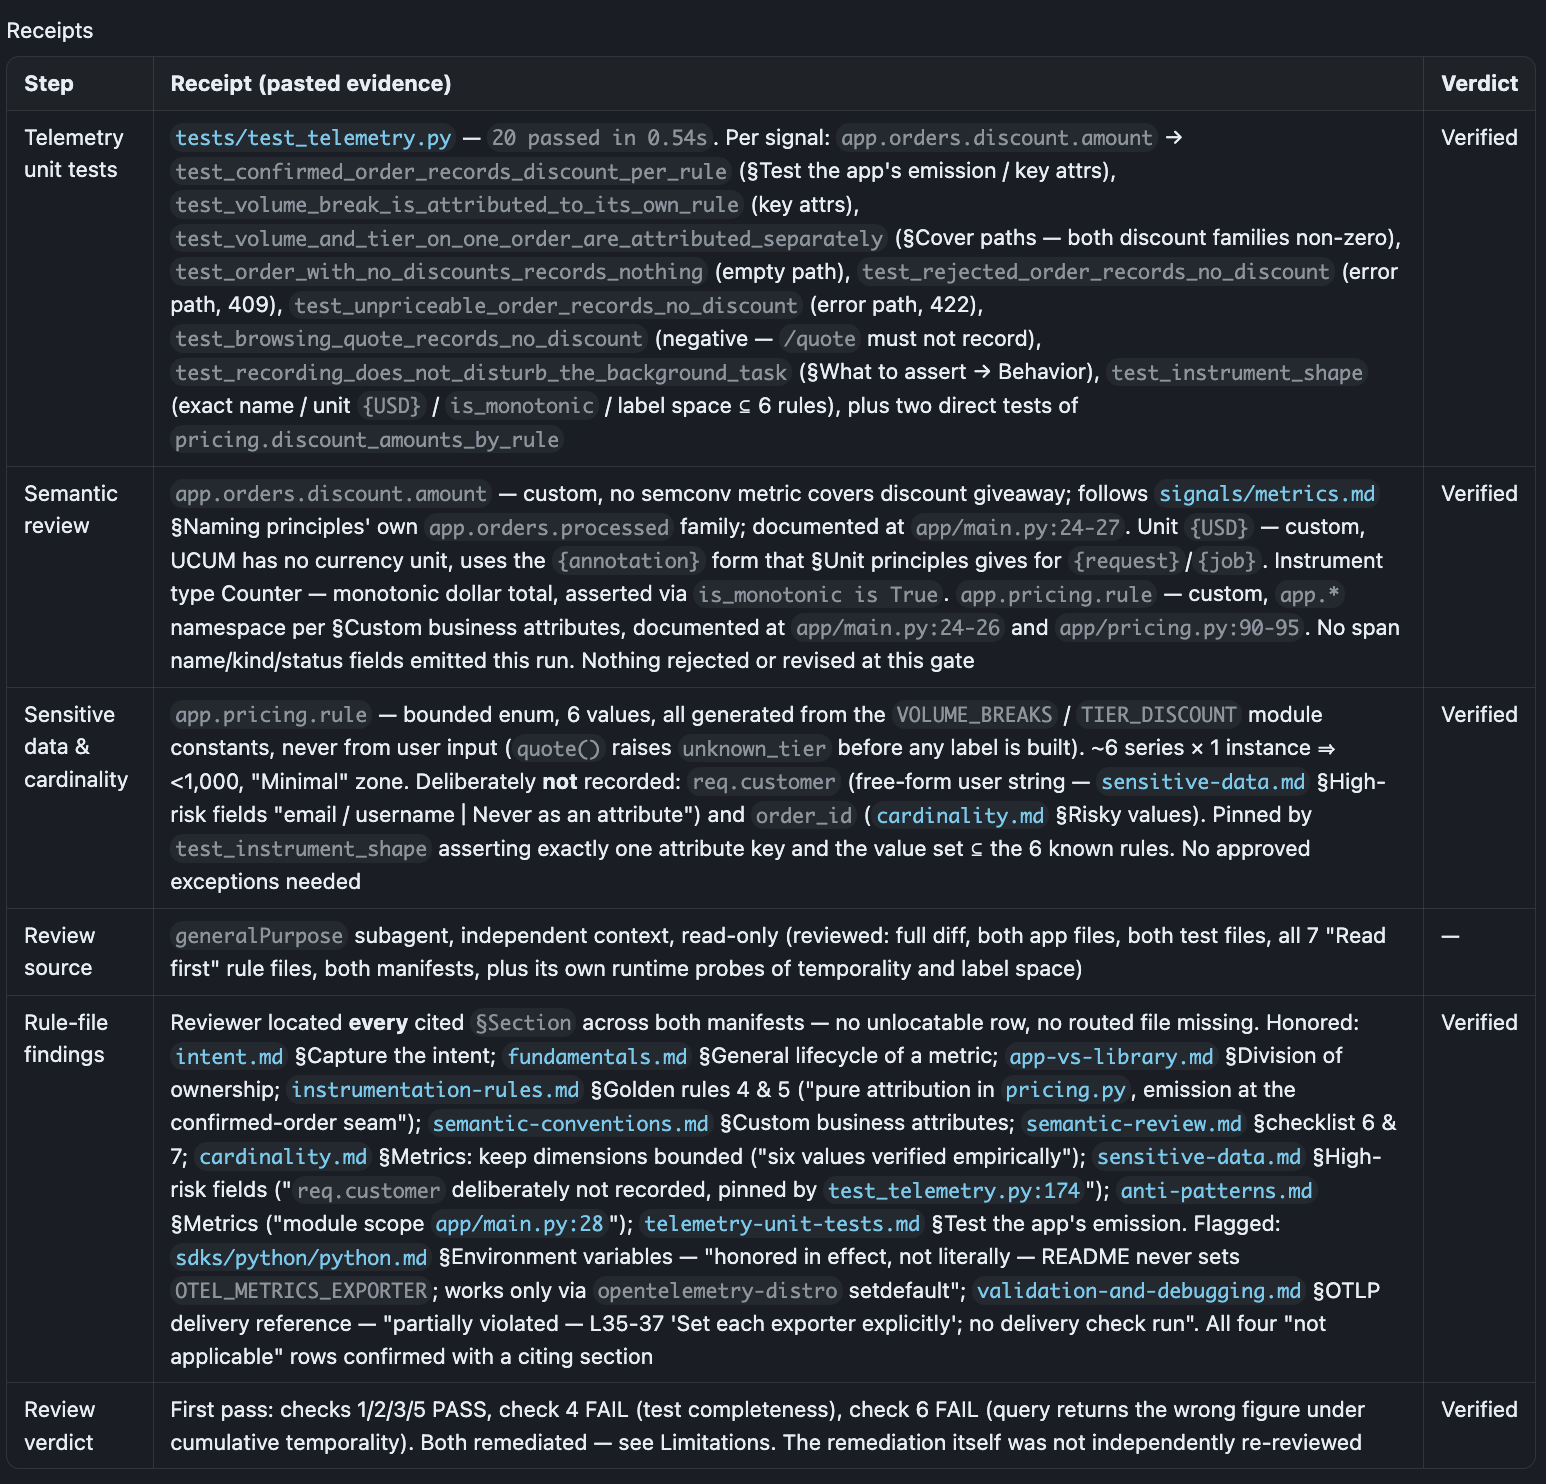
Below that it backs each claim with pasted evidence: test output, cardinality bounds, the sensitive fields it left out, and the semantic-convention decisions it made.
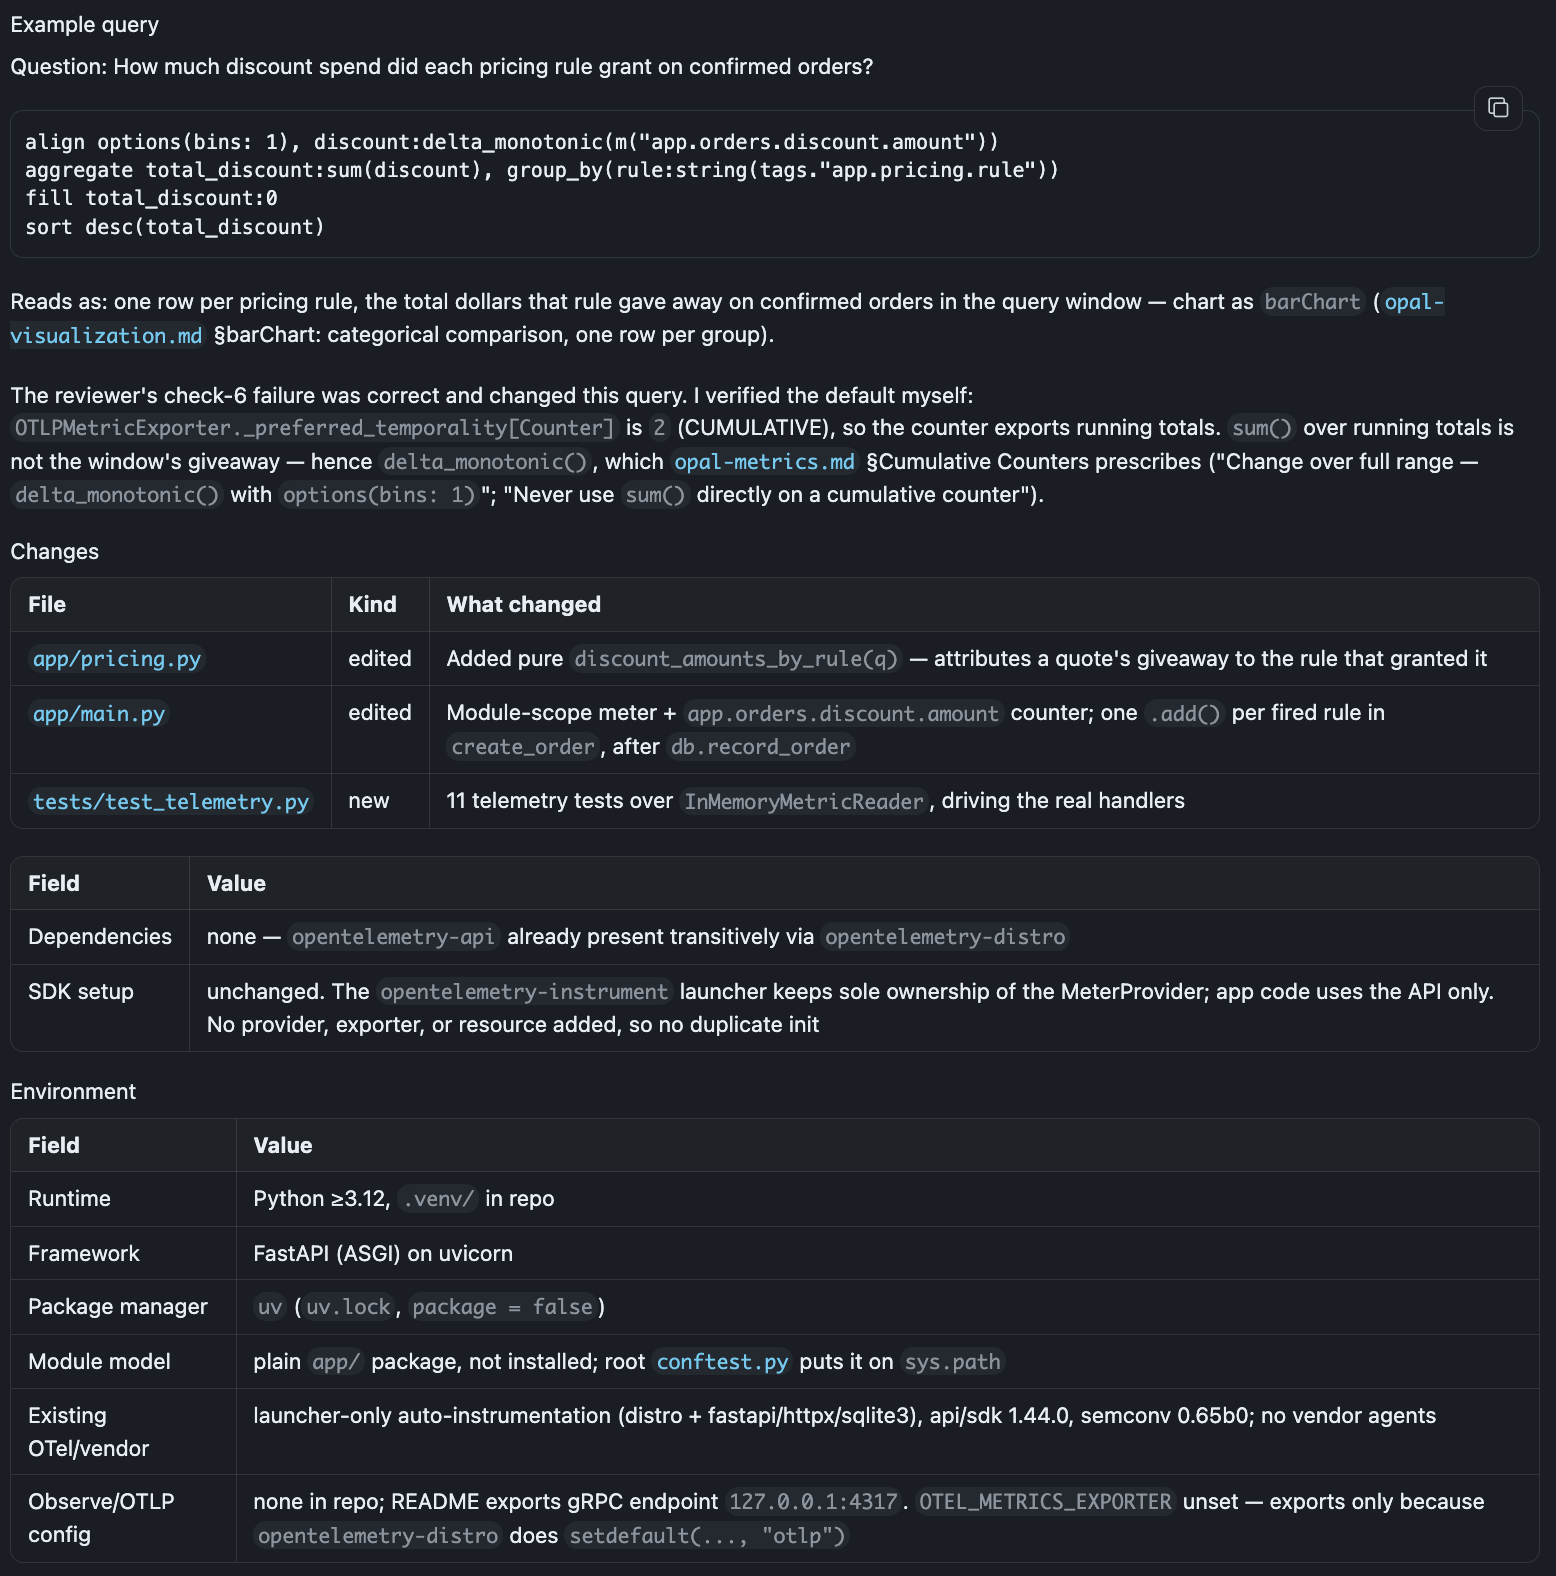
It closes with an OPAL query that answers your original question, which you can paste straight into Observe by Snowflake, followed by the files it changed and the environment it detected.
End-to-end verification (optional)
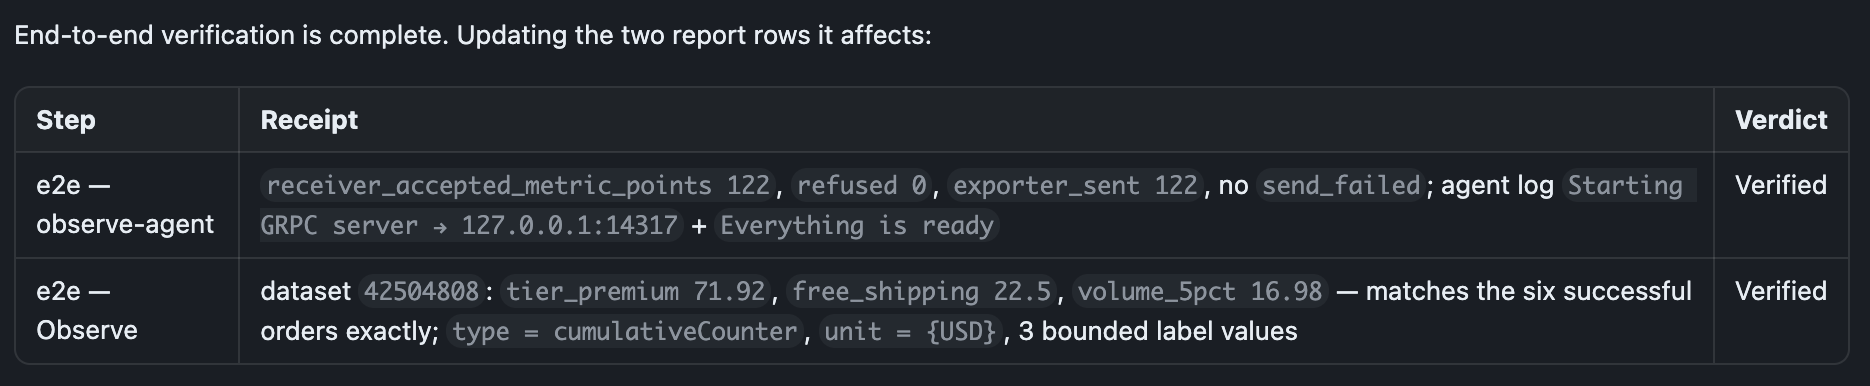
Unit tests prove in-process emission only. Ask for end-to-end verification and the agent plans the run, then hands you each mutating command to approve before it runs. Deploying the Observe Agent, starting your app against it, and driving traffic stay yours. It confirms delivery twice, at the agent's own counters and then with a query against your Observe by Snowflake Dataset, and reports each level as a row with its receipt attached.
Example scenario: OpenTelemetry validation
NoteThis is one example session. Your agent's steps and output change with your service, the tenant you point at, and the coding agent you run it from.
The opentelemetry-validation skill is a standalone check against a service that is already instrumented, running, and taking traffic. It confirms the telemetry reached Observe by Snowflake and conforms to OpenTelemetry semantic conventions and Observe by Snowflake APM's expectations. Target the opentelemetry-validation skill at your application codebase from a coding agent like Snowflake CoCo, Claude Code, Cursor, or similar:
Validate my instrumentation in ObserveAuthenticate the CLI with observe auth login first, since validation runs against the tenant it points at. The agent handles OBSERVE_CLI_EXPERIMENTAL=1 itself.
What the agent does
Scope and safety checks
The agent confirms the authenticated tenant with you, then collects the scope every check filters on: service.name, deployment.environment.name, and optional service.namespace. It also asks whether traffic was sent and whether service.version is set.
Ingest pipeline pre-check
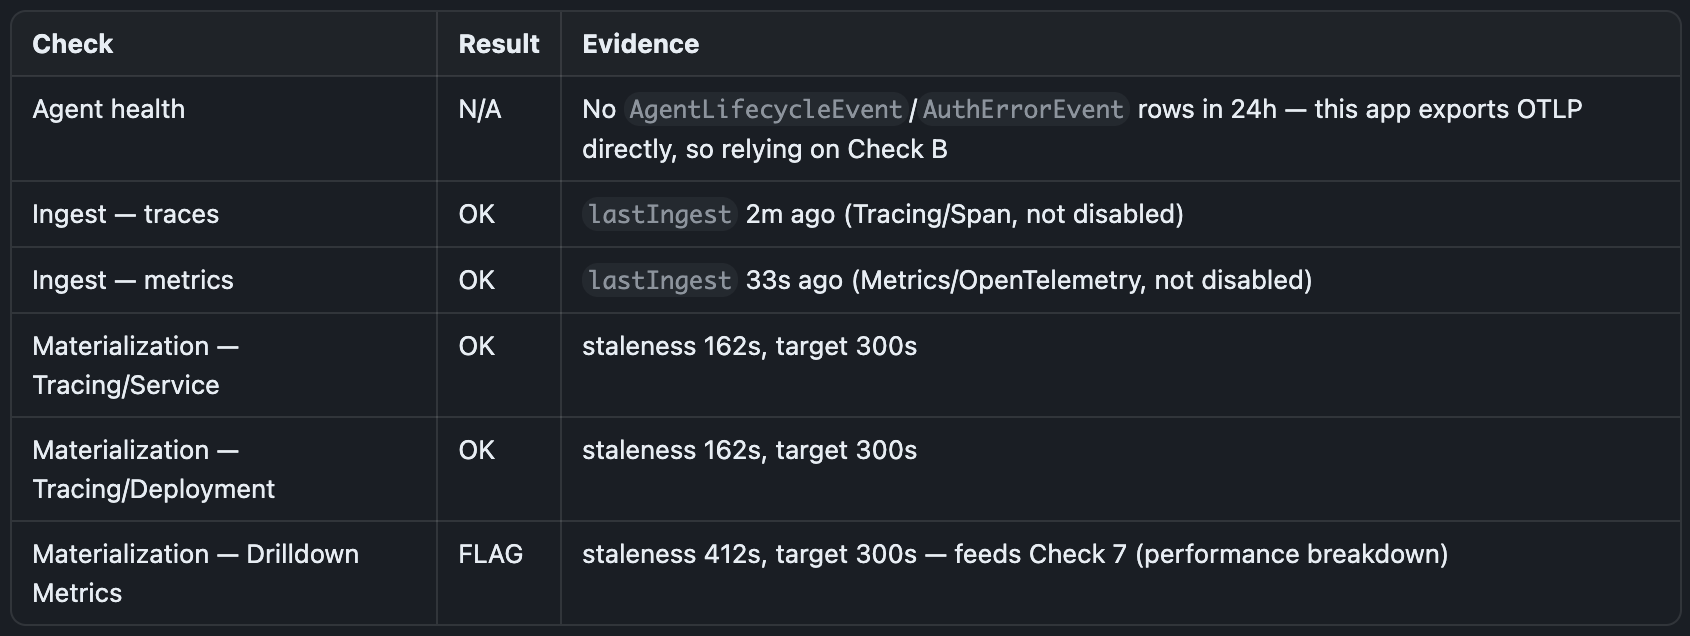
Before any service-scoped check, the agent verifies the collection layer so a broken pipeline is not misread as broken instrumentation. It checks agent health, ingest freshness on the Tracing/Span and Metrics/OpenTelemetry Datastreams, and materialization lag on the derived Datasets the checks read. A flag here surfaces first.
Validation checks
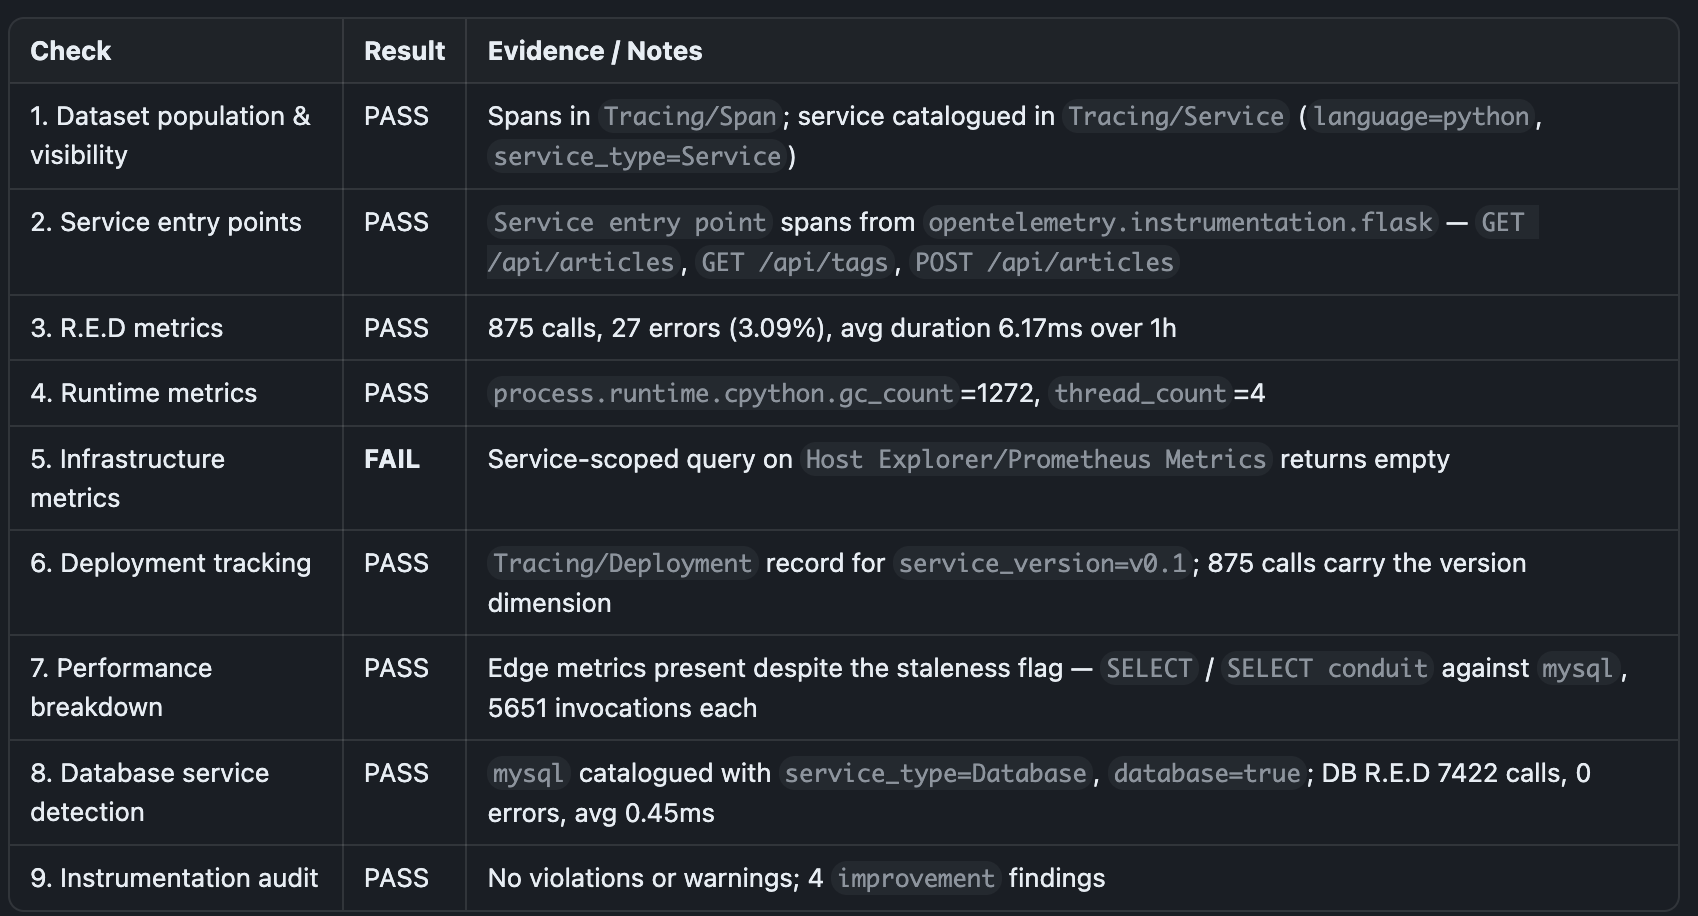
The agent runs nine checks in order and marks each PASS, FAIL, PENDING, or SKIP:
- Dataset population and service visibility
- Service entry points
- R.E.D metrics
- Runtime metrics
- Infrastructure metrics
- Deployment tracking
- Performance breakdown
- Database service detection
- Instrumentation audit
The audit is the most thorough check. It compares spans and span events against OpenTelemetry semantic conventions for HTTP, database, RPC, and messaging attributes, span-name cardinality, error and exception consistency, and schema version drift.
Report
The report opens with a per-check table, each row backed by the query evidence behind its result.
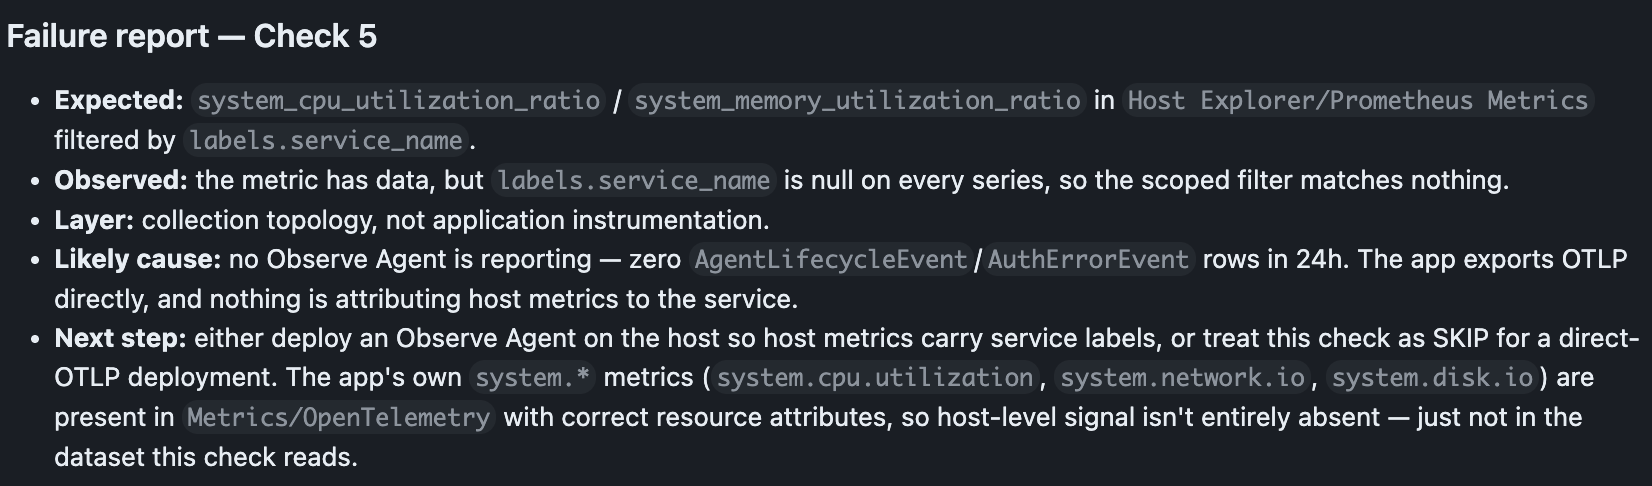
Every FAIL carries a failure report: what was expected, what the query returned, which layer broke, the likely cause, and the next step. The agent separates a collection or ingest problem from an instrumentation one, so a missing Observe Agent does not read as a bad service.
The audit fails on any violation or warning finding and passes otherwise. It still lists improvement and information notes, each with the counts behind it.

A PENDING check waits and retries once, since derived telemetry can trail live traffic. A pre-check flag does not force a failure on its own.
Troubleshooting a symptom
State a symptom instead of asking for a full pass, and the skill switches to its troubleshooting flow:
My service isn't showing up in ObserveThe agent confirms the tenant, runs the same pre-check, then sorts the symptom into one of five classes: no service visible, no spans, partial coverage, stale data, or inconsistent telemetry. It walks the layers from export to materialization to find the earliest break, then reports the root failure apart from the checks that fail because of it.
Updated 27 days ago